Pedro Afonso Magalhães Centeno
Licenciado em Ciências de Engenharia de Micro e Nanotecnologia
Self-cleaned Solar Cells with Super-Hydrophobic
Photonic Nano-structures
Dissertação para obtenção do Grau de Mestre em
Engenharia de Micro e Nanotecnologias
Orientador: Prof. Dr. Manuel João de Moura Dias Mendes,
Post-Doc Fellow and Invited Assistant Professor, FCT-UNLCo-orientador: Prof. Dr. Hugo Manuel Brito Águas, Associate Professor, FCT-UNL
Júri:
Presidente: Prof. Doutor Rodrigo Fernão Paiva Martins
Arguente: Prof. Doutora Joana Dória Vaz Pinto
Vogal: Prof. Doutor Manuel João de Moura Dias Mendes
Self-cleaned Solar Cells with Super-Hydrophobic Photonic Nano-structures iii
Self-cleaned Solar Cells with Super-Hydrophobic Photonic Nano-structures
Copyright © Pedro Afonso Magalhães Centeno, Faculdade de Ciências e Tecnologia, Universidade Nova de Lisboa, 2018.
Self-cleaned Solar Cells with Super-Hydrophobic Photonic Nano-structures v
Acknowledgement
Em primeiro lugar, gostaria de agradecer à Professora Dra. Elvira Fortunato e ao Professor Dr. Rodrigo Martins pela criação e desenvolvimento do curso de Micro e Nanotecnologias e pelas condições oferecidas no CENIMAT|i3N e no CEMOP.
Gostaria de agradecer ao meu orientador, Professor Dr. Manuel Mendes e ao meu co-orientador, Professor Dr. Hugo Águas, pela introdução do tema, o qual se revelou incrivelmente interessante e estimulante, pelo apoio com os problemas que fui apresentando e, especialmente, pela paciência e disponibilidade prestados ao longo deste tempo.
À Olalla, pelas formações a equipamentos e pelos conselhos.
À Alexandra Gonçalves e à Sónia Pereira pela formação em equipamentos e, especialmente, pelo fornecimento de material (mesmo a des-horas).
Um agradecimento sentido à Professora Marta Corvo, pelo apoio técnico na sala de RMN (desculpe qualquer coisinha).
À Professora Helena Godinho pela introdução à bíblia de de Gennes.
À Professora Rita Branquinho por toda a ajuda prestada, por me dar formação em vários equipamentos e, sobretudo, pela paciência infinita.
Ao Tomás por me fazer uns quantos testes no AFM e pelos almoços ali pela cova e tal e à Daniela Gomes pelas sessões de SEM.
Ao Tiago Mateus por me orientar com as medidas das células solares e pela disponibilidade em tudo.
Ao Jonas Deuermeier pelas sessões de XPS e por toda a ajuda, que foi preciosa.
À Ana Santa, à Cátia, à Inês Martins e ao Trigo por me acompanharem à càmara limpa e por toda a ajuda que me deram. Cátia e Inês, sem vocês o parileno não seria o mesmo.
À Jenny Boane e ao João Luís por tudo.
Obrigado a toda a gente que, não estando no ambiente de trabalho, me estimularam para dar o melhor, sempre.
Self-cleaned Solar Cells with Super-Hydrophobic Photonic Nano-structures vii
Abstract
This work has investigated the light scattering effect and self-cleaning (i.e. water hydrophobicity) properties of various micro/nano-structured front coatings for solar energy applications. This was done through enhancement of surface texturing, following a colloidal lithography methodology, which comprised the reactive ion etching of the material with a pre-deposited mask of a self-assembled monolayer of polystyrene microspheres. This process culminated in the formation of a surface patterned with micro structures.
Experimentally, the maximum water contact angles obtained were 140° and 167°, for PET and parylene-C materials, respectively. The results of scanning electron microscopy suggest the wettability properties change due to variations in surface roughness at micro and nano scales. Then, through x-ray photoelectron spectroscopy analysis, that change was associated with variations in surface chemistry. Droplet state transition from Wenzel state to Cassie-Baxter state for parylene was analytically demonstrated through examination of water advancing and receding contact angles.
It was observed that increasing plasma exposure results in an increase of reflectance and in a slight decrease of total transmittance. However, diffuse transmittance increased from 5% and 2% to above 60% for PET and parylene, respectively, which reveals potential for light trapping (via optical path length amplification). These changes are directly related to surface roughness modification and they intensify with colloidal lithography.
For proof-of-concept, a-Si solar cells were fabricated in superstrate (p-i-n) and substrate (n-i-p) configurations to evaluate the performance of the textured parylene as a
photonic-structured encapsulant. The measured devices showed a photocurrent ( ) enhancement up
Self-cleaned Solar Cells with Super-Hydrophobic Photonic Nano-structures ix
Resumo
Este trabalho investigou as propriedades de dispersão de luz e auto-limpeza (i.e. hidrofobicidade da água) de vários revestimentos frontais micro/nano-estruturados para aplicação em energia solar. Isto foi realizado através da otimização da texturização de superfície, seguindo uma metodologia de litografia coloidal, constituída pela erosão reativa iónica do material com recurso a uma máscara composta por uma monocamada de microesferas de polistireno auto-dispostas. Este processo culminou na formação de uma superfície modelada com microestruturas.
Experimentalmente, os ângulos de contato máximos da água obtidos foram 140° e 167°, para os materiais PET e parileno-C, respectivamente. Os resultados da microscopia eletrónica de varredura sugerem que as propriedades de molhabilidade mudam devido a variações na rugosidade superficial às micro- e nano-escalas. Assim, através da análise de espectroscopia de fotoeletrões de raio-X, essa mudança foi associada a variações químicas da superfície. Foi ainda analiticamente demonstrado, através do estudo dos ângulos de contato de avanço e de recuo em parileno, um estado de transição entre os estados de Wenzel e de Cassie-Baxter.
Observou-se que o aumento do tempo do tratamento de plasma resulta no aumento da reflectância e na ligeira diminuição da transmitância total. No entanto, a transmitância difusa aumentou de 5% e 2% para valores acima de 60% para PET e parileno, respectivamente, o que revela potencial para difusão de luz (pela amplificação do comprimento do caminho óptico). Estas alterações estão diretamente relacionadas com a modificação da rugosidade superficial e são intensificadas com o uso de litografia coloidal.
Self-cleaned Solar Cells with Super-Hydrophobic Photonic Nano-structures xi
Abbreviations
ACA – Advancing CA
AFM – Atomic Force Microscopy
a-Si - Amorphous Silicon
CA – Contact Angle
CEMOP - Center of Excellence in Microelectronics Optoelectronics and Processes
CL – Colloidal Lithography
COS – Consecutive-O2-SF6
CVD – Chemical Vapor Deposition
EDS – Energy Dispersive Spectroscopy
EQE – External Quantum Efficiency
FWHM – Full-width-half-maximum
IPA – 2-propanol I-V – current-voltage
ITO – Indium Tin Oxide
LED – Light emitting diode
LB – Langmuir-Blodgett
PECVD – Plasma enhanced chemical vapor deposition
PEN - Polyethylene naphthalate PET - Polyethylene terephthalate PS – Polystyrene
PV – Photovoltaic
RCA – Receding CA
RF – Radio Frequency
RIE – Reactive Ion Etching
R – Diffuse Reflectance
RS – Specular Reflectance
RT – Total Reflectance
SEM – Scanning Electron Microscopy
TD – Diffuse Transmittance
TS – Specular Transmittance
TT – Total Transmittance
UV-VIS-NIR – Ultraviolet-Visible-Near-infrared
Self-cleaned Solar Cells with Super-Hydrophobic Photonic Nano-structures xiii
Symbols
– fraction of solid-liquid contact interface η – Efficiency
Rf – Roughness Factor
– Contact Angle
– Surface Tension
– Short Circuit Current Density
FF – Fill Factor
Self-cleaned Solar Cells with Super-Hydrophobic Photonic Nano-structures xv
Table of Contents
Acknowledgement
... vAbstract
... viiResumo
... ixAbbreviations
... xi
Symbols
... xiii
List of Tables
... xvii
List of Figures
... xix
Motivation and Objectives
... xxiii
1
Introduction
... 1
1.1
Self-cleaning in solar cell technology... 1
1.2
Wettability ... 2
1.3
Photonic front structures ... 5
2
Materials and Methods
... 7
2.1
Substrate preparation ... 7
2.2
Parylene-C Deposition ... 7
2.3
Nano/micro-structures formation ... 7
2.3.1
PS microspheres deposition ... 8
2.3.2
Reactive Ion Etching (RIE)... 8
2.4
Contact Angle Measurements ... 9
2.5
Optical Characterization ... 9
2.6
Surface Characterization ... 9
2.7
Solar Cell Fabrication and Opto-electronical Characterization ... 10
3
Results and Discussion
... 11
3.1
Screening of base materials ... 11
3.2
Screening of Precursor Microspheres for Patterning ... 13
3.3
Surface Topography Development ... 15
3.3.1
Analysis of microspheres’ shaping through RIE
... 15
3.3.2
Analysis of surface patterning ... 16
3.3.3
Analysis of RIE-induced nano-roughness ... 18
3.4
Surface Chemistry Analysis ... 18
3.5
Contact Angle Measurements ... 20
Self-cleaned Solar Cells with Super-Hydrophobic Photonic Nano-structures xvi
3.5.2
Dynamic WCA ... 22
3.6
Analytical Comparison of Wettability Properties ... 23
3.7
Optical Measurements ... 25
3.8
Solar Cell Measurements ... 28
4
Conclusions and Future Perspectives
... 31
References
... 33
Appendix A
... 35
Appendix B
... 38
Self-cleaned Solar Cells with Super-Hydrophobic Photonic Nano-structures xvii
List of Tables
Table 2.3.1 – Studied parameters during RIE processing. ... 9 Table 3.1.1 – Contact angles and average transmittance of several untreated surfaces. ... 12
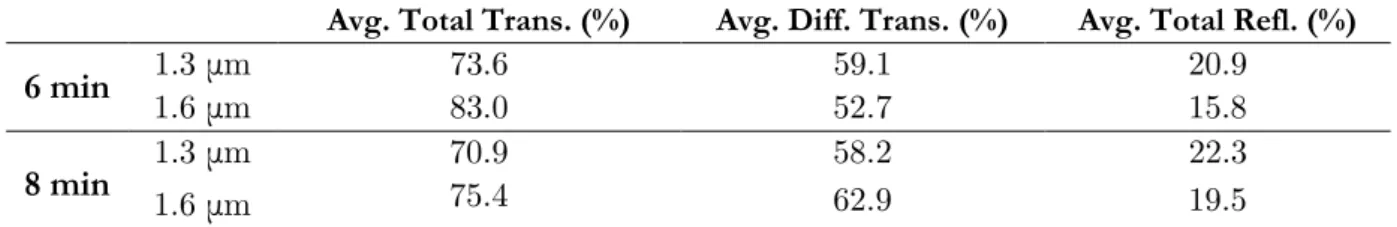
Table 3.2.1 – Average total and diffuse transmittance and average reflectance of 6 and 8
minute O2/SF6 plasma-treated parylene surfaces with 1.3 μm and 1.6 μm masking PS
spheres. ... 15 Table 3.3.1 – PS etching rate (approximate values) ... 16 Table 3.3.2 - Average diameter and height, with corresponding standard deviation, of the surfaces presented in Figure 3.3.2, as well as estimated etch rate by SEM. ... 17
Table 3.3.3 – Average diameter and height and respective standard deviation of the surface
presented in Figure 3.3.3 by AFM. ... 17 Table 3.4.1 – Quantification of surface atomic concentration ... 19
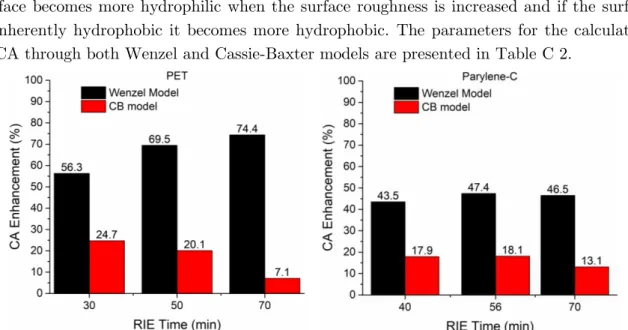
Table 3.6.1 – Comparison between CA values calculated through both Wenzel and
Cassie-Baxter models and experimental values. ... 25 Table 3.7.1 – Calculated average transmittance, haze, reflectance and absorbance. ... 28
Table 3.8.1 – Main parameters obtained from the I-V curves: Short-circuit current density,
open-circuit voltage, fill factor and efficiency, respectively... 28 Table 3.8.2 – Photocurrent values of a a-Si n-i-p solar cell. ... 30
Table A 1 – Reactive Ion Etching parameters influence. ... 37
Table C 1 – Detected functional groups from C 1s spectra deconvolution on (a) untreated
parylene, (b) O2 plasma-treated parylene and (c) O2-SF6 plasma treatment. ... 41
Table C 2 – Parameters for the calculation of CA through both Wenzel and Cassie-Baxter
models. ... 42 Table C 3 – Enhancement of parylene-C coated solar cells relative to reference solar cells. .. 44
Table C 4 – Enhancement of textured parylene-C coated solar cells relative to smooth
Self-cleaned Solar Cells with Super-Hydrophobic Photonic Nano-structures xix
List of Figures
Figure 1.1.1 – Example of solar panels cleaning system. ... 1 Figure 1.2.1 – Representation of the interactions on bulk and surface atoms. ... 2
Figure 1.2.2 – Representation of (a) water droplet static CA on a hydrophilic surface and the
surface energies of each interface, (b) CA on a hydrophobic surface and (c) dynamic CA w/ tilt method. ... 3
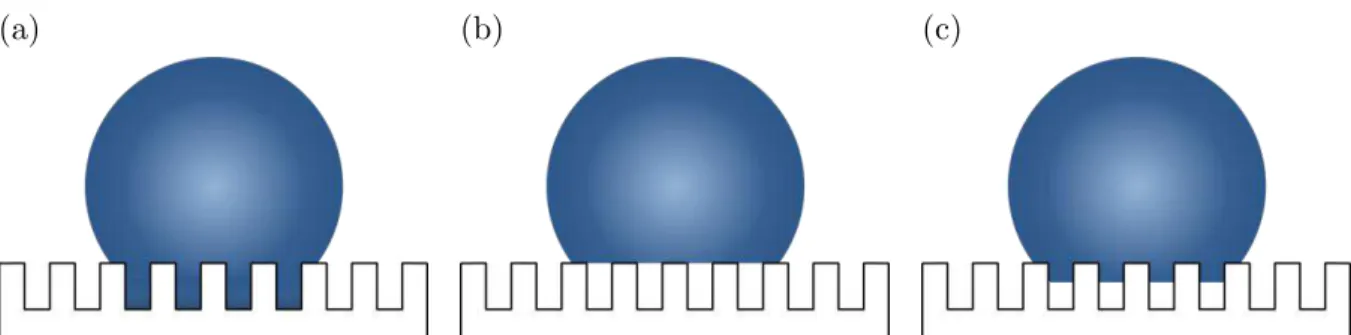
Figure 1.2.3 – Representation of the configurations described by (a) Wenzel equation, (b)
Cassie-Baxter equation w/out impregnation and (c) transition state with partial
impregnation. ... 4
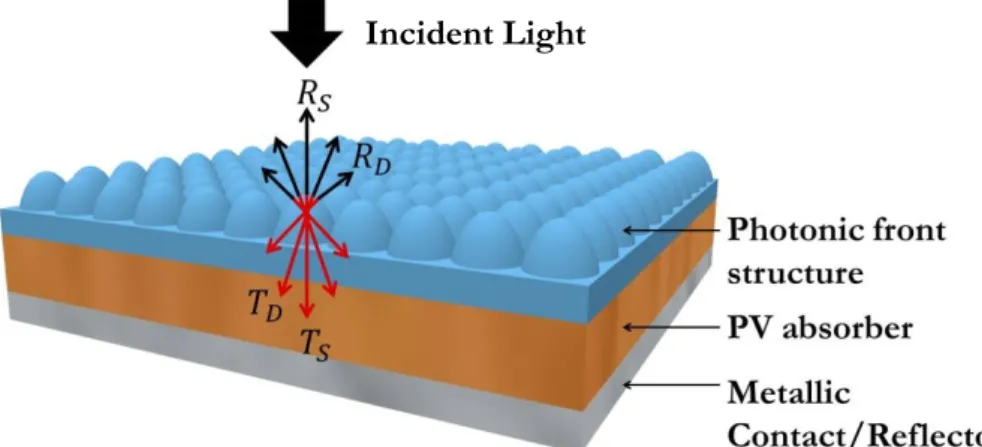
Figure 1.3.1 – Representation of front side photonic micro-domes with light scattering
properties. ... 5 Figure 2.3.1 – Langmuir-Blodgett deposition method. ... 8
Figure 2.3.2 – Colloidal lithography stages: (a) Deposition of colloidal mask (PS
nano/micro-spheres); (b) Substrate patterning by reactive ion etching and consequent mask etching; (c) Surface after sphere removal. ... 9 Figure 3.1.1 – Transmittance comparison between different materials. ( – solid lines and
– dashed lines) It is worth mentioning a step might be observed at 855nm, which is due
to the changing of the spectrophotometer I-V lamp to the UV-visible one. ... 11 Figure 3.1.2 – RIE of glass, revealing the low selectivity in comparison to the PS mask.
(a)5min, (b) 10min, (c) 15min, (d) 20min (100W, SF6– 16sccm, Ar – 4sccm, 20mTorr) ... 12
Figure 3.2.1 – SEM images of (a) 1.3 μm PS spheres and (b) 1.6 μm spheres assembly. ... 13
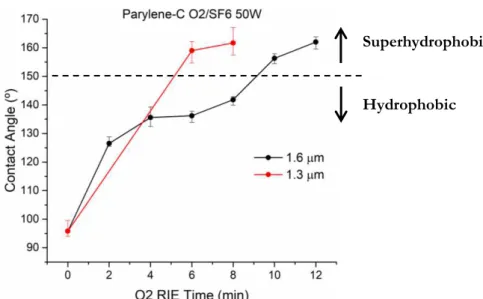
Figure 3.2.2 – Comparison between parylene static contact angles. The dashed line indicates
the threshold value for superhydrophobicity (150°) ... 13 Figure 3.2.3 – Parylene total (solid lines) and diffuse (dashed lines) transmittance/reflectance
spectra with different O2 plasma times using (a), (c) 1.3 μm masking PS spheres and (b), (d)
1.6 μm masking PS spheres. ... 14
Figure 3.3.1 – (Hitachi Tabletop) SEM images of RIE of PET masked by 1.6 μm PS spheres
(a) 20min (b) 30min (c) 40min (d) 50min (e) 60min (f) 70min (50W, SF6 – 10sccm) ... 15
Figure 3.3.2 – Top view (left) and 90° (digitally corrected) cross sectional view (right) SEM
images of etched PET (a), (b) 30min (c), (d) 50min (e), (f) 70min (50W, SF6 – 50sccm) .... 16
Figure 3.3.3 – (a) AFM 3D image of 70min etched PET with 1.6 μm PS spheres (50W, SF6–
50sccm) and (b) respective AFM cross section profile. ... 17 Figure 3.3.4 – Parylene O2/ plasma-treated surfaces without masking PS spheres. (a) 4 min (b)10 min ... 18
Figure 3.4.1 – X-ray photoelectron spectroscopy spectra of (a) untreated parylene, (b) 5min
O2 plasma-treated parylene and (c) 5min O2 and 1min SF6 plasma treatment... 20
Figure 3.5.1 – Static CA of PET surfaces treated with different plasmas, RF power and RIE
time with 1.6 μm PS spheres. ... 21
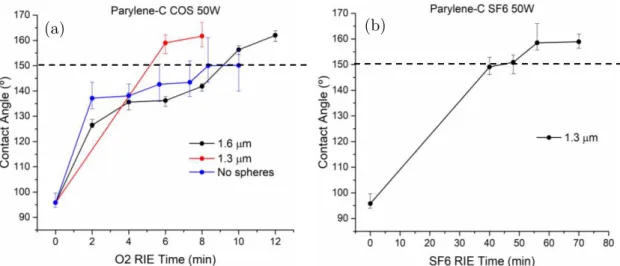
Figure 3.5.2 – CA obtained through (a) COS treatment without spheres and with different
sphere sizes and (b) SF6-based treatement. The dashed line indicates the superhydrophobic
Self-cleaned Solar Cells with Super-Hydrophobic Photonic Nano-structures xx
Figure 3.5.3 – (a) Static and dynamic contact angles of Parylene with different O2 plasma
treatment times and 1min SF6 using a 1.6 μm PS sphere mask and (b) respective droplets’
profiles. ... 22
Figure 3.6.1 – Graphical representation of parameters to be included in the models. In this
example, and . ... 24
Figure 3.6.2 – Contact angle gain (%) due to surface chemistry modification with different
RIE time. ... 25 Figure 3.7.1 – Total (solid lines) and diffuse (dashed lines) transmittance of (a) PET and (b) parylene. (SF6 50sccm, 50W) ... 26 Figure 3.7.2 – Total (solid lines) and diffuse (dashed lines) reflectance of (a) PET and (b) parylene with varying SF6 plasma treatment time. (SF6 50sccm, 50W) ... 26
Figure 3.7.3 – Haze in transmittance (equation 1.4) spectra of (a) PET and (b) parylene
surfaces with varying SF6 plasma treatment time. (SF6 50sccm, 50W) ... 27
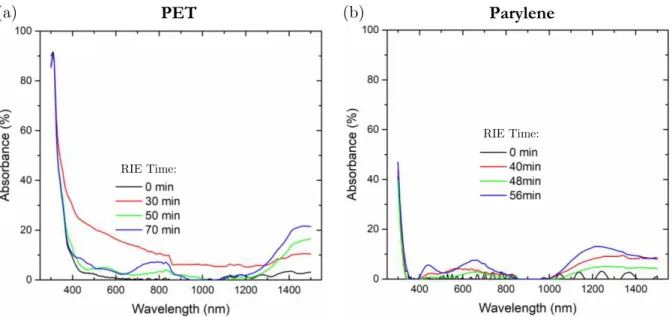
Figure 3.7.4 – Absorbance spectra of (a) PET and (b) parylene surfaces with varying SF6
plasma treatment time. (SF6 50sccm, 50W) ... 27
Figure 3.8.1 – Comparison between measured I-V curves of a solar cell without any coating
(reference), with a flat 5 μm parylene coating (smooth) and after structuring the parylene
(textured). The inset shows an amplified view of the I-V curves between 0V and 0.7V. ... 29
Figure 3.8.2 – and efficiency enhancement of textured parylene coated cells relative to
flat ones. ... 29
Figure 3.8.3 – Comparison between EQE measurements (Left) of a-Si n-i-p solar cells with
the same coating as those of Figure 3.8.1. (Right) ... 30 Figure 3.8.4 – enhancement of the studied batch of cells with a substrate (n-i-p)
configuration. ... 30
Figure A 1 – Decreasing efficiency of two solar panels tilted at 30° and 55° over 16 weeks, due to dust deposition in the Jazan Region and reposition of efficiency by surface cleaning. (reproduced from ref.[2]) ... 35
Figure A 2 – Spectral transmittance of light through glass with different sand dust amounts.
(reproduced from ref.[7]) ... 35
Figure A 3 – ACA and RCA on successively heat treated wax. (Reproduced from ref.[10]) .. 36
Figure A 4 - Nelumbo nucifera leaf http://plantinfo.co.za/plant/nelumbo-nucifera/(a) and respective SEM image [25] (b) Bar=20 μm ... 36 Figure A 5 – Rose petal (a) and respective SEM image [25] (b) ... 36
Figure B 1 - Calibration of the parylene deposition system. Relation between the dimer mass and the parylene film thickness (Reproduced from ref.[29]) ... 38 Figure B 2 – Parylene-C deposition stages. ... 38
Figure C 1 – SEM image illustrating the consistency of 1.6 μm PS film over a large area.
Self-cleaned Solar Cells with Super-Hydrophobic Photonic Nano-structures xxi
Figure C 2 - (a) AFM 3D image of 70min etched parylene-C with 1.6 μm PS spheres (50W,
O2/SF6 – 50sccm) and (b) respective AFM cross section profile. ... 41
Figure C 3 – Dyamic CA of parylene-C treated with SF6 plasma (50W, 50 sccm) masked
with 1.3 μm PS spheres. ... 42 Figure C 4 – (a) Total (solid lines) and diffuse (dashed lines) transmittance and (b) haze spectra of PET surfaces with varying RIE time. The surface was treated with 100W ... 43 Figure C 5 – (a) Total (solid lines) and diffuse (dashed lines) transmittance and (b) haze
spectra of PET surfaces with varying RIE time. The surface was treated with CF4 50sccm,
100W ... 43 Figure C 6 – Cells’ efficiency and loss by adding a parylene smooth layer. ... 44
Self-cleaned Solar Cells with Super-Hydrophobic Photonic Nano-structures xxiii
Motivation and Objectives
Accumulation of dust, airborne dirt, snow and other particles on the solar panel surface, causes solar cells to capture less sun-light and degrade faster (e.g. via hot-spot formation [1]), affecting the conversion of light into electricity. This might not look problematic if thinking about a single solar panel. However, when multiplied by the thousands or millions of solar panels in a solar installation, it becomes very costly, requiring periodical maintenance.
On the other hand, with increasing interest in thin-film photovoltaics, light trapping effects became extremely important. As the thickness of the absorbing layer is reduced to hundreds of nanometers, absorption of longer wavelengths (NIR) is compromised. A very efficient approach to resolve this problem is the introduction of light scattering. This effect increases the optical path length inside the absorbing layer, enabling the harnessing of radiation with longer wavelengths.
The main focus of this thesis is, therefore, the development of surfaces with self-cleaning properties which also possess light scattering capability. This will be accomplished by following a simple surface-patterning methodology based on colloidal lithography (CL), enabling low production costs since it does not require expensive specialized equipment as in conventional photolithography. The CL methodology comprises three fundamental stages. [2] The first is the deposition of a self-assembled hexagonal compact monolayer of polystyrene
(PS) microspheres on a given material’s surface through Langmuir-Blodgett method. The
second stage is the material’s patterning through reactive ion etching (RIE), using the PS monolayer as physical etching mask. The last stage is the sphere removal. This process results in the formation of a surface patterned with micro-cylinders/dome-like structures, which can lead to improved self-cleaning and light scattering properties.
Initially, the deposition of PS microspheres on various surfaces will be investigated and the
study of PS diameter will be conducted in order to optimize the spheres’ self-assembly. These self-assembled PS monolayers will then be used as physical masks during the reactive ion etching process. In this stage various parameters will be studied in order to enhance the hydrophobicity and light scattering capability of the surfaces. This will be accomplished by fine tuning the high aspect ratio cylinder/dome-like shaped structures obtained through colloidal lithography and by the chemistry modification of the surface, specifically introducing fluorinated functional groups.
Self-cleaned Solar Cells with Super-Hydrophobic Photonic Nano-structures 1
1
Introduction
1.1
Self-cleaning in solar cell technology
The power output generated by a photovoltaic (PV) solar cell is limited by the amount of irradiance that reaches it. A factor often disregarded when designing PV technology is soiling loss. [3] Due to accumulation of dust, airborne dirt (both organic and inorganic), snow and other particles on the panel surface, solar cells capture less sun light, hindering the conversion of light into electricity. This might not look problematic if thinking about a single solar panel. However, when multiplied by the thousands or millions of solar panels in a solar installation, it becomes very costly.
Studies have reported decreases in efficiency of different values throughout different
periods and locations. [4]–[8] One example is the reported 10.4% and 9.7% efficiency loss in
30° and 55° tilted solar panels, respectively, in the Jazan region over the course of 16 weeks (Figure A 1). [4] Ahmad Al-Hasan has investigated both experimentally and mathematically the optical losses caused by dust deposition on the solar panels, reducing the surface transmittance up to 50%, as shown in Figure A 2. [9] An available solution to this problem is manual cleaning that includes water spraying. This approach requires the use of large quantities of water, an especially scarce resource in arid regions. Besides being energy and time-consuming, it might cause cracks on the PV panel surface from inadequate brushing. [10]
Figure 1.1.1 – Example of solar panels cleaning system.
Self-cleaned Solar Cells with Super-Hydrophobic Photonic Nano-structures 2
1.2
Wettability
This field has been studied since the early 19th century by researchers such as Pierre Laplace (1749-1827) and Thomas Young (1773-1829). It has a wide range of applications, including in botany, glass industry and oil recovery. The core concept in wettability is surface tension. On the one hand, if we think of an atom inside of a liquid droplet, it is bonding with its surrounding atoms, finding itself in a “balanced” state. On the other, an atom located at the surface has less cohesive interactions, thus being in an “unbalanced” and
more energetic state (see Figure 1.2.1). This excess surface energy, or surface tension, γ, is
the energy that must be supplied to increase the surface area by one unit. In order to minimize the surface tension, liquids naturally adjust their shape, lowering their exposed surface area . [12, pp. 1–4]
Figure 1.2.1 – Representation of the interactions on bulk and surface atoms.
When a water droplet is deposited on a solid surface, equilibrium is reached. Three interfaces are to be acknowledged: a liquid interface, a liquid-air interface and a solid-air interface. The angle formed by the intersection of the solid-liquid and liquid-solid-air interfaces (three-phase contact line) is referred to as (static) contact angle (CA), , as represented in Figure 1.2.2a. A common way to characterize a surface wettability is through its CA. If a given surface has a CA higher than 90°, the surface is hydrophobic, meaning it has a low wettability. By contrast, if the surface has a CA lower than 90°, the surface is hydrophilic and has a high wettability. Surfaces with a CA greater than 150° are superhydrophobic. The CA of a droplet on an ideal (smooth and chemically homogenous) surface is described by Thomas Young’s relation [12, p. 216],
(1.1)
where , and are the surface energies of the solid-air, solid-liquid and liquid-air interfaces, respectively. Although from this equation it is expected that a single CA will be found for a given surface, in practice, the surface is neither perfectly smooth, nor homogenous. The droplet presents metastable states whose CAs usually do not correspond to the static CA described above, making this measurement unreliable. [13, p. 5,6] Before discussing how roughness and heterogeneity might influence wettability, it is important to
consider the concept of dynamic CA. For a more accurate evaluation of a surface’s
wettability, advancing and receding contact angles (ACA, , and RCA, , respectively)
Self-cleaned Solar Cells with Super-Hydrophobic Photonic Nano-structures 3
(a) (b) (c)
Figure 1.2.2 – Representation of (a) water droplet static CA on a hydrophilic surface and the surface energies of each interface, (b) CA on a hydrophobic surface and (c) dynamic CA w/ tilt method.
An experiment by Johnson and Dettre in 1964 [15] revealed that there is a connection between surface roughness and wettability. They measured the ACA and RCA of water droplets on wax surfaces applying heat treatments in between each measurement and successively decreasing the surface roughness. The results are presented in Figure A 3. It is evident that roughness has a direct impact on both contact angle and its CA hysteresis. One can easily distinguish two main regions. Whereas in the first region (of lower roughness) the measured CA is relatively low and the hysteresis is high, which reveals a highly adhesive behavior while still hydrophobic, in the second region (of higher roughness) the CA is extremely high and accompanied by a low hysteresis, assuming a superhydrophobic state. There is a correlation between these profoundly dissimilar behaviors and the two standard wetting models supporting this work. The first is the Wenzel model [16].It is based on the premise that the water droplet fills the full surface area, as represented in Figure 1.2.3a, in this way introducing a roughness factor, , that consists of the ratio of actual solid surface area to its flat projected area. The effective surface energies of the air and
solid-liquid interfaces become and , respectively. [17] It is still assumed in this model
that the local CA is admitted by Young’s relation [Eq. (1.1)], and the apparent angle, , is
given by Wenzel equation for a rough surface [16]:
(1.2)
In contrast with Wenzel’s model, the second model, [18] – Cassie-Baxter – assumes that
air is confined in spaces between the rough solid surface and liquid. It adds that there is no
impregnation in these confined “air pockets”, meaning the droplet is seated on a heterogeneous planar surface (Figure 1.2.3b). The fraction of solid-liquid contact interface can then be defined as . Likewise, the fraction of liquid-air contact interface can
be defined as . The CA is given by Cassie-Baxter equation [17]:
(1.3) If impregnation occurs, , i.e. the fraction of liquid-air contact interface, , equation 1.3 reduces to Wenzel’s equation. Despite the binary character of both Wenzel
and Cassie-Baxter models, there have been studies [17], [19]–[21] reporting the existence of a
transitional wetting state between Wenzel and Cassie-Baxter states, where the droplet partially impregnates the texture while still remaining a solid-air interface (Figure 1.2.3c). In this case the droplet is no longer supported by a planar surface, increasing the solid-liquid interface area. The liquid-air interface area is dependent on the surface geometry.
𝜃 9 ° 𝜃 9 °
𝐴𝐶𝐴
𝑅𝐶𝐴
𝛾𝑆𝑉 𝛾𝑆𝐿
Self-cleaned Solar Cells with Super-Hydrophobic Photonic Nano-structures 4
(a) (b) (c)
Figure 1.2.3 – Representation of the configurations described by (a) Wenzel equation, (b) Cassie-Baxter equation w/out impregnation and (c) transition state with partial impregnation.
Another way to tune the wettability of a given surface is by altering its surface chemistry. [12], [22]–[24].
Fluorine-based plasmas are a common solution for polymer’s surface hydrophobization.
This technique can have two effects – functionalization or polymerization. Their occurrence
is related to the F/C ratio. If F/C>3, there will be no polymerization; if F/C<2, there will be polymerization of fluorocarbons on the surface. Therefore, gases like CF4 and SF6 do not cause polymerization, unless CH4 is added, given that CH4 alters the F/C ratio. Fluorination with CF4 and SF6 is then based on functionalization, specifically with CF, CF2 and CF
functional groups. At low pressure, there is a strong dissociation of CF4 and SF6, enabling the formation of high density F atoms in the plasma. Although information about plasma interaction with parylene-C is limited, the literature states that, with PET, F atoms chemically interact with the surface, leading to partial substitution of the oxygen. This interaction process is nevertheless not yet fully understood. [24] Another approach towards
hydrophobicity is the application of a sequential plasma treatment – an O2 plasma
treatment. This treatment presents a higher etching rate and induces the incorporation of oxygen-containing functional groups into an oxygen-free polymer [25], turning it (super)hydrophilic, followed by a SF6 plasma that reverts the surface wettability to superhydrophobic. Reactive ion etching (RIE) is a particularly attractive approach because of its low processing temperature (ambient) and lower pressure, which promotes anisotropic etching/sputtering. RIE consists of a chemical and physical process which not only alters the surface chemistry but also realizes its texturing or patterning, depending on whether colloidal lithography is applied (This topic will be further addressed on section 1.3).
Since the discovery and study of the “Lotus” effect [26]–[28], a very interesting area is emerging within wettability studies, more specifically in the development of superhydrophobic surfaces through biomimetic approaches [17], [19] The leaves of the Nelumbo nucifera possess a hierarchical structure at both micro- and nano-scales (Figure A 4) which enables them to efficiently repel water and consequently any residue or contaminant on its surface. [27] This is a typical superhydrophobic behavior where there is high CA, low hysteresis (culminating in a low roll-off angle) and low adhesion. There has been a lot of recent discussion around the concept of superhydrophobicity because of the
Self-cleaned Solar Cells with Super-Hydrophobic Photonic Nano-structures 5
1.3
Photonic front structures
Wavelength-sized photonic structures have received tremendous interest in the context of film photovoltaics (PV). Due to limitations imposed by the physical dimensions of thin-film solar cells, several light trapping and anti-reflection schemes have been emerging that have an extremely close dependence on the photonic elements. One of the main contributions for thin-film photovoltaic efficiency is the enhancement of optical path length of near-infrared (NIR) light. [29] This enhancement can be achieved through the introduction of light scattering elements on the front side of solar cells (Figure 1.3.1). The fabrication of these structures can be performed through colloidal lithography which is the preferential soft-lithography technique compatible with PV industrial manufacturing.
Figure 1.3.1 – Representation of front side photonic micro-domes with light scattering properties.
When an unidirectional beam strikes a medium it is simultaneously transmitted and reflected (Figure 1.3.1). The transmitted beam separates itself into two components. The first conserves the incidence direction, called specular transmittance (TS) and the other
deflects into many directions, diffuse transmittance (TD). The sum of regular and diffuse
components results in total transmittance (TT . The same reasoning applies to reflectance,
which in turn generates RS (specular reflectance), RD (diffuse reflectance) and RT (total
reflectance). When the photonic structures are applied in the solar cell’s illuminated face, the light scattering enhancement is therefore obtained through the maximization of TD. The
factor that correlates TD with TT is called haze in transmittance, which is defined as:
(1.4)
Self-cleaned Solar Cells with Super-Hydrophobic Photonic Nano-structures 7
2
Materials and Methods
Several materials were investigated for surface patterning. Glass, PEN (Polyethylene
naphthalate - ) and PET (Polyethylene terephthalate - ) are eligible
for use in superstrate device configurations (e.g. conventional perovskite solar cells). PEN and PET may even be integrated in the fabrication of flexible solar cells. Due to the reduced thickness and the deposition properties of parylene-C ( ) (described in section 2.2), its main application is herein front encapsulation.
2.1
Substrate preparation
PET with indium-tin oxide (ITO) on one side and PEN substrates were cut to 5.0 7.0
cm in order to fit the Langmuir-Blodgett deposition well and cleaned with regular detergent. Then, in ultrasound vibration, were dipped in 2-propanol (IPA) and deionized water, sequentially.
Glass with 10.0 10.0 0.1 cm was cut into 5.0 7.0 cm and cleaned with regular detergent. Then, in ultrasound vibration, was sequentially dipped in acetone, followed by IPA and finally deionized water.
2.2
Parylene-C Deposition
Parylene was deposited through vacuum chemical vapor deposition (CVD), using a PDS
2010 Labcoter 2 (Specialty Coating Systems). The process consists of four stages – According
to the relation between dimer mass and parylene film thickness reported elsewhere [30] and shown in Figure B 1 (Appendix B), the appropriate amount of dimer is loaded into the vaporization chamber. Then the system creates vacuum and the dimer dichloro-di(p-xylylene) goes through the vaporization stage at 175 °C. The gaseous dimer enters the pyrolysis chamber, where at 690 °C it is pyrolyzed to form its monomer, chloro-p-xylylene, and finally polymerizes in the deposition chamber onto the glass substrate at room temperature (Figure B 2). The thickness of parylene was verified by profilometer. The glass/parylene substrate was cleaned again with detergent, IPA and deionized water sequentially.
2.3
Nano/micro-structures formation
Self-cleaned Solar Cells with Super-Hydrophobic Photonic Nano-structures 8
2.3.1
PS microspheres deposition
Langmuir Blodgett developed a methodology for the formation of monolayers (Langmuir monolayers), [31] resorting to a trough based on the design by Agnes Pockels (later called
the ‘Langmuir-Blodgett trough’). Through his methodology, it became possible to transfer a
single compact monolayer [32] from the water surface onto a given substrate by dip coating, as represented in Figure 2.3.1.
(a) (b)
Figure 2.3.1 – Langmuir-Blodgett deposition method.
It also became possible to easily create an organized hexagonal close-packed monolayer of colloids to be used as a precursor mask for posterior material patterning, enabling the fabrication of structures without the use of hard masks and equipment of conventional photolithography, hence lowering production costs. This simple, fast and scalable process consists of the aforementioned steps, which are depicted in Figure 2.3.2.
In the first step, the monolayer of PS microspheres is deposited on different substrate surfaces by applying a Langmuir-Blodgett self-assembly method [33] with a KSV NIMA Langmuir-Blodgett Medium Deposition Trough. Firstly, the trough and barriers are washed
– rubbing with detergent and cleaning with water, spraying with IPA and finally filling the
trough with deionized water and vacuumed. The system is turned on, two substrates are put, back to back, on the sample holder and the trough is carefully filled with deionized water. Once the surface tension stabilizes, its value is set to 0 and the system calibration is initiated. This stage consists in ensuring the surface tension difference between the system with opened and closed barriers is low (0.3-0.8 mN/m), meaning the water surface has low contaminants. The same process is applied with the substrates dipped. When the calibration is finished, 200 μL of dispersed PS microspheres purchased from Microparticles GmbH are diluted in 600 μL ethanol maintaining a 25 μg/mL concentration. With a syringe, the solution is slowly added to the water surface. With the KSV NIMA software, the surface tension threshold value is set to 18 mN/m and the system starts closing the barriers at 10mm/min until said value is met. At this point, the substrate is pulled up at 2mm/min and the deposition begins.
2.3.2
Reactive Ion Etching (RIE)
Self-cleaned Solar Cells with Super-Hydrophobic Photonic Nano-structures 9
Table 2.3.1 – Studied parameters during RIE processing.
Gas
Gas Flow (sccm) 10 30 50 100
Power (W) 50 100
Pressure (mTorr) 45
formation of dome/pillar-like structures of different size and shape. The processing gas affects the etching rate and surface chemistry as well as selectivity between PS and the substrate. However, for materials with the same polymeric nature as PS does, the selectivity is close to unity (1:1). [35] Importantly, as will be shown in the Results and Discussion section, the progressive lateral etching of the patterned structures (Figure 2.3.2b,c) is an expected effect derived from the etching of the PS spheres. The tested conditions/parameters are presented in Table 2.3.1. The patterned structures were observed resorting to the (Hitachi TM 3030Plus Tabletop) scanning electron microscope (SEM).
(a) (b) (c)
Figure 2.3.2 – Colloidal lithography stages: (a) Deposition of colloidal mask (PS nano/micro-spheres); (b) Substrate patterning by reactive ion etching and consequent mask etching; (c) Surface after sphere removal.
2.4
Contact Angle Measurements
To obtain the static and dynamic water contact angles (CAs) and characterize the surface wettability of glass, PEN, PET and parylene materials, it was used the DataPhysics OCA 15 Plus. The system is composed by a syringe placed vertically and an automatic dispenser. A digital image acquisition system records the droplet’s lateral profile. Throughout the study, 2
μL droplets of deionized water were used as reference. The static CA analysis is performed
with the embedded software (SCA 20) using the Laplace-Young approximation model with minimum 9 measurements per sample. The dynamic water CAs were measured by dragging the droplet with the needle, as described in section 1.2.
2.5
Optical Characterization
Measurements of transmittance and reflectance of the samples, both in total and diffuse mode were performed using a Perkin Elmer Lambda 950 spectrophotometer equipped with an integrating sphere. The spectra were acquired in the 300-1500 nm wavelength range.
2.6
Surface Characterization
Surface morphology analysis was performed by atomic force microscopy (AFM) (Asylum
MFP3D) in tapping mode using an Olympus AC160TS tip (K=26N/m; =300kHz),
Self-cleaned Solar Cells with Super-Hydrophobic Photonic Nano-structures 10 SEM (Hitachi TM 3030Plus Tabletop). Surface chemical composition was acquired via x-ray photoelectron spectroscopy (XPS) (Kratos Axis Supra).
2.7
Solar Cell Fabrication and Opto-electronical Characterization
Two batches of amorphous silicon (a-Si) solar cells, one with p-i-n (superstrate) and the other with n-i-p (substrate) configurations and an active area of 4.91 and 20.2 , respectively, were fabricated by plasma enhanced chemical vapor deposition (PECVD) in the
clean room environment of CEMOP – Center of Excellence in Microelectronics
Optoelectronics and Processes. The test cells were characterized without any coating, with a
Self-cleaned Solar Cells with Super-Hydrophobic Photonic Nano-structures 11
3
Results and Discussion
3.1
Screening of base materials
Four materials were chosen to be nano/micro-patterned in this study. They were regular glass, parylene-C, PEN and PET. Glass is the standard material for superstrate use in solar cells due to its excellent transparency, robustness and resistance to environmental degrading agents (such as UV light). PEN and PET are the standard polymeric materials throughout an extremely wide range of applications; they are very transparent, flexible and virtually unbreakable. Parylene has recently been used in microfabrication mainly as encapsulation layer and it presents excellent barrier properties; due to its deposition method, it can form micro- or even nano-layers perfectly conformable to the substrate, pin-hole free. [30]
In this section, the properties of these materials will be compared in order to evaluate their eligibility in this study. Specifically, focusing on transmittance properties, inherent contact angle (CA) and resistance to RIE processing (compatibility with colloidal lithography process).
For that, both total and diffuse transmittances were measured (Figure 3.1.1), as well as the static CAs of regular glass, parylene, PET and PEN. Table 3.1.1 presents the static CAs, and also the average total and diffuse transmittances, which were determined through the integration of the respective curves between 400 and 1400 nm. This interval was considered so the results can be widely used, instead of focusing on a particular solar cell technology (e.g. c-Si, a-Si, GaAs, etc.).
Figure 3.1.1 – Transmittance comparison between different materials. ( – solid lines and –
Self-cleaned Solar Cells with Super-Hydrophobic Photonic Nano-structures 12
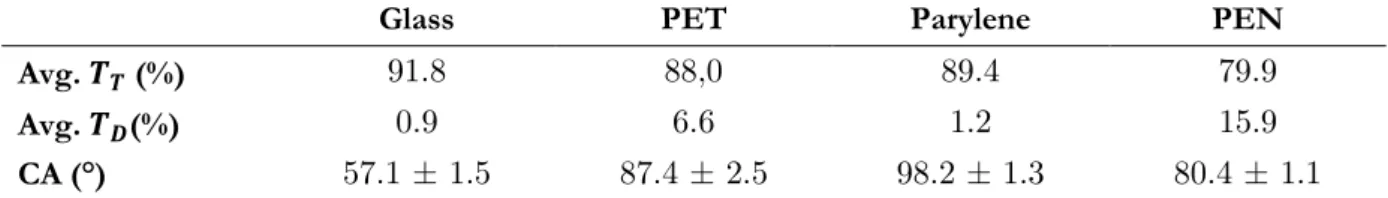
Table 3.1.1 – Contact angles and average transmittance of several untreated surfaces.
Glass PET Parylene PEN
Avg. (%) 91.8 88,0 89.4 79.9
Avg. (%) 0.9 6.6 1.2 15.9
CA (°) 57.1 ± 1.5 87.4 ± 2.5 98.2 ± 1.3 80.4 ± 1.1
The results show that the CA of glass is extremely low (57°) which is attributed to its high surface energy of 150mN/m, [12] while PEN’s contact angle (CA) is the lowest of the polymers. During the measurements of CA, it was found that PET has very strong adhesion
energy to water. When a water droplet was placed on PET it would not “slide”, even with
the help of the depositing needle. Moreover, PEN has an extremely poor optical performance with an average total transmittance of only 79.9% (while the other materials are close to or
above 90%). Although PET has a higher cut-off ultraviolet (UV) wavelength ( 500 nm)
than parylene and glass ( 400 nm), it revealed a very good transmission in the 700-1500nm
range.
Also, a dry etching selectivity preliminary test was conducted on glass due to its inherent chemical and physical robustness. Therefore, with the intent of studying the selectivity between glass and PS it was subjected to different plasmas (SF6, CF4, O2, Ar) and plasma combinations (SF6/Ar, CF4/Ar, O2/Ar) with a physical mask of 1.6 μm PS microspheres. It
was observed that, after the masking spheres were all etched out, the glass surface had been patterned as presented in Figure 3.1.2, but the aspect ratio of the produced features revealed very low. Thus, despite several RIE intents, it was concluded that glass has an extremely low selectivity to the aforementioned gas-based plasmas, relative to PS microspheres.
Figure 3.1.2 – RIE of glass, revealing the low selectivity in comparison to the PS mask. (a)5min, (b) 10min, (c) 15min, (d) 20min (100W, 6 – 16sccm, Ar – 4sccm, 20mTorr)
Self-cleaned Solar Cells with Super-Hydrophobic Photonic Nano-structures 13
3.2
Screening of Precursor Microspheres for Patterning
In this section, it is discussed the use of two different sizes of PS colloidal spheres – 1.3 μm
and 1.6 μm. They are compared with respect to quality of deposition (self-assembled
close-packed monolayer throughout large surface area) and to the wetting and optical properties of the subsequent patterned surfaces with RIE (the last two will be further addressed in section 3.7, therefore, only a comparative analysis will be herein preformed). In Figure 3.2.1 are represented SEM images of both sized microspheres deposited on parylene.
Figure 3.2.1 – EM images of (a) 1.3 μm P spheres and (b) 1.6 μm spheres assembly.
The deposited monolayers of 1.3 μm PS spheres (Figure 3.2.1a) were typically
characterized by the existence of hexagonal compact zones, although most of the surface is covered with a disordered microspheres monolayer. With 1.6 μm PS spheres the obtained films are very consistent (Figure 3.2.1b). Overall, most depositions present a good hexagonal compact monolayer over large areas (SEM observations revealed extremely ordered areas up to several millimeters) with some sporadic defects (e.g. absence spheres, polycrystalline-like domains). A broader SEM image is available in Figure C 1 (Appendix C). Due to the disorganized characteristic of the particle arrays formed with 1.3 μm PS spheres, the hydrophobicity of parylene surfaces patterned through RIE with these spheres is
theoretically lower than that of 1.6 μm sized spheres (Decrease of solid-liquid contact area).
However, the comparison shown in Figure 3.2.2 (static CA) suggests that there is little apparent difference. Both surfaces achieved extremely high static CA (161.7° with 1.3 μm and 162,0° with 1.6 μm PS spheres), revealing superhydrophobicity.
Figure 3.2.2 – Comparison between parylene static contact angles. The dashed line indicates the threshold value for superhydrophobicity (150°)
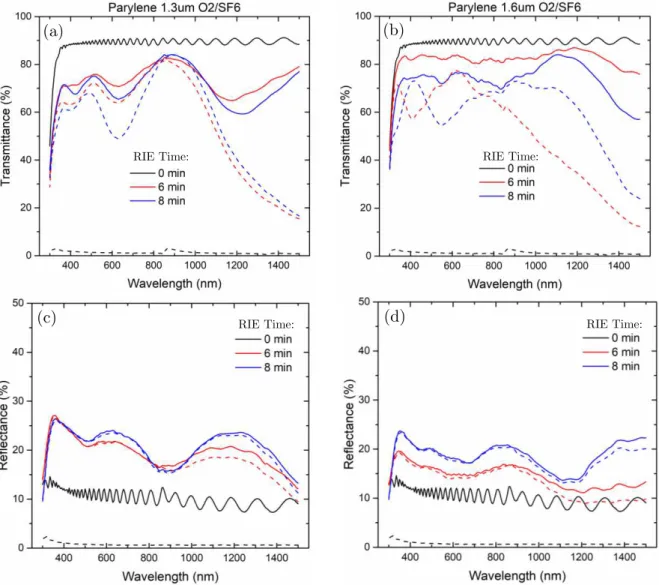
Self-cleaned Solar Cells with Super-Hydrophobic Photonic Nano-structures 14 The influence of PS sphere size on optical performance was herein studied through the comparison of total and diffuse transmittance and reflectance of parylene samples treated
with O2/SF6 plasma (Figure 3.2.3). The RIE times were fixed at 6 and 8 minutes. Similarly
to the procedure in section 3.1, by integrating the obtained spectra it was possible to determine the average values of total and diffuse transmittance, as well as total reflectance, which are presented in Table 3.2.1.
Figure 3.2.3 – Parylene total (solid lines) and diffuse (dashed lines) transmittance/reflectance spectra with different 2 plasma times using (a), (c) 1.3 μm masking P spheres and (b), (d) 1.6 μm masking PS spheres.
The peaks in the spectra of the patterned parylene with 6 and 8 minutes of RIE are the consequence of light interference effects caused by the optical behavior of the structures as a 2D honeycomb diffraction grating. Such periodicity effect is more pronounced in the spectra of the surfaces patterned with 1.3 μm PS spheres, since the dimension of these smaller spheres is closer to the observed wavelengths in the NIR. The difference in average transmittance and reflectance values is presented in Table 3.2.1. For the same RIE time,
surfaces patterned with 1.3 μm PS spheres have lower TT and higher RT than surfaces
patterned with 1.6 μm spheres. Due to the higher reliability in the deposition process and the
better optical properties of 1.6 μm patterned surfaces, the 1.6 μm PS spheres were considered
RIE Time: RIE Time:
RIE Time: RIE Time:
(a) (b)
Self-cleaned Solar Cells with Super-Hydrophobic Photonic Nano-structures 15 the preferential ones for masking purposes in this study, and therefore were the colloids used in the subsequent work.
Table 3.2.1 – Average total and diffuse transmittance and average reflectance of 6 and 8 minute
2/ 6 plasma-treated parylene surfaces with 1.3 μm and 1.6 μm masking P spheres.
Avg. Total Trans. (%) Avg. Diff. Trans. (%) Avg. Total Refl. (%)
6 min
1.3 μm 1.6 μm 73.6 83.0 59.1 52.7 20.9 15.88 min
1.3 μm 1.6 μm 70.9 75.4 58.2 62.9 22.3 19.53.3
Surface Topography Development
3.3.1
Analysis of microspheres’ shaping through RIE
Both PET and parylene surfaces were micro-patterned with the CL method of Figure 2.3.2. To study the structuring via RIE, the etching evolution of the spheres was observed and characterized through SEM, as presented in Figure 3.3.1. It is worth mentioning on (a) and (b) the dispersion of PS is due to charging effects in the SEM image acquisition.
Figure 3.3.1 – (Hitachi Tabletop) EM images of RIE of PET masked by 1.6 μm P spheres (a) 20min (b) 30min (c) 40min (d) 50min (e) 60min (f) 70min (50W, 6 – 10sccm)
Initially, it is noticeable that, as the process is extremely anisotropic, the PS spheres take an oval shape (etching mainly along the vertical axis, i.e. the plasma incidence direction), practically without decreasing the diameter, allowing the patterned substrate to retain the initial masking diameter (Figure 3.3.1a). Then, after 30 minutes the spheres start thinning
(i.e. masked area decreases). From this point on, the spheres’ diameter will become
Self-cleaned Solar Cells with Super-Hydrophobic Photonic Nano-structures 16 were completely etched. From this process, the PS spheres vertical etching rate was
determined as 1.6μm/70minutes resulting in 23nm/minute. The various PS etching rates are disclosed in Table 3.3.1.
Table 3.3.1 – PS etching rate (approximate values)
F F
50W 100W 50W 100W 50W 100W
3.3.2
Analysis of surface patterning
The contribution of plasma treatment on both PET and parylene surface roughness was studied through SEM and AFM analysis. Top and cross sectional views of the surface with increasing RIE time are presented in Figure 3.3.2 (and Figure C 7).
Figure 3.3.2 – Top view (left) and 90° (digitally corrected) cross sectional view (right) SEM images of etched PET (a), (b) 30min (c), (d) 50min (e), (f) 70min (50W, 6 – 50sccm)
The surface etching initiates with the preservation of the original diameter of the masking PS spheres, resulting in the formation of cylinders in the material underneath the spheres (Figure 3.3.2b). Then, as the spheres’ diameter starts decreasing, the cylinders’ diameter follows that decrease, due to the extremely high anisotropy (directionality) of this treatment (Figure 3.3.2d). When the masking spheres reach a certain (low) diameter, it starts
Self-cleaned Solar Cells with Super-Hydrophobic Photonic Nano-structures 17 3.3.2f. Also, the formation of nano-roughness in the spaces between the cylinders was observed and analyzed in section 3.3.3. The cross sectional images were obtained by digitally adding a 20° correction factor to a 70° image in order to correctly measure the dimensions of the observed structures. These dimensions and the approximate etching rate are specified in Table 3.3.2. The patterned structures on parylene presented a slightly lower aspect ratio due to the, also slightly lower selectivity, relative to PS spheres.
Table 3.3.2 - Average diameter and height, with corresponding standard deviation, of the surfaces presented in Figure 3.3.2, as well as estimated etch rate by SEM.
30min 50min 70min
Average Diameter (μm) 1.28 ± 0.05 1.14 ± 0.04 0.92 ± 0.06
Average Height (μm) 0.92 ± 0.06 1.46 ± 0.07 2.15 ± 0.14
Etch Rate (nm/min) 30.2
AFM 3D images and cross sectional profiles were acquired in order to compare with SEM results (Figure 3.3.3 and Figure C 2). It is worth noting that, because of the high aspect ratio of the surface structures, the AFM tip could not sense the base of the sample, which introduces a measurement error. As observed in, both SEM and AFM data, the produced structures are extremely rough which can be beneficial for hydrophobicity purposes, yet can be disadvantageous on the surfaces’ optical properties, which will be discussed in section 3.7.
(a) (b)
Figure 3.3.3 – (a) AFM 3D image of 70min etched PET with 1.6 μm P spheres (50W, 6 –
50sccm) and (b) respective AFM cross section profile.
In Table 3.3.3 are the average diameter and average height of the above surface. It is clear that, comparing with the results obtained through SEM analysis (Table 3.3.2), the measurements have a positive error in diameter due to geometrical convolution effects, and a negative error in height because the tip could not reach the base of the sample.
Table 3.3.3 – Average diameter and height and respective standard deviation of the surface presented in Figure 3.3.3 by AFM.
70min
Self-cleaned Solar Cells with Super-Hydrophobic Photonic Nano-structures 18
3.3.3
Analysis of RIE-induced nano-roughness
As mentioned in the previous section, a nano-roughness has been patterned in the regions between the etched pillars, resulting from the direct exposure of the surface to the incident plasma. To study the effect of such nano-roughness alone (i.e. without the micro-pillars), the analysis of control samples was performed, which underwent RIE without the use of CL, in order to more accurately characterize the surface’s topology and also to evaluate the
wettability of the RIE-induced nano-roughness reported earlier in section 3.3.2. The entire process was repeated without masking spheres and observed through SEM and AFM. The acquired images are presented in Figure 3.3.4.
Figure 3.3.4 – Parylene 2/ treated surfaces without masking PS spheres. (a) 4 min (b) 10 min.
The plasma treatment generated “nano hair” which was poorly detected through AFM technique due to the extremely disordered and rough character of the samples. Nonetheless, with increasing RIE time, it was observed an increase in length and density of nano hair. With 4 minutes of O2/SF6 plasma the maximum nano hair length was 0.32 μm. When
treated for 10 minutes, the maximum height increased to 0.76 μm. It is worth noting that these surfaces also presented superhydrophobicity. However, they have a rather strong pinning effect (droplet movement prevented by local defect that pins the droplet), possibly due to the randomness of the plasma process which would allow the occurrence of localized water impregnation.
3.4
Surface Chemistry Analysis
Wettability modification is not only a consequence of nano/micro-structuring, as provided by the structures fabricated via the previously described methods, but can also be strongly affected by surface chemical modification by the introduction of functional groups.
The analysis of surface chemistry was performed through x-ray photoelectron spectroscopy (XPS). The study was applied to three samples of parylene. The first was untreated, the second was submitted to 5 minutes of O2-based plasma treatment and the third was also
treated with 5 minutes of O2-based plasma treatment and an additional minute of SF6-based
Self-cleaned Solar Cells with Super-Hydrophobic Photonic Nano-structures 19 The survey spectra and corresponding fitted high-resolution carbon 1s (C1s) spectra of parylene surfaces are presented in Figure 3.4.1. Compared to the untreated parylene surface,
a significant increase in oxygen was observed on the O2 plasma-treated sample and, with less
intensity, on the O2/SF6 plasma-treated surface. Moreover, it was detected a heavy increase
in the fluorine atomic concentration on the O2/SF6 plasma-treated surface. On the O2
plasma-treated sample, a small amount of fluorine was detected, which can be attributed to a contamination in the RIE chamber. These modifications suggest that new functional groups were formed through the reaction between plasma-surface. The quantification of surface atomic concentration of the untreated, O2 plasma-treated and O2/SF6
plasma-treated samples is presented in Table 3.4.1.
Table 3.4.1 – Quantification of surface atomic concentration
Untreated Plasma / F Plasma
O 1s 1.70 28.26 5.23
F 1s 0.11 5.26 43.17
Cl 1s 8.40 3.42 3.30
C 1s 89.80 63.05 48.30
The presence of O and F on the untreated parylene is attributed to contamination from air (transportation from clean room to XPS) and gloves, respectively. On the O2 plasma-treated sample, as expected, oxygen functional groups were introduced to the surface [24] and a contamination of F was detected, which can be related to contamination from RIE
chamber. On the O2/SF6 plasma-treated parylene surface it is observed the almost complete
substitution of oxygen by fluorine functional groups. [24] The deconvoluted peaks’ binding
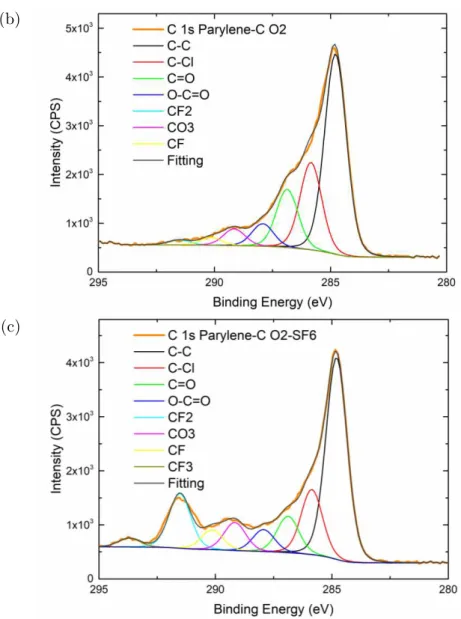
energies and full width at half maximum (FWHM) are presented in Table C 1. The deconvoluted C1s spectrum of the untreated parylene verified the presence of C-C and C-Cl at 284.8 eV and 285.9 eV, respectively. With that as a reference, the C1s spectrum of the
O2-treated parylene indicated the formation of new peaks at 286.9 eV (C=O), 287.9 eV
(O-C=O), 289.2 eV (CF), 290.1 eV (CF2) and 291.5 (CO3). [22], [24] It is worth noting that the
presence of fluorinated groups was very weak. The C1s spectrum of the O2/SF6 plasma-treated parylene revealed the presence of CF and CF2 previously detected peaks, though
with much more intensity, and detected a new peak at 293.7 eV (CF3). [22], [24]
Self-cleaned Solar Cells with Super-Hydrophobic Photonic Nano-structures 20 (b)
(c)
Figure 3.4.1 – X-ray photoelectron spectroscopy spectra of (a) untreated parylene, (b) 5min 2 plasma-treated parylene and (c) 5min 2 and 1min 6 plasma treatment.
The chemical inertness of the fluorinated groups, therefore, contributes to the lowering of
the surface energy, which in turn enhances the surface’s hydrophobicity. The O2 plasma
pre-treatment provided the reactivation of the inert parylene surface, enabling the subsequent substitution of oxygen by SF6. [22], [24] The results presented in this section will have a
rather significant role in the wetting properties analyzed in section 3.5.
3.5
Contact Angle Measurements
3.5.1
Static Water CA
To understand the influence of the etching gas, radio frequency (RF) power and gas flow during RIE on CA, each parameter was varied, maintaining a constant pressure. This thorough analysis was performed on PET, in order to obtain the preferential RIE treatment conditions to maximize the CA. Then, this optimized RIE treatment was applied in parylene. Also, following up on previous work, [22] a 2-step RIE treatment was tested as
described below. The obtained static CAs for PET surfaces masked with 1.6 μm PS spheres
Self-cleaned Solar Cells with Super-Hydrophobic Photonic Nano-structures 21
Figure 3.5.1 – Static CA of PET surfaces treated with different plasmas, RF power and RIE time
with 1.6 μm P spheres.
There are two parameters influencing PET’s surface hydrophobicity. The first is surface
roughness. It is clear that (as addressed in section 3.3) increasing the RIE time results in the increasing of the micro pillars height, which in turn has an effect on the measured CA. The second parameter is the surface chemistry modification (observed via XPS for parylene in
section 3.4). The analysis of Figure 3.5.1 suggests that SF6-based plasma produces a slightly
more hydrophobic effect than CF4-based plasma, which is also reported on [24]. It is observed that higher gas flow enables higher hydrophobicity. This fact may be due to the
higher concentration of fluorinated groups interacting with PET’s surface. The increase of
RF power, from 50W to 100W, with SF6 plasma caused a decrease of CA. This could be
related to surface geometric properties (higher anisotropy), rather than chemistry properties.
However, with CF4 plasma the influence of higher RF power appears to be minor.
Surfaces treated with O2-based plasma revealed extremely high hydrophilicity, causing the
complete surface wetting, precluding the CA measurement. A previous study [22] introduced
a 2-step plasma treatment comprehending the application of RIE with O2 followed by RIE
with SF6, called “consecutive-O2-SF6” (COS) plasma treatment. In this study, the O2-based
RIE time was varied from 20s to 10 min. Then, 1 min of SF6-based RIE would be performed.
A maximum CA of 9° was reported. It is, therefore, herein applied the same treatment
sequence, with slight variation of RIE parameters. The measured CAs of parylene with increasing O2 plasma time and the CAs of the optimized SF6-based RIE treatment are presented in Figure 3.5.2.
CF4 flow rate:
F6 flow rate:
Self-cleaned Solar Cells with Super-Hydrophobic Photonic Nano-structures 22
Figure 3.5.2 – CA obtained through (a) COS treatment without spheres and with different sphere sizes and (b) 6-based treatement. The dashed line indicates the superhydrophobic threshold of 150°.
The CA registered through the optimized SF6 plasma treatment of parylene (158.9°) is much higher than that of PET (139.7°). With the COS treatment, it was possible to reduce the etching time to 8 and 12 minutes for surfaces patterned with 1.3 μm and 1.6 μm PS
sphere masks, respectively, obtaining CAs of 161.7° and 162.0°. The “maskless“ samples presented high CA, however as depicted by the error bars, this treatment provided low homogeneity throughout the surface. Moreover, a pronounced pinning effect was observed, as stated in section 3.3.
Though static CA provides a general idea of surfaces’ wettability, as previously discussed
in section 1.2, it is not reliable for accurate characterization of non-ideal surfaces’ wetting
properties. To correctly and more precisely determine whether a surface is hydrophobic, superhydrophobic or adhesive, dynamic CA measurements have to be performed. The dynamic CA of O2/SF6 plasma-treated parylene surface is presented in Figure 3.5.3.
3.5.2
Dynamic Water CA
(a) Wenzel CB (b) Dynamic Static
2 min:
4 min:
6 min:
8 min:
10 min:
12 min:
Figure 3.5.3 – (a) Static and dynamic contact angles of Parylene with different 2 plasma treatment times and 1min 6 using a 1.6 μm P sphere mask and (b) respective droplets’ profiles.