A Work Project, presented as part of the requirements for the Award of a Master Degree in Economics from the NOVA – School of Business and Economics.
ASSESSING THE IMPACT OF PUBLIC DEBT ON ECONOMIC GROWTH: AN ANALYSIS ON PORTUGAL
JOSÉ MIGUEL RIBEIRO SOARES* | 804
A Project carried out on the Master in Economics Program, under the supervision of: Professor Paulo M. M. Rodrigues
January 2017
* This work benefited from several comments and suggestions, specially from Professor Paulo Rodrigues, to whom I am truly grateful. I also want to express my sincerest gratitude to my parents, my brother and closest friends, particularly Daniela, for all their limitless support and encouragement throughout this journey.
2
ASSESSING THE IMPACT OF PUBLIC DEBT ON ECONOMIC GROWTH: AN ANALYSIS ON PORTUGAL
Abstract
In the current economic framework, characterized by a global increase in the public debt burden and weak performances concerning economic growth, it is imperative to study and to understand the hypothetical impact of public debt on economic growth. Although there already exist several studies in this field, this research aspires to provide information regarding this phenomenon in Portugal. A Markov switching model is estimated, using quarterly data spanning the period from 2000 to 2015, in order to assess the impact of public debt on economic growth when the economy is either in an expansionary or contractionary environment. The result extracted from this empirical analysis suggests that public debt harmed economic growth in Portugal during recessions, having no impact during economic expansions.
3
1 - Introduction
The existence of extreme burdens associated with the stocks of public debt is seen as a priority concern on the public agenda, given the direct or indirect impact that it exercises on a country’s wealth. The efficient management of such stocks is one of the commitments required to policy makers, although it is not always achieved in modern societies.
The beginning of the twenty-first century coincided with further steps towards the European integration, namely regarding the Economic and Monetary Union (EMU). The desire to coordinate fiscal policies, as well as to adopt a common monetary policy and a common currency (the Euro) was an important step towards a cohesive Europe. However, it also implied the appearance of some negative effects on several countries: the decrease in the risk perception associated with each member state which adopted the common currency led to a generalized decline in the interest rate that each country had to pay in order to finance itself in international credit markets. Thus, given the lower costs associated with the funding procedures, several countries experienced a significant increase in their debt-to-GDP ratio.
The global financial system has undergone a deep modification process since the turn of the century, mainly through deregulation and the introduction of more complex products in the market. These changes precipitated the financial crisis of 2007, which had its epicenter in the United States of America and quickly spread to the rest of the world. This incident forced a rethinking of the risk associated to each member state, which resulted in a continuous increase in the interest rate that each country would face in order to get funding, particularly the most vulnerable countries, such as Portugal, Spain and Greece. While the financial crisis hit the entire world, Europe was hit particularly. This considerable increase in interest rates, coupled with a significant increase in the debt-to-GDP ratios that occurred in the previous years, triggered the "European Sovereign Debt Crisis". This episode is characterized by the inability of several
4
European countries to pay or rollover their public debt due to the rapidly rising yields and low performances regarding economic growth.
The increase in the debt-to-GDP ratio may imply different consequences in the short and long run concerning economic growth, so it is not possible to draw immediate conclusions from the path of this indicator. Nevertheless, this phenomenon requires a further study, in order to quantify such impact, as well as to ascertain to which extent it changes according to periods of economic expansion or recession. This study is focused on Portugal, so the main research question is “What was the impact of public debt on the Portuguese economic growth over the last 15 years?” Achieving a reliable answer to this question may have an important impact not only for this work project but also regarding the adoption of economic policies that allow to reverse the trend observed in recent years, when the public debt ratio experimented a significant increase.
The dissertation is organized as follows: section 2 presents the literature review, where existing studies regarding this topic are discussed; in section 3, a brief description of the indicators/data used in this research is provided; section 4 discusses in detail the methodology used in this process; in section 5, the estimation results are introduced; comparisons with results achieved by other countries are performed in section 6; finally, the main conclusions and drawbacks, as well as further research hypotheses are presented in section 7.
5
2 - Literature Review
The relationship between public indebtedness and economic growth has been deeply studied among academics and debated by policy makers over the years. This discussion returned to the center of debate due to the deterioration of public accounts observed in recent years. It is of utmost importance to realize that public debt can influence economic growth through several economic channels, so it is always arguable to establish a specific relationship between the two variables.
On the one hand, David Ricardo’s study on the different ways to finance government spending, either through taxes or public debt, was one of the first contributions on this topic. The Ricardian equivalence states that rational consumers acknowledge that financing budget deficits through public debt would imply higher taxes in the future, whose present value is equal to the amount of debt incurred in the present. Therefore, they choose to increase their savings, in order to pay taxes in the future, offsetting the decline in public savings (Ricardo, 1817). Thus, according to this classical framework, the decrease in public savings is outweighed by the increase in private savings, so national savings do not change, keeping investment constant and hence GDP. Following the assumption of consumer’s rationality, Robert Barro also concluded that there is no justification to assume that public debt can be considered net wealth (Barro, 1974).
On the other hand, according to Keynesian theory, changes in aggregate demand, whether anticipated or not, have a short-run impact on real output. Thus, an expansionary fiscal policy which causes the increase of public expenditure financed through public debt, would have an impact in the short-run, given the stickiness of price adjustments (Keynes, 1936). Nevertheless, the abundant use of finance to sustain high public expenditures could imply an increase in the interest rate, reducing the attractiveness of private investment. Therefore, the expected
6
crowding-out effect implies that this mechanism becomes partially or totally ineffective in the long-run.
Following the neoclassical thought, Franco Modigliani argued that public debt has two major impacts: on the one hand, it causes a transfer of resources from future to current generations; on the other, it causes a burden to society as a whole, as the decline in national savings induces a permanent reduction in the stock of capital (Modigliani, 1961).
A growing body of empirical work has been developed, mainly focusing on the relationship between the two variables under analysis: public debt and economic growth. Firstly, it is important to understand what can be classified as excessive debt. In this sense, Paul Krugman, Nobel Prize in Economic Sciences in the year of 2008, defined "debt overhang" as a situation where a country faces such high liabilities that investors no longer expect to be totally repaid. Even without expecting to be fully reimbursed, this phenomenon may provide an incentive for the investors to continue to lend money to these countries, in order to protect the existing credits and to avoid a country’s bankruptcy (Krugman, 1988). This action would allow countries in these circumstances to continue to boost their economies, seeking to achieve economic growth that enables them to meet their commitments. The impact of these economic interventions was studied by Devarajan et al. (1996), who divided public expenditures into two categories according to productivity purposes: “productive” or “unproductive” expenditure. The first category includes expenditures that are growth enhancing, meaning that they may increase GDP’s growth rate. Some examples are expenditures on physical infrastructures, information systems and education. The second category includes expenditures that are purely consumptive, meaning that they will not affect the economy’s long-run performance. According to these authors, assuming that all expenditures are financed through debt, it is the category of each expenditure that determines the impact of debt on economic growth: a long-run positive effect on economic growth might be expected if the expenditure is allocated to productive purposes
7
while a negative long-run effect on economic growth should be expected in other circumstances (Devarajan, Swaroop, & Zou, 1996).
With the same focus of analysis, Robert Barro had already identified two opposite effects of government’ size on economic growth. An increase in government expenditures financed through public debt crowds out private investment, as previously explained. However, it could lead to capital productivity gains, provided that those expenditures correspond to productive investments. Given these effects, the author points out that public debt accumulation may contribute positively to economic growth until a certain threshold, above which it will generate a negative long-run impact (Barro, 1990).
The existence of such threshold would imply the existence of a non-linear effect of public debt on economic growth. “Growth in a Time of Debt”, by Carmen Reinhart and Kenneth Rogoff, was an outstanding contribution to this literature. In this study, the authors examined the impact of public debt on economic growth, detecting the existence of a nonlinear relationship: showing that on the one hand, this impact is negligible when the debt-to-GDP ratio is below 90%; and on the other, that when the ratio is higher than this threshold, the growth rate of GDP turned to be negative (Reinhart & Rogoff, 2010). The results presented by Cecchetti et al. (2011) supported the same view that public debt represents an obstacle to economic growth beyond a certain threshold: 85% of GDP according to this point of view. Therefore, the authors recommend that countries with ratios above this frontier should act quickly and firmly in order to correct their budgetary issues (Cecchetti, Mohanty, & Zampolli, 2011). These findings supported the implementation of austerity policies in Europe, which aimed to rebalance public accounts in order to avoid future economic recessions.
Herndon, Ash and Pollin (2013) strongly challenged the conclusions of the study undertaken by Reinhart and Rogoff (2010), by detecting several errors in the data selection process, as well as in the weighting of summary statistics and coding process. According to them, the impact of
8
public debt on economic growth in countries with a debt-to-GDP ratio above 90% is not "dramatically different" from the impact in the case of countries whose ratio is below this threshold. Moreover, they also showed that the relationship between public debt and economic growth varies significantly by time period and by country. The authors concluded with the suggestion of the reversal of austerity policies adopted in Europe (Herndon, Ash, & Pollin, 2013). Reinhart and Rogoff’s study was also criticized by Paul Krugman, in the opinion article "Reinhart And Rogoff Are Confusing Me", where he questioned the causal interpretation of the correlation between debt and economic growth. In his view, the conclusions extracted by the authors were based on events where the causal relationship from debt to economic growth might not exist, hence could not be trusted. (Krugman, 2010).
Panizza and Presbitero (2012) studied the same phenomenon, verifying that the causal relationship between public debt and economic growth disappears as soon as an instrumental variable which captures the value of public debt is introduced.
The evolution of the debt-to-GDP ratio may be driven by changes in the stock of public debt or changes in the GDP, meaning that an increase of such an indicator may be due to different sources. Assuming that output displays a growth trend as advocated by endogenous growth models, in which the work of Romer was a breakthrough (Romer, 1986), the increase in the ratio is the result of considerable increases in the stock of public debt, systematically used to finance consecutive budget deficits. Kumar and Woo (2010) explored the impact of high public debt on economic growth in the long run, reaching a negative relationship between the initial stock of public debt and the subsequent economic growth. Furthermore, the results signaled the existence of nonlinearity, thus meaning that initial higher stocks of public debt are associated with stronger negative impacts on economic growth. This adverse effect results from the decrease in the growth rate of labor productivity, due to the reduction of investment and to the decrease in the capital stock’ growth. As it is also possible to conclude from the research of
9
Elmendorf and Mankiw (1998), although budget deficits contribute to boost short-run economic growth, they are likely to harm long-run growth if constantly financed by debt, given the linked phenomenon of crowding-out.
Kourtellos, Stengos and Tan (2013) analyzed the impact of public debt on economic growth, considering different regimes, determined by the evolution of several plausible instrumental variables. These authors applied a structural threshold regression methodology to investigate such heterogeneous effects and detected serious evidence of heterogeneity in the variable "democracy". It means that a higher debt-to-GDP ratio causes lower economic growth in Low-Democracy countries while, in High-Low-Democracy countries, the impact of public debt is not significant.
Finally, Checherita and Rother (2010) distinguished themselves from the aforementioned authors by investigating the impact of public debt on the growth of GDP per capita. In spite of using a per capita indicator to measure economic growth, they also acknowledged the existence of nonlinearities, wherein the threshold beyond which debt has an adverse effect on economic growth is located between 90% and 100% of GDP. Moreover, they found that the annual change in the debt-to-GDP ratio is linearly and negatively associated with the growth of GDP per capita.
Despite this extensive literature, there is not a clear distinction between the impact of public debt on the economic growth in a recessive environment and that impact when the economy is thriving. Therefore, this study pretends to differentiate from others by separating the analysis according to two different regimes: both a scenario of economic expansion and a scenario of economic recession. Given this constraint, the main purpose of this study is to verify if the impact of public debt on economic growth is significant or not.
10
3 - Data Description
The aim of this section is to analyze the variables and data used in this dissertation. It is noteworthy that the analysis is restricted to the period between 2000 and 2015, due to the availability and reliability of data on the two economic indicators used. Moreover, quarterly data is used, totaling 64 observations. As the study is focused on Portugal, a more detailed analysis on Portuguese indicators is performed. However, 6 othercountries (France, Germany, Italy, Spain, the United Kingdom and the United States) are also considered, allowing the author to establish comparisons with the results achieved for Portugal.
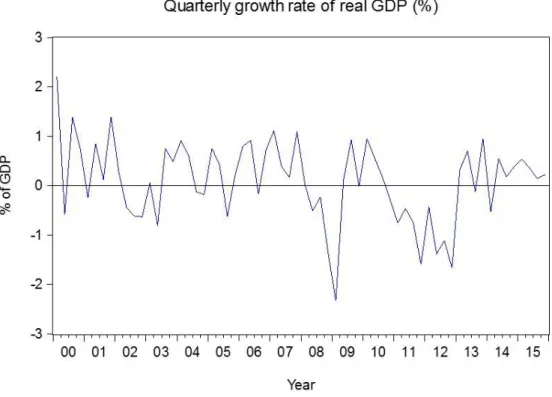
The main focus of this study is the phenomenon of economic growth, which is measured by the quarterly growth rate of the real gross domestic product (GDP). In the period under review, Portugal experienced positive growth rates of GDP in 38 quarters, opposing to 26 quarters of negative growth rates of the same indicator, as depicted in Figure 1. The negative growth rates are essentially distributed over three periods of time: between 2002 and 2003; between 2008
11
and 2009, when GDP has fallen for 6 consecutive quarters; between 2010 and 2012, when GDP has fallen for 8 consecutive quarters. The highest GDP growth rate is 2.2% and it was achieved in the first quarter of 2000, while the lowest GDP growth rate is -2.3%, which was recorded in the first quarter of 2009.
The other countries present a very similar path of the quarterly growth rate of GDP among them, but remarkably different from the one presented by the Portuguese economy. Firstly, the predominance of positive economic growth quarters is noticeable. Nevertheless, it should be noted that all those countries experimented at least 4 quarters of negative economic growth between 2008 and 2009, when the global financial crisis was sparked. Moreover, it is important to highlight the period of the European sovereign debt crisis, when Spain recorded 10 consecutive quarters of negative economic growth rates, while Italy recorded 13 quarters of recession out of 16 possible ones between 2011 and 2014. For the sake of comparison, these two periods coincided with recessions in Portugal, as explained above. The data on quarterly real GDP was extracted from the OECD quarterly national accounts database. Aiming to obtain the growth rates used in this analysis, the first differences of the natural logarithms of the real GDP values were calculated.
The proposed study looks to investigate the importance of public debt as an explanatory variable for the phenomenon of economic growth. This stock is defined as the government gross debt outstanding at the end of the quarter, valued at nominal values, and it includes the following categories of government liabilities: currency and deposits, debt securities and loans. The mentioned indicator covers the subsectors of central government, local government and social security funds. In addition, it is measured in relative terms, expressing public debt as a percentage of GDP, in order to allow comparisons between countries. Figure 2 reveals that the Portuguese debt-to-GDP ratio, after reaching a minimum of 50.1% in the first quarter of 2001, evolved within a relatively controlled range up to 2008, remaining below 70% of GDP.
12
However, the onset of the global financial crisis led to an explosive path of this indicator, which culminated in a maximum ratio of 132.8% in the first quarter of 2014. At the same time, it is noticeable that Portugal has been breaching the criteria regarding the sustainability of public finances set out by the Maastricht Treaty since 2004, when the debt irreversibly exceeded 60% of GDP (European Comission, 2015).
The other countries considered in this analysis present a similar pattern: their debt-to-GDP ratios demonstrated stability up to 2008, when the global financial crisis triggered significant increases in this indicator. The examples of Spain and Italy should be highlighted. The former had a public debt of 34.7% of GDP at the beginning of 2008 and reached a maximum of 100.2% of GDP in the first quarter of 2015, while the latter kept a relatively stable ratio at 100% of GDP until the beginning of the aforementioned crisis, being currently above 130% of the Italian output. The data on quarterly debt-to-GDP ratios of European countries was extracted from the Eurostat database, while the data on the same indicator for the United States of America was extracted from the Federal Reserve Bank of St. Louis database.
13
4 - Methodology
This section aims to explain the methodology applied in this research project. The use of time-series models to analyze the behavior over time of economic variables is nowadays a common practice. In this framework, the solutions which are more frequently applied are linear models, such as autoregressive models (AR), moving average models (MA) and ARMA models. These methods have become quite popular due to the statistical properties of the estimators, whose estimation process is fairly simple. However, although they are quite successful in numerous applications, these models are unable to represent nonlinear relationships. As an example, growth rates of GDP typically exhibit nonlinear behavior: they fluctuate around a higher value during expansions, being also more persistent in those moments, and fluctuate around a significantly lower and less persistent value during recessions (Kuan, 2002). Following the previous reasoning, nonlinear modeling may be an appropriate decision whenever macroeconomic relationships are subject to regime changes. This is exactly the framework inherent to this research, given the attempt to identify different impacts of public debt on economic growth, according to the economic cycle. Therefore, considering the characteristics of the analysis proposed, a Markov switching model emerges as the most appropriate one. This model is one of the most popular nonlinear time-series models, involving several specifications that characterize the time-series behavior in the different regimes.
The main application of this methodology was introduced by Hamilton (1989). Using this methodology, the author classified as a “recurrent feature” of the American economic cycle the phenomenon of periodic shifts from a positive growth rate of the Gross National Product (GNP) to a negative growth rate of GNP, arguing that this change can be used as an objective criterion to define and measure economic recessions. Furthermore, the author concluded that a typical economic recession in the country is associated with a permanent loss of 3% of GNP
14
(Hamilton, 1989). Aiming to pursue a better understanding of the Markov switching model (of order one), the following equation should be kept in mind:
Firstly, it is important to verify that the equation unfolds into two specifications, considering the prevailing regime in quarter “𝑡”. As this model allows for several transitions of states as an intrinsic property, it is able to capture more complex dynamic processes. This switching mechanism is determined by an unobservable binomial state variable “𝑠𝑡”, which simply indexes the states, being the interpretation only given by the analysis of parameter values. Moreover, this variable follows a first order Markov chain, being the immediate consequence of this process the fact that the value of “𝑠𝑡” in quarter “𝑡” depends only on its preceding value and not on a sequence including previous periods. Therefore, the Markov chain is based on a memoryless process, which implies that one specification can prevail over a random period of time, being replaced by the other specification when changes of regime occur. Moreover, in this framework, the transition of regime is stochastic, meaning that one does not know whether there will be a switch of state or not. But the dynamics underlying this process is driven by a transition matrix, which controls the probabilities of a transition happening (Perlin, 2010).
𝑃 = [
𝑝
11…
𝑝
1𝑘⋮
⋱
⋮
𝑝
𝑘1… 𝑝
𝑘𝑘]
Equation 1 – Markov switching model structure
𝑌𝑡 = ൝ 𝛼0+ 𝛼1𝑋𝑡−1 + 𝛽 𝑌𝑡−1+ 𝜀𝑡, 𝑠𝑡 = 0 𝛼2+ 𝛼3𝑋𝑡−1 + 𝛽 𝑌𝑡−1+ 𝑣𝑡, 𝑠𝑡 = 1 , where ቐ𝜀𝑡 ~ ൫0, 𝜎1 2൯ 𝑣𝑡 ~ ൫0, 𝜎22൯
15
The probability 𝑝𝑖𝑗, which can be found in row 𝑖 and column 𝑗, exhibits the probability of a transition from regime 𝑖 to regime 𝑗. As there are only two possible states in this research, this matrix is restricted to a 2x2 matrix, comprising 4 probabilities. An important feature of such matrix is that its parameters are not variation free. However, the assessment of constant transition probabilities allows one to determine the persistence of each regime.
The Markov switching model does not require a predefined threshold determining the change of regime, since the definition of each regime is probabilistic and is determined by the data. However, the model could be difficult to interpret since the state variable is not observable. It is now imperative to establish the connection between the equation presented above and the corresponding variables in the estimation process. The dependent variable “𝑌𝑡” corresponds to
the variable “GDP”, which represents the growth rate of GDP in quarter “𝑡”. The explanatory variable “𝑋𝑡−1” corresponds to the variable “𝐷𝐸𝐵𝑇𝑡−1”, which represents the debt-to-GDP ratio in quarter “𝑡 − 1”. Thus, the analysis carried out assesses the impact of government debt with a
one quarter lag compared to the growth rate of GDP. The main goal of this research is to understand if the coefficients “𝛼1” and “𝛼3” are statistically different, implying that the impact of public debt varies according to the economic cycle. As can be seen in equation (1), the term “𝛽 𝑌𝑡−1” is present in both specifications. Therefore, “𝑌𝑡−1”is a non-switching variable whose impact “β” does not change according to the regime. It is straightforward to deduce that it corresponds to a one quarter lag of the dependent variable, intending to analyze the impact of last quarter’s growth rate of GDP in the actual quarter’s growth rate of GDP. This term is introduced aiming to incorporate the remaining sources which could explain economic growth.
16
5 - Estimation Results
The analysis of the main results arising from the application of the Markov switching model is performed in this section. The results obtained for Portugal are subject to a more detailed and exhaustive analysis, while the results achieved in the assessment carried out for the other countries will be qualitatively analyzed in the next section, allowing one to establish comparisons.
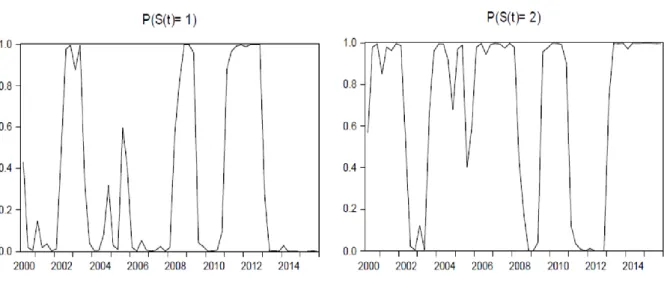
It is extremely important to determine which regime corresponds to economic expansions and which one portrays economic recessions before proceeding to the analysis of the coefficients estimated. The analysis of the filtered transition probabilities, through figure 3, allows one to establish such correspondence. It is necessary to clarify that the concept of economic expansion corresponds to the quarters when positive growth rates of GDP were achieved, while economic recessions include the quarters that registered negative growth rates of GDP.
The left graph presents the evolution of the probability of regime 1 to be established in a specific quarter while the right graph shows the evolution of the probability of regime 2 to be implemented in the period under analysis. By analyzing in detail the evolution of both lines representing probabilities, it is possible to achieve firm conclusions about regimes
17
identification. Regime 1 is most likely to occur in three specific periods, which coincide precisely with the periods of economic recession described in the “Data Description” section: between 2002 and 2003, between 2008 and 2009 and finally, between 2010 and 2012. Moreover, regime 2 is more likely to prevail in the remaining periods, mostly marked by positive growth rates of GDP. Therefore, one can state that regime 1 corresponds to economic recessions while regime 2 corresponds to economic expansions.
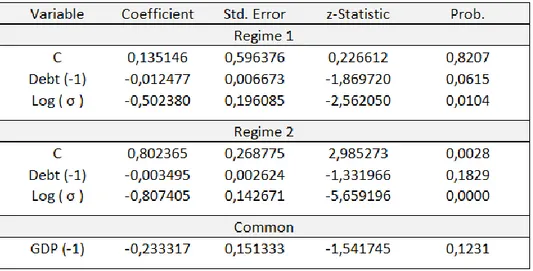
Figure 4 depicts the estimation output obtained for Portugal. It is important to verify that the estimated equation complies precisely with the analysis proposed in this research project, where it is intended to assess the impact of public debt (with a one quarter lag) on the growth rate of GDP. The existence of two regimes should also be noted, as it was intended. Through the analysis of the coefficients associated with each explanatory variable, as well as the analysis of the constant transition probabilities and constant expected duration of each regime, it will be possible to verify whether public debt has a significant impact on economic growth or not and which regime is the most persistent. The critical analysis of such values is the most expected component of this research.
18
Concerning the regime of economic recession (regime 1), it is possible to verify that the constant, which represents the conditional average behavior, is not statistically significant. The coefficient associated with the variable “𝐷𝐸𝐵𝑇𝑡−1” is -0.012477, which is statistically significant at a 10% level. Therefore, it is possible to state that an increase of 1 percentage point in the debt-to-GDP ratio in quarter “𝑡 − 1” yields a decrease of about 0.01 percentage points in the growth rate of GDP in the following quarter. More than the value of the coefficient, it is important to draw conclusions from its negative sign: increasing the public debt ratio has a penalizing effect on the Portuguese economic growth. Moreover, it can be verified that volatility exhibits a coefficient which is statistically significant. This result will be analyzed together with the one achieved in the other regime.
Focusing now on the regime of economic expansion (regime 2), the constant presents a positive coefficient, as expected. However, the variable “𝐷𝐸𝐵𝑇𝑡−1” is not statistically significant. This result is particularly interesting because it implies that, in periods of economic expansion, the debt-to-GDP ratio recorded in quarter “𝑡 − 1” does not contribute to explain the growth rate of Portuguese GDP in quarter “𝑡”. Finally, it is noted that volatility is again statistically significant. However, the coefficient associated with this variable is lower than the one obtained in the previous regime, meaning that the volatility observed in the economic expansion regime is lower than the volatility observed in the economic recession regime.
It should also be noted that the growth rate of GDP in the previous quarter has been proved to be statistically insignificant to explain the evolution of the Portuguese growth rate of GDP. Nevertheless, the need to keep such variable in the model is related with the attempt to capture the effect of other phenomena that may influence economic growth.
19
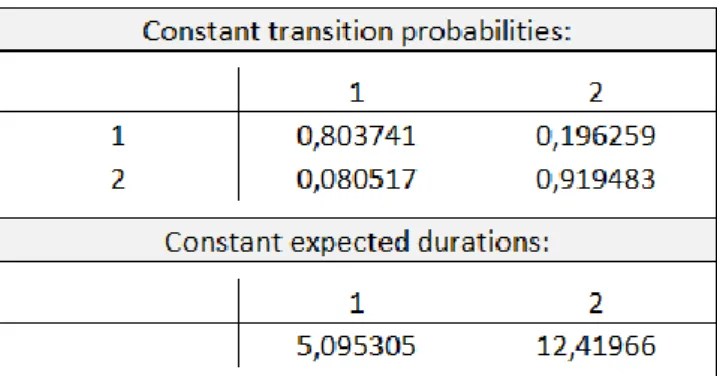
Finally, it remains to analyze the constant transition probabilities and the constant expected durations. The analysis of these two topics allows one to reach a more robust idea about the persistence of each regime, as well as regarding the transition phenomenon that occurs multiple times between them. Therefore, after examining the upper component of figure 5, both regimes can be considered persistent, since in both cases the probability that the current regime prevails in the following period is substantial: in the economic recession regime (regime 1) the probability is about 80%, while in the economic expansion regime (regime 2) it is almost 92%. It is also important to remember the existence of a balanced number of observations associated with each regime: 38 quarters of positive GDP growth rates and 26 quarters of negative GDP growth rates.
The analysis of the constant expected duration associated with each regime allows one to extract additional information on the persistence of each regime. The economic recession regime has an expected duration of 5,1 quarters, which is more than one year, while the economic expansion regime has an expected duration of 12,4 quarters, which exceeds 3 years. Therefore, the economic expansion regime exhibits an expected duration that is almost 3 times higher than the expected duration of economic recession regime, being for that reason more persistent.
20
6 - Comparisons with results achieved by other countries
At this time, it is appropriate to introduce and analyze the results obtained for the other countries, namely France, Germany, Italy, Spain, the United Kingdom and the United States. It should be noted that the performed analysis is purely qualitative, allowing comparisons with the results obtained for Portugal, without the need to quantify them. The first result achieved was the inability of the model applied in this research to provide acceptable results for some of these countries, implying the need to proceed with the estimation of conventional linear models in those situations, in order to obtain an idea about the impact of public debt on the growth rate of GDP.
France is the country that presented the most similar results to those obtained for Portugal. In the economic expansion regime, the debt-to-GDP ratio proved to be statistically insignificant to justify economic growth, which is partly explained by the effect of a constant variable. Regarding the economic recession regime, public debt has a negative impact on the growth rate of GDP, being such impact higher than the one in the Portuguese case. The growth rate of GDP recorded in the previous quarter exerts a positive influence on the actual growth rate of GDP. Finally, the volatility associated with the economic recession regime is higher than the volatility verified in the economic expansion regime, as it occurred in Portugal.
Following the analysis for Spain, it was also possible to identify two different regimes. However, despite this identification, public debt proved to be statistically insignificant to explain the evolution of the growth rate of GDP in both regimes. Therefore, a constant variable partially explains the growth rate of GDP in the two states. The previous quarter’ growth rate of GDP shows a positive influence on the actual growth rate of GDP. The volatility assessment is in accordance with the result obtained for Portugal.
The results obtained for Italy are somehow more puzzling, hampering their analysis. In the economic expansion regime, public debt turned out to be statistically insignificant to justify
21
economic growth. The most unexpected and intriguing result is the positive impact of public debt on the growth rate of GDP achieved in the economic recession regime. Still, the explanation for this result stems from the fact that public debt is introduced in the analysis with a lag of one quarter: as public debt decreased in the quarter that preceded the most significant economic recession, the analysis of this coefficient is slightly dubious and could lead to misunderstandings. Once again, the growth rate of GDP registered in the previous quarter exerts a positive effect on the actual growth rate of GDP. Finally, the volatility is common to both regimes.
For those countries, for which it was not possible to identify two distinct regimes, namely Germany, the United Kingdom and the United States, it was necessary to apply the alternative methodology already mentioned before. The main justification for this need is the poor balance between quarters of economic expansions and economic recessions, preventing the identification of two different regimes. The results obtained for these three cases are very similar: the impact of public debt has been classified as statistically insignificant to explain the evolution of the growth rate of GDP. In contrast, the growth rate of GDP achieved in the previous quarter, which is intended to capture the effect of other sources, has a positive effect on the actual growth rate of GDP. Nevertheless, the conclusions extracted for this set of countries slightly departs from the framework adopted in this research, since they do not distinguish the effects taking into account the economic cycle.
22
7 - Conclusion
This section aims to summarize the main results achieved in this dissertation, as well as to identify significant drawbacks in this process and to suggest further research work.
The main goal of this empirical study was to assess the impact of public debt on the growth rate of GDP in Portugal, taking into account the economic cycle. The most prominent studies in this field are limited to the identification of a certain threshold above which the impact of public debt is harmful, being these studies carried out mainly for bigger countries. Therefore, although there are already several published papers, there is no previous study with the same features of this one. The introduction of the Markov switching model made it possible to introduce an innovation in relation to the aforementioned studies, as it endogenously determines the two economic regimes, whose transition probabilities are derived from data. This methodology allowed to clearly identify these two economic regimes in the Portuguese context, which coincided perfectly over time with the periods of economic expansion and economic recession. While in the expansionary period public debt has no influence on the growth rate of GDP, in the contractionary period, public debt has a significant negative impact on economic growth. It is also noteworthy that both regimes are persistent, but the economic expansion regime has a higher expected duration. In addition, it was also possible to conclude that the volatility associated with periods of economic recession is higher than the one observed in periods of economic expansion. Finally, results registered in the previous quarter do not contribute significantly to explain the actual growth rate of GDP. This set of results is particularly important, as it can be used to better understand the importance of achieving a balance in public finances, as it acts as a driver of economic growth in Portugal.
The analysis of the results obtained for the other countries, which were used mainly to establish comparisons, is not so direct. Clearly, it was not possible to derive connections as conclusive as in the Portuguese case, being France the country that registered the most similar conclusions.
23
Although it was possible to identify two different regimes, the results achieved for Spain and Italy were not so obvious and indisputable. Finally, in the cases of Germany, the United Kingdom and the United States, the model was not able to produce satisfactory results, triggering the need to use an alternative approach, in order to make comparisons with the results obtained in the main analysis.
Following what has now been exposed, it is important to state that this research project is not free of caveats. The main drawback that can be identified in this process is related with the reduced number of available observations, which contributed to the imbalances between regimes, particularly in the countries used to establish comparisons. This situation leads to the inability of the model to produce satisfactory results for specific countries. Another drawback that can be pointed out is the inflexibility of the applied model to incorporate other explanatory variables, leading to the need to embody those effects in the control variable introduced. The recognition of these drawbacks is a requirement for the transparency and clarity of this research, but they also allow for the identification of further research suggestions, which are expected to complement and extend the scope of the analysis realized. Thus, it would be instructive to carry out the same research with an extended number of observations, allowing for a better balance between economic expansion and economic recession regimes. Moreover, it would be beneficial to extend the research to other countries, without forgetting the need to pay attention to possible extreme phenomena, which are capable of distorting the scope of the analysis.
24
References
Barro, R. (1974). Are Government Bonds Net Wealth? Journal of Political Economy, 1095-1117.
Barro, R. (1990). Government spending in a simple model of endogenous growth. Journal of
Political Economy, 103-125.
Cecchetti, S., Mohanty, M., & Zampolli, F. (2011). The real effects of debt. BIS Working
Papers No 352.
Checherita, C., & Rother, P. (2010). The impact of high government debt on economic growth and its channels: An empirical investigation for the euro area. Working Paper Series No
1237.
Devarajan, S., Swaroop, V., & Zou, H.-f. (1996). The composition of public expenditure and economic growth. Journal of Monetary Economics, 313-44.
Elmendorf, D., & Mankiw, G. (1998). Government Debt. Handbook of Macroeconomics 1, part
3, 1615-1669.
European Comission. (2015, May 18). Retrieved from:
http://ec.europa.eu/economy_finance/euro/adoption/who_can_join/index_en.htm Hamilton, J. D. (1989). A new approach to the economic analysis of nonstationary time series
and the business cycle”. Econometrica, Vol.57 No.2, 357-384.
Herndon, T., Ash, M., & Pollin, R. (2013). Does High Public Debt Consistently Stifle Economic Growth? A Critique of Reinhart and Rogoff. Cambridge Journal of Economics, 257-279.
Keynes, J. M. (1936). The General Theory of Employment, Interest and Money.
Kourtellos, A., Stengos, T., & Tan, C. (2013). The effect of public debt on growth in multiple regimes. Journal of Macroeconomics, Volume 38 Part A, 35-43.
25
Krugman, P. (1988). Financing vs Forgiving A Debt Overhang. Journal of Development
Economics, 253-268.
Krugman, P. (2010, August 11). Reinhart And Rogoff Are Confusing Me. The New York Times. Kuan, C.-M. (2002). Lecture on the Markov Switching Model. Taipei, Taiwan.
Kumar, M., & Woo, J. (2010). Public Debt and Growth. IMF Working Paper.
Modigliani, F. (1961). Long-Run Implications of Alternative Fiscal Policies and the Burden of the National Debt. The Economic Journal, 730-755.
Panizza, U., & Presbitero, A. (2012). Public Debt and Economic Growth: Is there a causal effect? MoFiR working paper No.65.
Perlin, M. (2010). MS_Regress - The MATLAB Package for Markov Regime Switching Models. Retrieved from http://ssrn.com/abstract=1714016
Reinhart, C., & Rogoff, K. (2010). Growth in a Time of Debt. National Bureau of Economic
Research Working Paper No 15639.
Ricardo, D. (1817). On the Principles of Political Economy and Taxation. London.
Romer, P. (1986). Increasing Returns and Long-Run Growth. The Journal of Political