Ar
ti
cle
*e-mail: [email protected], [email protected]
Capillary Pressure Driven Water Movement in Wet Unsaturated Porous Media:
Effect of Particle Electric Charge
Rosa M. Torres Sánchez*
Centro de Technología de Recursos Minerales y Ceramíca, CETMIC, Camino Parque Centenario y 506, CC 49, 1897 M. Gonnet, Argentina
Experimentos do luxo da água usando um meio poroso não saturado compoto por diferentes sistemas de α- alumina molhada não-saturada indicam que a carga supericial da partícula diminuiu com o aumento da água movimentada. O movimento máximo de água ocorreu quando a carga supericial era zero. O movimento da água foi afetado pela espessura da dupla camada elétrica no pH em que as partículas têm carga líquida (a partir do IEPpH). Estes resultados sugerem estruturação da água, induzida por carga, adjacente a superfícies de partículas carregadas.
Experiments of water low using a non saturated porous medium constituted by different α- wet unsaturated alumina systems indicate that particle surface charge decreased the amount of water moved. Maximum water movement occurred when surface charge was zero. Water movement was affected by thickness of the electrical double layer at pH where particles have net charge (out of the IEPpH). These results suggest charge-induced structuring of water adjacent to charged particle surfaces.
Keywords: alumina, electrical double layer, surface charge, water low
Introduction
Prior studies in our laboratories,1-2 in agreement
with those accomplished by Karkare et al.3 have shown
that application of insoluble surfactants to part of a wet unsaturated porous medium leads to water movement from the surfactant-containing to the surfactant-free part of the system. Different surfactants were analyzed on wet unsaturated porous medium (mainly of sand columns). Karkare et al.3 analyzed the effects of 33 different
surfactants (long chain alcohols, acids, esters, and amines) on unsaturated low indicating that effective surfactants must be water insoluble. Notwithstanding, further studies performed by Henry et al.4 found that the resultant moisture
content distribution in the column was different when the low-solubility alcohol as butanol was used. In the literature, sand was almost always used to simulate the wet unsaturated porous medium,1,5-10 and similar results
indicate that the surfactant causes differences in capillary pressure within the system and water moves to re-establish equilibrium.7-8 The amount of water that moves depends7
on all the factors that inluence capillary pressure – particle
wettability, size, size distribution, packing, etc., as well as the character of the surfactant monolayer that establishes the capillary pressure gradient within the system.
In this work the inluence of another variable – particle surface charge – on capillary pressure driven water movement in different α- wet unsaturated alumina porous media was examined. The knowledge of the interactions between surfactants and ine particles will help to improve techniques such as soil surfactant-based remediation which is limited by soil texture.11-12 A Knowledge that, among others, will help
to understand the washing eficiency decrease of surfactants found in soils with large content of fine-sized textural particles (silt, clay and Fe or Al oxides).13 An extra bonus
could also be achieved by the knowledge of charge effects on these interactions in order to be applied on salt solutions nanoiltration through alumina membranes in environmental process,14 and to use their attractive properties in membrane
iltration systems of Al oxides, Al nanoparticles, or heated aluminum oxide particles.15 The outlined hypothesis is that
The effects of particle surface charge on nearby water have been investigated, with conflicting results. For example, Bijsterbosch and Lyklema16 studied alcohol
adsorption on silver iodide, concluding that “minimum orientation of water dipoles with respect to the surface depends on the surface charge of silver iodide. The S shape of the alcohol adsorption isotherms can be explained by the assumption of the existence of some structure in the aqueous layer adjacent to the surface. This structure must be broken down before adsorption can occur.” They found
maximum adsorption of alcohol when the (silver iodide) particles carried a surface charge of about −1 µC cm-2 which
they took to be the condition where minimum orientation of water dipoles occurs. In a previous work,17 it was reported
that the permeability coeficient of water through various colloidal pastes reaches a maximum when charge on the particles is zero and that if other factors are normalized; iltration eficiency can be used as a means of determining the pH where zero charge is achieved. Tschapek et al.18
in 1987 reported that particle surface charge inluenced surfactant-driven water movement through wet unsaturated α-alumina. However, they found no correspondence of maximum water movement with zero surface charge. In 1991 these same authors,19 reported that particle surface
charge had no inluence on capillary pressure driven water movement through wet unsaturated sand and alumina. Karkare et al.3 in 1993, conirmed this negative result for
wet unsaturated sand.
Particularly, alumina oxides surface are positively charged over a wide pH range (from 1.5 to 7.5),20 but
particle surface charge varies with the pH of the system. The pH where the electrokinetic potential of a particle is zero is called the isoelectric point (IEP). The pH where the titratable surface charge is zero is called the point of zero charge (PZC). These two quantities have the same pH value only in the absence of speciic adsorption (adsorption for which the adsorption energy differs from the Coulombic energy).21 Speciic ionic adsorption shifts both the IEP
and the PZC in opposite directions of pH referred to the charge-determining ions (H+ or OH-).22 Such a shift explains
why Tschapek et al.18 in 1987 did not ind maximum water
movement in wet unsaturated α-alumina at pH 9.0, with an indicated PZC of pure alumina determined by titration of pH 9.23-24 It is shown below that the α-alumina used
by Tschapek et al.18 is coated with a small quantity of
speciically adsorbed material, which makes its isoelectric point pH 5.0 instead of pH 9.0. Speciic adsorption was not recognized by Tschapek et al.18, who did ind maximum
water movement in the vicinity of pH 5.0.
Depending on the particle surfaces involved, different times are needed to attain suspension equilibrium pH. The
initial suspension pH value may change with time because of solvent reaction with functional groups on the colloidal surface and so may not relect the pH of the solid surface when equilibrium between the solvent and the colloidal surfaces is achieved. In the work reported here, suspension pH was checked repeatedly until equilibrium was achieved. Particle surface charge should have maximum inluence on water that is very close to the particle surface. Closeness is promoted by systems of small particles. Small particles have larger surfaces area to be close to than large particles do. Besides, the spaces between particles in assemblies of small particles are smaller than the spaces between particles in assemblies of large particles. In this work, water movement as a function of surface charge is reported for three different colloids of α-alumina whose speciic surface areas vary from about 2 to 110 m2 g-1. These speciic surface
areas are much higher than the 0.013 m2 g-1 found for the
sand investigated previously,9,25 where particle surface
charge had no measurable effect on water movement.
Experimental
Materials
The colloids studied were α-alumina of three different origins (Active Acidic -Activity 1- for Column Chromatography from EM Science, Gibbstown NJ and Alcan and Alcoa, Brazil). The alumina from EM Science was the same colloid, though designated differently, as studied by Tschapek in 1987. The colloids were coded samples A, B and C, respectively. The surfactant was 97% 1-tetradecanol (Fluka AG, Buchs, Switzerland).
Methods
Charge densities of the samples were modiied by addition of HCl or KOH to concentrated colloids slurries. This procedure was repeated until the desired pH was achieved and this pH did not change with time (a week). The samples were then dried at 100 oC overnight. A portion
of each dried sample was reintroduced into a proportional amount of water and the pH was measured again. This inal pH was considered the equilibrium pH value for each sample.
The procedure for setting up and following a water movement experiment was as previously described.3
Figure 1 shows the setup utilized.
in excess of the amount required to form close-packed monolayers at the air-water interface within the tubes.7
The tetradecanol was mixed with the wet samples. The ends of the tubes were capped and the tubes were placed horizontally. After 24 h, the water contents of different sections along the length of each tube were determined by measuring weight loss on drying and are reported as weight percentages based on weight of the dry sample. Preliminary experiments were made with different initial water contents to ind the water content that led to maximum movement of water,7 at natural colloid pH. This same water content
was used in subsequent experiments with samples whose charge densities had been modiied. With the exception of experiments with KCl solutions that are described below, distilled water was used in all water movement experiments. Equilibrium pH’s for samples whose charge densities had been modiied were not signiicantly affected by the water movement experiment. All data were collected at room temperature of approximately 23 oC.
Particle speciic surface areas were determined by nitrogen adsorption using BET method, at –196 oC in a
Quanta Chrome Autosorb instrument (Quanta Chrome, Boynton Beach, FL). Particle size distributions were determined in wet sodium hexametaphosphate with a Model 500 Sedigraph (Micromeritics Corp., Norcross, GA). X-ray diffraction (XRD) analysis was carried out at 40 kV and 20 mA with Cu Kα radiation and Ni ilter using a Philips Model 3170 instrument (Philips Electronics Company, Mahwah, NJ). Morphology of the particles was observed with a Philips Model 505 scanning electron microscope. Apparent densities of the samples in packed beds were determined by adding dry samples to 10 mL volumetric lasks. The lasks were tapped and more sample was added until the lasks were illed to the calibration marks and no additional settling occurred. Sample masses were then divided by lask volumes. These measurements
were made in triplicate. Average apparent densities are reported.
To identify impurities associated to sample A (α-alumina, EM), a portion of this sample was extracted several times with methanol, at 50 oC. The methanol was evaporated from
the extract. The remaining material was coded AMeOH and characterized by XRD and FT-IR spectroscopy.
Isoelectric point (IEP) determinations were performed through measurements of diffusion and zeta potentials.
Diffusion potential was determined through two calomel electrodes (Metrohm manufacture) inserted in cells containing 10-3 and 5 10-3 mol L-1 KCl, respectively,
where the sample equilibrated at different pH acts of membrane between the electrolytes of both cells. The EMF measurements were carried out with a digital Electrometer (Keithley Instrument Inc. model 616) with input resistance > 2 × 10¹⁴ ohms. The transference number (t+) values were
obtained from the EMF´s measurements from each sample at the equilibrated pH.25-27 The IEP’s were obtained from
the t+ vs. pH curves, when t+ equals 0.5. The t+ values
derive from all the cations that are contained in the sample. However since the quantity of free cations is one hundred times less than the quantity of adsorbed cations, the calculated t+ is considered,25 to correspond to the adsorbed
counter ions only.
The zeta potentials were determined by micro-electrophoresis (Brookhaven), using 10-3 mol L-1 KCl as
inert electrolyte.
Results and Discussion
Samples Characterization
Especially because of the varying results obtained from previous studies of charge effects on water movement, it was important to make a thorough characterization of the samples studied here.
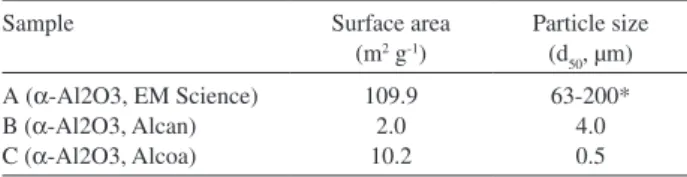
The particle sizes and surface areas of the samples are given in Table 1. Particularly, surface area value of sample A agrees with the value indicated elsewhere.28
Notwithstanding, a low correlation of particle size supplied by the manufacturer with speciic surface area obtained in this work is observed, and it is caused by particle agglomeration, as discussed below.
Figure 1. Experimental set up for measuring the water movement.
Table 1. Particle size and speciic surface area of the samples
Sample Surface area
(m2 g-1)
Particle size (d50, µm) A (α-Al2O3, EM Science)
B (α-Al2O3, Alcan) C (α-Al2O3, Alcoa)
109.9 2.0 10.2
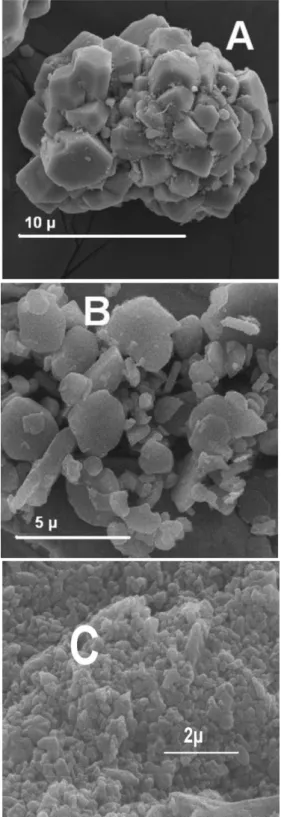
Electron micrographs of the samples are shown in Figure 2
The micrograph of Sample A, Figure 2A, shows agglomeration of these α-alumina particles. This agglomeration can explain the inconsistent correlation of surface area with particle size for this sample. Hand
grinding with an agate mortar destroys the agglomerates, as was shown by electron microscopy (igure not shown). The NaCl and KCl and the amine observed by XRD and FT-IR, respectively, may serve as binders to agglomerate the alumina particles. The micrographs of Samples B and C evidence differences, mainly, in the particle size.
X-ray diffraction patterns for the samples, and the material extracted from the α-alumina (EM), are shown in Figure 3. The sample A showed the characteristic peaks of a poorly crystallized α-alumina,29 as well as peaks at 31.53
and 45.28o (2θ) assigned to NaCl. The X-ray patterns for
the AmeOH sample showed peaks at 28.20, 40.37, 50.04, and 58.65o (2θ) and 31.53, 45.28 and 58.49o (2θ) corresponding
to KCl and NaCl, respectively and enlarged peaks around 13 - 17 and 22 - 23o (2θ) could correspond to an aliphatic
amine (e.g. methylbutyramine). Identiication by X-ray diffraction was not possible due to the overlapping of peaks of the detected salts. However, infrared spectroscopy of the AMeOH sample (igure not shown) showed absorption bands at 1406.8, 1663.9, 2856.8 and 2923.8 cm-1 which allowed
the sample to be identiied as an aliphatic amine.30 Samples
B and C show the characteristic peaks of crystallized α-alumina. Particularly peaks at 11.25 and 5.64 Å (7.84 and 15.66o (2θ)) in B sample indicate the presence of β-alumina.
Determination of Isoelectric Points and Points of Zero Charge
Table 2 resume the IEP values determined from diffusion potential after measurements of transference numbers (t+)
and PZC obtained by zeta potential measurements for all the samples. The IEP values for the B sample, pH 10.7, agree with literature values for α-alumina.23-24,31 The IEP found
for the samples A and C, pH 5.2 and 9.3 are lower than the pH 10.5 indicated in the literature for α-alumina.23-24,31 Figure 2. Electron microphotograph of the samples: A, α-Alumina (EM);
B, α-Alumina (Alcan) and C, α-Alumina (Alcoa).
This difference, particularly, in sample C can be explained by the presence of iron as impurity (0.06% determined by chemical analysis) and evidenced by the appearance of red color after a thermal treatment at 500 ºC and/or the presence of β-alumina observed by XRD32 (8.5% m/m of
diaoyudaoite NaAll1O17 determined by XRD using Rietveld method).33 The low IEP
pH obtained for sample A suggests
an anionic coating on the alumina, perhaps placed there to make a better column for chromatographic use. To conirm that the amine coating on this sample changed the IEP, zeta potential of the A sample was carried out to determine the PZC. A PZC value of pH 9.5 was obtained which is very different from the IEP value of pH 5.2. As was indicated previously, the coincidence and difference of PZC and IEP values indicated the absence and presence of coating, respectively.
Determination of Water Movement
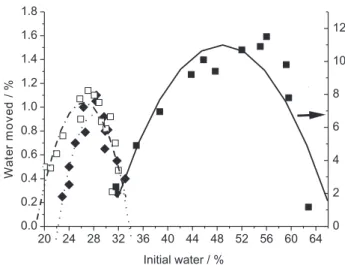
The amount of water moved by surfactants in wet unsaturated porous media varies with the initial saturation of the media and differs among systems. For a given system, it depends on the relationship between capillary pressure and water content and on the hysteresis of the surfactant desorption – water sorption curves.4 The dependence of
water moved percentage (mass of water lost from the left side of the column divided by the total mass of dry sample in the column times 100) on initial water percentage (initial mass of water in the column divided by mass of the dry sample in the column times 100) at natural pH for the samples used in this work is shown in Figure 4. Polynomial curves were used to connect all points only as a guide for the eye, the regression coeficient (R2) found in all cases
were > 0.9. Maximum % water movement occurred at 52, 28 and 26% initial water for the samples A (α-alumina EM), B (α-alumina from Alcan) and C (α-alumina from Alcoa). The maximum % water moved was approximately 1% for samples B and C and 12% for sample A. These numbers scale to the speciic surface areas of these samples listed in Table 1. Maximum % water moved for A sample agrees with results found for sand,3 indicating the high
inluence in these value of the particle size of the sample.
Capillary pressure-water content data for these systems are not available.
Effect of surface charge
The effect of surface charge on water movement was studied at the % initial water where the largest % water movement occurred (obtained form Figure 4). Graphs of % water moved vs. system pH for all the samples are shown in
Figure 5. Polynomial curve for sample B have a R2 = 0.83,
for all other samples the R2 > 0.9. In all cases, maximum
water movement occurred close to the pH of the isoelectric point indicated by the arrow.
Effects of neutral electrolyte
To take into account other factors apart from those that might inluence water movement differently at different pH’s (surface charge) and those that should affect packing surface charge (changes in electrical charge on the particles), apparent densities and sediment volumes for the A sample was determined at different pH’s. Apparent densities and calculated sample void fractions are shown in Table 3. The small changes in apparent densities and void fractions were not judged large enough to cause the differences in % water moved that have been noted. There
Table 2. IEP values determined from diffusion potential alfer measurements of transference numbers (t+) and PZC obtained by zeta potential measurements for all samples
Sample IEP
(pH)
PZC (pH)
A (α-Al2O3, EM Science) B (α-Al2O3, Alcan) C (α-Al2O3, Alcoa)
5.2 10.7
9.3
9.5 10.5
9.2
Figure 4. Dependence of % water moved on initial % water at natural pH for α-alumina (¢) EM, (£) Alcan and (¯) Alcoa samples. Open symbols follows the right axes, and closed the left one.
Table 3. Apparent densitie4s and calculated Void fractions at indicated pH
Sample pH
Apparent density (g cc-1)
Calculated Void fractions
A (α-Al2O3, EM Science) 5.5 4.4 3.7
1.07 1.24 1.12
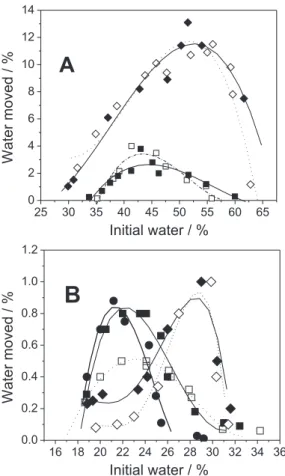
was no correspondence of water movement with very minimal changes in sediment volumes, results not shown. Experiments were performed to determine the effect of a neutral electrolyte (KCl), on capillary pressure driven water movement in wet unsaturated α-alumina (EM and Alcoa), at pH where the particles are electrically neutral (around the IEPpH)and charged positively (pH 3.8 and 8.2 for samples A and C, respectively). Results are shown in Figure 6 A and B for samples A and C, respectively. Regression coeficients were higher than 0.87 for all curves. The open symbols indicate water movement when the “wet” medium was distilled water. The closed symbols indicate water movement when the “wet” medium was an aqueous solution with KCl. There was no signiicant difference in results obtained for pH 5.0 and 9.4 close to that of the IEP for both samples (5.2 and 9.3, for samples A and C, respectively). The compression of the electrical double layer was not evidenced in the IEPpH where the particles are electrically neutral nor for the positively charged relatively larger particles of the A sample. When the samples were positively charged (pH 3.8 and
8.2 for samples A and C) the maximum % initial water shifted to a lower value (from 52% to 45% and from 29 to around 22%, for samples A and C, respectively) with an increase in the maximum % water moved as shown in Figure 6 (for a ixed % initial water). With the small and positively charged particles of the sample C % water moved increased up to the value found for same sample neutrally charged.
Conclusions
The experiments showed a relationship between particle surface charge and capillary pressure driven water movement. Water movement is a maximum at the pH corresponding to the isoelectric point of the particles. As pH of the suspension shifts from the IEP pH, the amount of water moved for a given sample decreases. These results suggest that particle surface charge causes structuring of water molecules that makes them more dificult to move. Electrical double layer thickness appears to affect water movement, mainly in low particle size samples.
Figure 5. Dependence of water movement on pH for A-alumina (EM), B-alumina (Alcan) and C-alumina (Alcoa), at initial water content of 43, 42, 60, 30 and 28%, respectively.
Figure 6. Effect of a neutral electrolyte (KCl) on capillary pressure driven
Acknowledgments
Financial support from ANPCyT-FONCyT for inancial support through PICT 1360 project and from the CONICET-NSF Programs through Award 1230/31-8-00 and 2491/11-12-1230/31-8-00 are gratefully acknowledged. The author also thanks, Eng. P. Montardit and M. Dapino and Lic. A. M. Cesio for their help in preparation experiences and XRD pattern identiication, respectively.
References
1. Tschapek, M.; Boggio, L.; Z. Pla. Boden. 1981,144, 30. 2. Tschapek, M.; Wasowski, C.; Torres Sánchez, R. M.; Colloids
Surf. 1981, 3, 293
3. Karkare, M.; La, H.; Fort, T.; Langmuir1993,9, 1684. 4. Henry, E. J.; Smith, J. E.; Warrick, A.; J. Hydrol. 1999, 223,164. 5. Henry, E. J.; Smith, J. E.; Warrick, A.; J. Hydrol. 2001, 245, 73. 6. Henry, E. J.; Smith, J. E.; Langmuir 2003, 19, 4047. 7. Karkare, M.; Fort, T.; Langmuir 1993, 9, 2398. 8. Karkare, M.; Fort, T.; Langmuir 1994, 10, 3701. 9. Karkare, M.; Fort, T.; Langmuir 1996,12, 2041. 10. Silverstein, D. L.; Fort, T.; Langmuir 2000,16, 829.
11. Kuhlman, M. I.; Greenield, T. M.; J. Hazard. Mater.1999, 66, 31.
12. Lee, D. H.; Cody, R. D.; Kim, D. J.; Choi, S.; Environ. Int.
2002, 27, 681.
13. Conte, P.; Agretto, A.; Spaccini, R.; Piccolo, A.; Environ Pollut.
2005, 135, 515.
14. Alami-Younssi, S.; Larbot, A.; Persin, M.; Sarrazin, J.; Cot, L.; J. Membr. Sci.1995, 102, 123.
15. Maximous, N.; Nakhla, G.; Wan, W.; Wong, K.; J. Membr. Sci.
2009, 341, 67.
16. Bijsterbosch, B. H.; Lyklema, J. In Structural properties of the silver iodide-aqueous solution interfaces; Fowkes, F., ed.; Academic Press: 1969, pp.164.
17. Torres Sánchez, R. M.; Mater. Chem. Phys. 1990,26, 173. 18. Tschapek, M.; Wasowski, C.; Falasca, S.; J. Dispersion Sci.
Technol. 1987, 8, 493.
19. Tschapek, M.; Wasowski, C.; Falasca, S.; Colloids Surf. 1991,
55, 1.
20. Karimi, M. A.; Behjatmanesh-Ardakani, R.; Goudi, A. A.; Zali S.; J. Braz. Chem. Soc., 2008, 19, 1523.
21. Breeuwsma, A.; Lyklema, J.; J. Colloids Interface Sci. 1973,
4, 437.
22. Lyklema, J.; Fundamentals of Interface and Colloid Science: Solid-Liquid Interfaces; Lyklema, J., ed.; Academic Press: London, 1995.
23. Parks, G.; Chem. Rev. 1965, 65, 177.
24. Tschapek, M.; Torres Sánchez, R. M.; Wasowski, C.; Anales Edaf. Agrobiol. 1979,38, 3.
25. Natale, I.; Tschapek, M.; Geoderma 1970, 4, 73.
26. Torres Sánchez, R. M.; Gasalla, H. J.; Pereira, E.; React. Solids
1989, 7, 53.
27. Torres Sánchez, R. M.; Mater. Sci. Lett. 1996, 15, 461. 28. Ramos, A. R.; Arguello, J.; Magosso, H. A.; Gushikem, Y.;
J. Braz. Chem. Soc.2008, 19, 4, 755.
29. Bahlawane, N.; Watanabe, T.; J. Am. Ceram. Soc. 2000, 83, 2324.
30. Silverstein, R. M.; Webster, F. X.; Spectrometric identiication of organic compounds, 6th ed., John Wiley: New York, 1998.
31. Torres Sánchez, R. M.; Boix, A.; Mercader, R.; J. Mater Res.
2002, 17, 712.
32. Gitzen, G. In Alumina as a ceramic material; Gitzen, G., ed.; Wiley-American Ceramic Society:Columbus Ohio, 1970, ch. 3. 33. Pascoal, C.; Maçado, R.; Pandeolfelli, V.; 43º. Congresso
Brasileiro de Cerâmica, Florianópolis, Brasil, 1999.
Received: May 5, 2009