Article
Printed in Brazil - ©2017 Sociedade Brasileira de Química0103 - 5053 $6.00+0.00*e-mail: [email protected]
Using Magnetized (Fe
3O
4/ Biochar Nanocomposites) and Activated Biochar as
Adsorbents to Remove Two Neuro-Active Pesticides from Waters
Tassya T. S. Matos,a,b Juliana Schultz,b Muhammad Y. Khan,c Everton F. Zanoelo,d
Antônio S. Mangrich,*,a,b,e Bruno R. Araújo,a Sandro Navickienea and
Luciane P. C. Romãoa
aDepartamento de Química, Universidade Federal de Sergipe, 49100-000 São Cristóvão-SE, Brazil
bDepartamento de Química Universidade Federal do Paraná, 81531-980 Curitiba-PR, Brazil
cDepartment of Chemistry, Sarhad University of Science and Information Technology, 25000 Peshawar-KPK, Pakistan
dDepartamento de Engenharia Química, Universidade Federal do Paraná, 81531-980 Curitiba-PR, Brazil
eInstituto Nacional de Ciência e Tecnologia - Energia e Ambiente (INCT E&A, CNPq),
Universidade Federal da Bahia, Campus Universitário de Ondina, 40170-115 Salvador-BA, Brazil
This work describes the removal of pesticides from water using activated and magnetized biochars produced from exhausted husk, and dry tannin from barks of black wattle (Acacia mearnsii De Wild.). These materials were characterized using chemical, spectroscopic, thermal, solid structure and surface area techniques. The activated and magnetized biochars were effective in removing the pesticides thiacloprid and thiamethoxam from both ultrapure water and Marcela Water Reservoir, Itabaiana, Sergipe State, Brazil. At the longest time examined, the amounts of thiacloprid and thiamethoxam adsorbed per gram of activated biochar adsorbent were 1.02 and 0.97 mg, respectively, while values of 0.73 mg (thiacloprid) and 0.40 mg (thiamethoxam) were obtained using magnetized biochar. A pseudo-second order model correctly described the kinetics of adsorption of both pesticides (R2≥ 0.922). Desorption experiments revealed that the
spent biochars could not be easily regenerated, which indicated that the forces holding the adsorbed fluid molecules to the solid surface were relatively strong.
Keywords: pesticides, biochar, adsorption, desorption, reuse
Introduction
Increased production and higher yields of food crops have been possible due to the extensive use of pesticides in agriculture.1,2 However, besides the soil contamination,
these compounds naturally transferred by leaching to rain or irrigation water may cause the pollution of lakes, rivers, wetlands, coastal waters, and groundwater.3,4 The
accumulation of these usually bioaccumulative anthropogenic contaminants in aquatic ecosystems has serious and well-known adverse effects on humans, plants and animals.5 Such
a kind of contamination problem is particularly of concern in Northeast Brazil, where stagnant reservoirs that continuously receive polluted irrigation water are frequently the only available source of water in the region.6
According to the National Pesticide Information Center
(NPIC, USA),7 thiacloprid and thiamethoxam are potentially
carcinogenic in humans.4,7 These neonicotinoid pesticides
are used to control pests in many important Brazilian crops, such as coffee, soybean and sugarcane. They also have low soil affinity, which means they present a great risk of being easily transported from soil to water bodies.3 Together, these
aspects make them ideal benchmarks for Brazilian researches that aim to remove pollutants from water.
Adsorption, generally classified into physisorption (characterized by weak van der Waals forces) and chemisorption (characterized by covalent bonding),8 is a
versatile and effective way of removal of contaminants. The use of inexpensive industrial wastes as adsorbents make it especially attractive from both economic and environmental perspectives.9 For instance, adsorption using carbon is
removal, and gasoline dispensing operations. Based on these advantages of adsorption, there is also a growing demand to find effective, low cost, and readily available adsorbents for the removal of pesticides.
In this scenario, the use of recycled wastes as adsorbents is particularly interesting, because the materials are often free of charge, and their use as adsorbents could contribute to solve the problems of waste disposal.10 In fact, the
identification/quantification of possible co-products (byproducts and waste) to minimize waste generation during chemical processes is one of the most important aims of green chemistry. It not only contributes to reduce the consumption of feedstocks and energy, but it also promotes the use of recycled materials as inputs for the same or different processes.1,11
Wastes from the agricultural industry constitute a relevant renewable source of carbon present mainly in the form of cellulose, hemicellulose, lignin, and other substances.12 The
lignocellulosic biomass from the bark of black wattle (Acacia mearnsii De Wild.), a plant native to Australia cultivated commercially in the Southern Brazilian state of Rio Grande do Sul, is a good example of this type residue that may be used as adsorbent. The bark is processed industrially to extract tannins, including gallocatechin and robinetinidol as the main monomers, that are market as antioxidants, clarifiers, textile dyes, coagulants, flocculants, antifouling agent, or dried and used experimentally as adsorbent.13,14
An interesting use for the residual biomass from this kind of industry (i.e., bark free of tannins or lignocellulose) is the production of biochar by pyrolysis; a thermochemical process that converts biomass into biochar, biogas, and bio-oil. The most important variables in this process are the temperature, type of biomass and atmosphere (inert or little oxidizing).15 One way of improving the properties
of biochar as adsorbent (i.e., to enhance its adsorption capacity) is to treat the biomass at different operating conditions in terms of the aforementioned factors, or to activate chemically with KOH the product of pyrolysis. Both these strategies may contribute to have a highly porous and a low ash content biochar.16,17 The result of combining
biochar and a magnetic material is an adsorbent that not only may remove pollutants such as phosphate, organic selenium and arsenic, but that may also be easily recovered when the adsorption operation is carried out with the solids dispersed in the wastewater;18,19 an approach that enhance
the kinetics of adsorption.
In this framework, the purpose of this study was to evaluate the use of barks of black wattle free of tannins (from now referred to as exhausted husk), as well dry tannins extracted from the bark of the same plant, as adsorbents. In particular, these materials were tested to
remove neonicotinoid pesticides from a solution prepared with ultrapure water, and from samples from a stagnant reservoir of water located in Northeast Brazil (Marcela dam, Itabaiana, SE, Brazil). The Marcela dam reservoir was chosen because of its potential risk of contamination with untreated domestic sewage,20 but mainly with persistent
pollutants due to the commercial agricultural practices with irrigated water and extensive use of pesticides.
Experimental
Production of biochar
The black wattle (Acacia mearnsii De Wild.) used
to obtain the exhausted husk, and tannin biochars was provided by the company Tanac S.A. (Rio Grande do Sul State, Brazil).
The extraction of tannin from the tree barks was performed in autoclaves, generating exhausted husk (EH) as a byproduct. The EH was used in the production of activated biochar (AB), and the tannins (TAN) were used to produce magnetic biochar (MB).
Preparation of activated biochar (AB)
To prepare the activated biochar samples, the exhausted husk (60-80 mesh size) was initially dried in an oven at 900 °C up to constant mass. Then, 20 g of this material and 40 g of ZnCl2 (activating reactant) were mixed and
taken to an oven at 100 ± 10 °C for impregnation for 13 h. Pyrolysis was subsequently performed using a heating rate of 5 °C min-1, with hold times of 30 min at 250 °C and
60 min at 600 °C. The activating reactant was removed by washing with HCl (10%, v/v) and hot distilled water (80-100 °C), respectively.21
Preparation of magnetic biochar (MB)
The magnetic biochar was synthesized by a modified co-precipitation method.19 The dry tannin biomass powder
was ground, screened using an 80 mesh sieve, and 200 g was added to 1 L of an aqueous solution containing 80 mmol L-1
of FeCl3 and 40 mmol L-1 of FeCl2. Under vigorous magnetic
stirring for 30 min, an aqueous solution of 5 mol L-1 NaOH
was added to the tannin solution to increase the pH of the suspension to 10. The solid precipitated was separated by centrifugation at 3000 rpm, with relative centrifugal force (RCF) of 1811 × g, and placed in a ceramic pot for pyrolysis. The material was firstly heated at 100 °C for 2 h, then the temperature was raised to 400 °C at a rate of 5 °C min-1 and kept at this condition for 6 h. Then, the
Characterization of the biochar samples
Infrared spectra of the two considered biochars and their precursors were recorded between 4000 and 400 cm-1 with
a Varian 640-IR spectrometer operated in transmittance mode, using KBr pellets.
The morphology of the sample surfaces was investigated by scanning electron microscopy (SEM) with a TM 3000 microscope (Hitachi) operated under high vacuum at 15 kV, emission and filament currents equal to 29500 and 1850 nA, respectively.
Thermogravimetric analyses (TGA) were performed by using a Shimadzu TGA-50 instrument. In summary, 5 mg of each sample were placed in a platinum crucible and heated from 30 to 900 °C at a heating and a volumetric flow rate of nitrogen close to 10 °C min-1 and 40 mL min-1, respectively.
The specific surface areas of the materials were determined by nitrogen adsorption at 77 K, using a Quantachrome NOVA 1200 analyzer. The Brunauer-Emmett-Teller (BET) method was used, which is based on determining the volume of adsorbed nitrogen gas by means of adsorption and desorption at different pressures. Prior to the analyses, the AB and MB samples were degassed for 2 h at temperatures of 80 and 100 °C, respectively.
Identification of the crystal phases of the powders was performed by X-ray diffraction (XRD), using a Rigaku
DMAX100 diffractometer operated with CuKα radiation
(λ = 1.5406 nm) and 2θ in the range 10 to 60°, with scan steps of 0.02° min-1. Phase identification was achieved by
comparison with standard charts provided by JCPDS (Joint Committee on Powder Diffraction Standards).
Elemental analyses of the materials were performed with a LECO Model CHN628 analyzer, and the results were processed using CHN628 v. 1.30 software. The equipment was operated with helium (99.995%) and oxygen (99.99%), at a furnace temperature of 950 °C and combustor temperature of 850 °C. The equipment was calibrated with an EDTA standard (41.0% C, 5.5% H, and 9.5% N), using masses in the range 10-200 mg. The standards and samples were analyzed using 100 mg portions of the materials in aluminum foil.
Determination of the pesticides thiamethoxam and thiacloprid in ultrapure water and real samples
Certified standards of thiamethoxam (TMX) and thiacloprid (TCL) were purchased from Sigma-Aldrich (99% purity). Acetonitrile (HPLC grade) was obtained from Tedia (Brazil). Stock standard solutions of each pesticide, at concentrations of 1000 mg L-1, were prepared
by dissolving the compounds in acetonitrile in volumetric
flasks. The stock solutions were then diluted using ultrapure water and stored in brown bottles at 4 °C. Analytical curves were constructed using ultrapure water containing the pesticides at concentrations of 0.5, 1, 5, 10, 25, 50, 100, and 200 mg L-1. All experiments were performed in duplicate,
with a control sample and a reagent blank.
Chromatographic analysis conditions
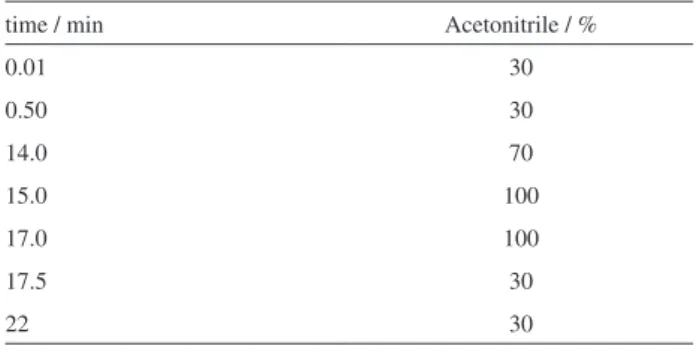
The pesticide analyses were performed using a Prominence liquid chromatography system (Shimadzu, Kyoto, Japan) consisting of the following modules: degasser (DGU-20A3) photodiode array detector (SPD-M20A), binary pump system (LC-20AT), automatic injector (SIL-20A), column oven (CTO-20A), and communication module (CBM-20A). A Shim-pack VP-ODS column (250 × 4.6 mm, 5 µm) was employed, and the system was controlled with Shimadzu LCSolution software. The mobile phase was acetonitrile/water, with gradient elution (Table 1). The injection volume was 20 µL, the column temperature was 30 °C, the mobile phase flow rate was 0.8 mL min-1, and the detector wavelengths were 254 and
242 nm for TMX and TCL, respectively.
Adsorption studies
The adsorption experiments were performed in duplicate using 10 mL of ultrapure water with only thiamethoxam or thiacloprid at concentrations of 10 mg L-1. These volumes
were added to amber vials containing 0.1 g of each type of biochar to form a solid-liquid dispersion at 25 °C that was agitated at 150 rpm with a shaker (MA 832/1, Marconi). Liquid samples were periodically removed from the vials, filtered with a 0.45 µm syringe filter (Millipore) and then analyzed by liquid chromatography.22
An aliquot of the solution was analyzed in order to determine the initial concentration of each pesticide. A control sample containing only ultrapure water (10 mL) was placed in contact with 0.1 g of each biochar, under
Table 1. Programming of mobile phase in gradient mode LC-DAD
time / min Acetonitrile / %
0.01 30
0.50 30
14.0 70
15.0 100
17.0 100
17.5 30
the same experimental conditions, for evaluation of the presence of interfering compounds.
Desorption studies
The experiments were also conducted using 10 mL of ultrapure water containing thiacloprid and thiamethoxam at concentrations of 10 mg L-1. These volumes were added
to centrifuge tubes containing 0.1 g of each type of biochar, with stirring at 150 rpm and 25 °C.
After adsorption times of 15 (AB) or 270 min (MB), the samples were centrifuged at 3500 rpm for 10 min. The supernatants were removed and filtered using 0.45 µm syringe filters, and then analyzed to determine the amounts of the pesticides adsorbed by the biochars. Using a method adapted from Xu et al.,23 the pesticides were desorbed from
the biochars in two different ways. In the first procedure, 10 mL aliquots of 1:10 (v/v) acetonitrile/water mixture were added to the tubes containing the biochar residues, while the second method employed 10 mL aliquots of water heated at 50 °C. The mixtures were stirred for the same periods of time used for the adsorption. The obtained solutions were centrifuged, the supernatants were removed, filtered, and the pesticide concentrations were determined by liquid chromatography.
Determination of the inorganic species in the Marcela reservoir water
The main inorganic species were measured using chromatograph ion, METROHM brand anions model 882 Compact IC Plus. Atomic absorption spectrophotometer with hydrides generator, graphite furnace and autosampler, brand VARIAN/AGILENT, AAS 240FS model and Micro Bureta (Titler Auto) METROHM, 876 Dosimat Plus were used.
Adsorption studies in the real samples
The initial concentration of TMX and TCL in the water from the Marcela reservoir was again determined by high performance liquid chromatography (HPLC). Water sample were collected in 1 L amber glass bottles. In the laboratory, the sample was conditioned at a temperature of 4 °C, an aliquot was filtered using a syringe filter (Millex-HD, 0.45 µm).
Removal of TMX and TCL was evaluated using the same conditions described for the standard solutions and ultrapure water, and the adsorption capacities were determined for the two adsorbents. The experiments were performed in triplicate.
The Marcela Water Reservoir sample was fortified with the two pesticides at a concentration of 10 mg L-1,
simulating the possible presence of these contaminants and common interferents occurring in the real samples. The simultaneous presence of the two pesticides allowed for competition between TCL and TMX for the adsorption sites of the biochars, which could lead to behavior different to that observed using the pesticides individually.
Results and Discussion
Characterization of the biochar samples
Spectroscopy in the infrared (IR) region
The spectra and peak assignments of the two biochars and their precursors are shown in Figure 1. In the case of the biochars, it can be seen that there were decreases in intensity or the disappearance of bands in certain regions, due to the degradation of the original materials during the biochar production processes.
The TAN and MB samples showed characteristic bands associated with the compositions of these materials. The spectrum of MB presented a broad band in the region near 3376 cm-1, assigned to O−H stretching of polyphenolic
compounds rich in hydroxyl groups. The presence of small bands at 2946 and 2859 cm-1, characteristic of aliphatic
C−H stretching, were in agreement with bands at 1442 and 1377 cm-1, assigned to aliphatic C−H folding. A band
at 1593 cm-1 was attributed to the stretching of aromatic
C=C, while the bending of ring CH was reflected by a band at around 810 cm-1. An absorption band at 1268 cm-1
corresponded to the stretching deformation of C−O and phenolic O−H groups.19,24 A shoulder at 1735 cm-1 in the
TAN spectrum was attributed to the stretching of carbonyl C=O of esters. An absorption band at 1513 cm-1, attributed
to the bending of the amine N−H bond, was present in the TAN spectrum but disappeared in the MB spectrum. This could have been due to the chemical coordination between the amine group and ions of iron. In the case of MB, the appearance of bands at around 571 and 419 cm-1
could be attributed to the stretching of the Fe−O bond of the magnetite obtained by chemical co-precipitation during formation of the biochar, showing that it could be characterized as a magnetized material.19
Using orange peel as the raw material for production of magnetized biochar, Chen et al.19 found from infrared
analysis that residues of the original material had been preserved in magnetized biochars pyrolyzed at temperatures of 250 and 400 °C, in contrast to biochars that were not magnetized. In the present case, the infrared spectrum for MB (Figure 1) indicated that the original material had been preserved, despite the use of a pyrolysis temperature of 400 °C.
The infrared spectrum of the EH showed bands at 3430 cm-1, associated with O−H stretching, and at 2920
and 2840 cm-1, assigned to the folding of aliphatic C−H.
This was supported by the presence of bands at 1446 and 1387 cm-1, due to the folding of aliphatic C−H. A band at
1622 cm-1 reflected the presence of aromatic material, and
a band at 1735 cm-1 was attributed to ester C=O stretching.
A band at 1518 cm-1 was attributed to the bending of the
amine N−H bond and a band at 1320 cm-1 was assigned to
the stretching of the amine C−N bond.
The spectrum for the AB showed a very small absorption band between 2925 and 2837 cm-1, ascribed to
aliphatic C−H stretching, which was in agreement with a band at 1381 cm-1, assigned to aliphatic C−H folding. A
band at 1584 cm-1 was attributed to aromatic material, and
a shoulder at 1154 cm-1 was associated with the structures
of cellulose and hemicellulose carbohydrates. Ghani et al.25
characterized biochar produced from rubber wood waste
and reported that the IR spectra showed the formation of aromatic products with lower hydrogen contents, compared to the original material. In the present work, AB was obtained using a pyrolysis temperature of 600 °C, while MB was produced at 400 °C, so AB was more liable to changes in chemical composition due to carbonization, relative to the EH parent material.
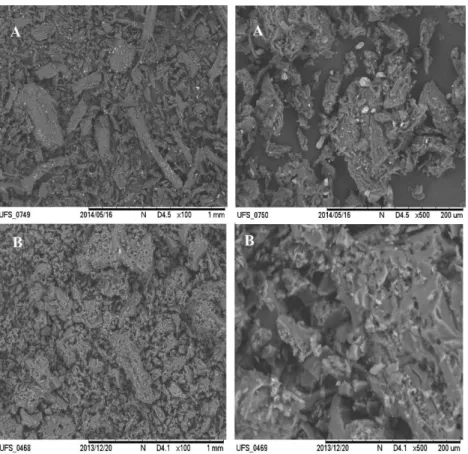
Scanning electron microscopy (SEM)
The morphology of biochar depends to a large extent on the pyrolysis temperature employed, and also of the type of the used raw material which influences the degree of porosity of the produced biochar. According to Tang et al.2
a higher process temperature increases the porosity and surface area of biochar. However, here the BET surface area analysis showed that MB, which was pyrolyzed at 400 °C, had a greater surface area than AB, which was subjected to a temperature of 600 °C during the pyrolysis procedure.
The microscopy images of MB and AB showed greater porosity of the surfaces, relative to the TAN and EH precursors (Figures 2 and 3), which should favor pesticide removal.2 Fragments of inorganic material could be seen
in the image of MB, due to the magnetization process that generated iron oxide on the surface.
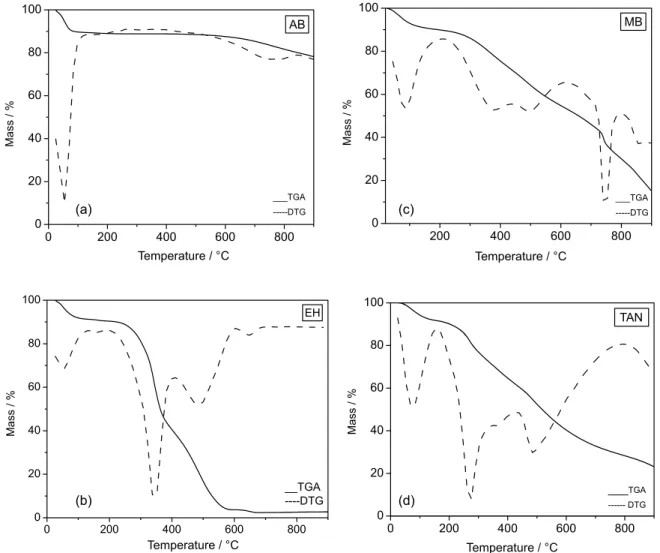
Thermogravimetric analysis (TGA)
The thermal behaviors of the pyrolyzed materials are shown in Figure 4. Mass loss in the region up to 100 °C was due to the removal of adsorbed free water, corresponding to about 5-10% of the total mass in all cases.
The thermal behavior of lignocellulosic materials during the pyrolysis process is associated with the decomposition of cellulose, hemicellulose, and lignin. Hemicellulose pyrolysis products include non-condensable gases (CO, CO2, H2, and CH4), low molecular weight compounds
(carboxylic acids, aldehydes, alkanes, and ethers), and water.25
An intense decomposition peak in the region 200-400 °C was observed for the TAN precursor material used to produce MB, which could be attributed to the decomposition of polyphenolic compounds. The production of MB using a pyrolysis temperature of 400 °C would therefore lead to decomposition of these compounds. The EH parent material showed a large mass loss peak at 300-400 °C, corresponding to the decomposition of cellulose, which was not observed for the AB biochar. This indicated that the cellulose had been degraded in the pyrolysis.15,25
Figure 3. Scanning electron microscopy images amplified (left column) 100 times and (right column) 500 times of the (A) raw material (TAN) and (B) magnetized biochar (MB).
which was only observed for MB, was attributed to the loss of lignin.
Riegel et al.27 evaluated the use of different heating
rates for pyrolysis of black wattle cultivated in Rio Grande do Sul. It was concluded that lignin degradation across a broad temperature range could lead to the non-appearance or overlapping of peaks during pyrolysis of the cellulosic material. In the case of decomposition of lignin at higher heating rates, the detection of only mild decreases in mass as the temperature was increased was probably due to the concomitant release of other products.
According to Magalhães et al.28 the mass losses
observed at around 360 and 750 °C for MB could be explained by the reduction of magnetite Fe3+ to Fe2+
by the biochar, as observed in the infrared spectrum bands corresponding to the Fe−O bond, following the reactions:
CnHnO → C + volatiles (COx, H2O, organics) (1)
Fe3O4 + nC → 3FeO + nCOx (2)
Elemental analysis
The carbon, hydrogen, and nitrogen contents of the biochars (AB and MB) and the raw materials (EH and TAN) are given in Table 2. The materials obtained after the pyrolysis and activation processes showed higher amounts of carbon and lower hydrogen contents, due to the cleavage and breaking of weak bonds as the temperature was increased. This resulted in the formation of aromatic products with lower hydrogen contents.15,25
It has been reported previously that stable or increased nitrogen contents can result from the incorporation of N in complex structures that are resistant to heat and not easily volatilized.29
Determination of surface area
The BET surface areas of the biochars were 1259 m2 g-1
for AB and 1719 m2 g-1 for MB. These values were
considerably higher than values reported elsewhere. The biochar produced and characterized by Ghani et al.25
the pyrolysis. Peterson et al.30 determined the surface area
of biochar produced from corn straw and achieved an increase from 60 to 194 m2 g-1 after optimizing the grinding
conditions. Angin et al.31 were able to increase the surface
area of biochar produced from safflower from 619.8 to 801.5 m2 g-1 by altering the proportion of the activating
agent (ZnCl2), while changing the pyrolysis temperature
from 600 to 900 °C increased the surface area from 249.3 to 801.5 m2 g-1.
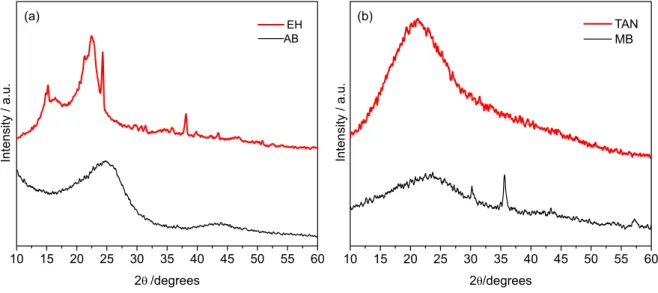
X-ray diffraction
The XRD patterns obtained for the biochars and the raw materials are shown in Figure 5. The EH parent material used to produce AB presented a degree of crystallinity, with small peaks at 2θ of 24.3° and 38.2°, not attributed to known structure. Those peaks were absent after the pyrolysis and activation process that resulted in formation of an amorphous material, as shown by the XRD pattern of AB.15
TAN showed amorphous characteristics, while the MB biochar produced from it presented three characteristic peaks of the iron oxide phase of the magnetite present in the material, with 2θ values of 30.3°, 35.6° and 57.2°. Similar results were reported by Magalhães et al.,28 using
the same technique for the characterization of tar/iron oxide
composites. The XRD patterns of composites with pitch/ iron oxide ratios of 1:1, 2:1, and 4:1, treated at 400 °C, showed diffraction peaks at 2θ of 18.3°, 30.3°, 35.4°, 37.1°, 42.9°, 53.6°, 56.9°, 62.7°, 71.3°, 74.1°, and 79.1° (JCPDS file No. 19-0629), which confirmed the presence of magnetite.
Therefore, the XRD results supported the findings of the infrared and thermal analyses, with the presence of iron oxide due to the magnetization of the biochar produced from tannins using magnetite.
Pesticides adsorption study
Initially, the analytical curves for both pesticides to quantifies them in the samples were obtained, which showed the equations y = 55631.2 + 96192x and y = 417180.7 + 109469.4x with linearity coefficient values R2 = 0.999 and 0.993 for TMX and TCL, respectively.
The limits of detection (LOD) and quantification (LOQ) for the TMX and TCL pesticides were calculated based on the parameters of the calibration curve, being the most statistically reliable method.32 Thus, LOD and LOQ were
calculated according to the equations:
LOD = 3.3 × s/S (3)
LOQ = 10 × s/S (4)
where s is the standard deviation of the blank, estimated by the background solution and S is the slope of the calibration curve. Thus, for TMX, the LOD and LOQ were 0.38 and
1.14 mg L-1, respectively. For TCL, the LOD and LOQ
were 0.15 and 0.46 mg L-1, respectively.
The amounts of pesticides adsorbed by the biochars were determined from the difference between the initial
Table 2. Contents of C, H, and N in the AB and MB biochars and their precursors, EH and TAN
Material C / % H / % N / %
TAN 50.65 5.39 0.39
MB 58.61 4.18 0.40
EH 48.08 6.64 1.49
AB 57.73 4.12 2.46
and final concentrations of the pesticides in the solutions, using the equation:
(5)
where q is the adsorption capacity (mg of pesticide per g of biochar), C0 is the initial pesticide concentration (mg L-1),
C is the final pesticide concentration after contact with the adsorbent (mg L-1), v is the volume of the solution used
in the adsorption experiment (L), and m is the weight of biochar used (g).33 A typical chromatogram of the pesticides
is shown in Figure 6.
The percentage of removal (R) of the pesticides from the water was calculated using equation 6, where C0 is the initial
concentration of the pesticide and Cf is the concentration
after the contact with the adsorbent.7
(6)
The values of q and the removal percentages of TCL and TMX obtained using adsorbents AB and MB are given in Table 3.
Figure 7 shows the kinetics of adsorption of the pesticides by the adsorbents during a total period of 400 min. It can be seen that the rates of adsorption achieved with AB were much higher than those found with MB as adsorbent. As a result, the time to equilibrium using AB was always shorter than the one using MB.
It is clear from Figure 7 that the amounts of pesticides adsorbed at equilibrium were much higher for AB, compared to MB. Using AB as adsorbent, values of q = 1.02 and 0.90 mg g-1 were obtained for TCL and TMX, Figure 6. Chromatogram of a pesticide standard, thiamethoxam (TMX)
and thiacloprid (TCL) containing 10 mg L-1 of TMX and TCL, using
gradient elution with an acetonitrile/water mobile phase. The wavelengths were 254 and 242 nm for TMX and TCL, respectively.
Table 3. Adsorption capacities (q) and removal rates (R) in ultrapure waters for the pesticides TMX and TCL, using AB and MB as adsorbents
AB MB
q / (mg g-1) R / % q / (mg g-1) R / %
TMX 0.903 ± 0.001 99.0 0.402 ± 0.001 42.2 TCL 1.020 ± 0.001 99.7 0.737 ± 0.01 72.4
respectively. When MB was used as adsorbent, lower adsorption capacities were obtained (q = 0.73 mg g-1 for
TCL and q = 0.40 mg g-1 for TMX). The adsorption capacity
therefore showed opposite behavior to the biochar surface area. As discussed in Determination of surface area section, MB had a greater surface area, compared to AB (values of 1719 and 1259 m2 g-1, respectively), resulting in greater
distribution of the functional groups able to interact easily with the pesticide molecules, which would be expected to lead to higher values of q.
The greater surface area of MB might have been related to a contribution of the pores in the magnetite iron oxide phase obtained by chemical co-precipitation and pyrolysis, present on the surface of the biochar. However, this would not help to increase the adsorption capacity for the pesticides, because occupation of the adsorption sites by the iron oxide would prevent adsorbent-adsorbate interactions. However we are also inclined to accept that the principal mode of interactions between the pesticides and the AB biochar are via pi interaction, of the structure AB and the other side the unsaturated bonds existing in the both pesticides structures. As can be seen in the IR analysis AB have higher intensities in the band 1593 cm-1,
which is aromatic, while MB is more intense OH band, polar groups. Besides that, another determining factor in the adsorption of pesticides is the constant octanol/ water partition for thiamethoxam (log Kow = −0.13) and thiacloprid (log Kow = 1.26) pesticides, these indicate that thiamethoxam has higher solubility in water than thiacloprid which justifies the smaller adsorption capacity values obtained using both biochars.
The faster attainment of equilibrium (in 15 min) and higher adsorption capacity obtained using AB as adsorbent, for the pesticide concentrations studied, suggest high availability of pores and external surface groups that could be rapidly occupied, facilitating the interactions between AB and the TCL and TMX molecules.
According to Liu et al.34 a high carbon content shown
by elemental analysis may indicate high aromaticity and, consequently, high hydrophobicity of the biochar, which would influence the adsorption process. However, as can
be seen from Table 1, despite high aromaticity of the biochars and the existence of polar groups in the pesticide structures, high removal percentages were obtained, suggesting that the aromatic groups on the surface did not strongly influence the capacity of AB and MB to adsorb TCL and TMX. The high surface area of AB, together with the absence of surface zinc ions able to block adsorption sites (as shown by X-ray diffraction, Figure 5), could have contributed to the high values of q.
Various kinetic models can be used to assist in understanding the mechanisms of adsorption.35 In the
present case, the extensively applied pseudo-first order and pseudo-second order models were used to reproduce the kinetics of the experimental adsorption of the pesticides by the biochars. These models can be represented by equations 7 and 8, respectively:
(7)
(8)
where qe and qt are the amounts of adsorbate adsorbed at
equilibrium and time t (min), respectively, and k1 (min-1)
and k2 (g min-1 mg-1) are the first order and second order
rate constants, respectively. The fitting of these simplified kinetic models employed the Levenberg-Marquardt method of optimization, with minimization of the sum of squared differences between the measured and calculated values of qt.
As can be seen in Table 4, for all the cases examined, the coefficients of determination obtained using equation 7 to describe the adsorption kinetics were always lower than those obtained with equation 8. The closer agreement between the experimental and computed qt values obtained
with equation 8 can be seen in Figure 7, confirming that the pseudo-second order kinetic model provided the best explanation of the processes of adsorption of the pesticides by the biochars. According to this model, the adsorption rate was more dependent on the availability of adsorption sites on the adsorbent surface than on the concentration of the pesticides in the aqueous solution.36
Table 4. Parameters of the pseudo-first order and pseudo-second order models for adsorption of the TMX and TCL pesticides using AB and MB as adsorbents
Pseudo-first order Pseudo-second order
qe k1 R2 qe k2 R2
AB TMX 0.894 0.373 0.997 0.923 1.120 0.999
TCL 0.994 0.586 0.996 1.012 2.287 0.999
MB TMX 0.346 0.062 0.875 0.374 0.238 0.942
Desorption studies
Desorption of the pesticides was investigated in order to assess the possibility of reusing the biochars. As shown in Table 5, AB strongly retained the pesticides throughout the trial period, with no significant amounts found in the supernatants after desorption using heated water. MB also showed only small desorption percentages for both procedures used. Other techniques that could be tested for removal of the pesticides from the biochars include the use of different solvents and/or different biochar/solvent ratios, as well as longer process times. In addition, prior to reuse it would be necessary to determine any changes in the properties of the biochars.
Pesticide adsorption using reservoir water
The main inorganic species and their mean concentrations in the Marcela reservoir water were: Cl−
(111.4 mg L-1), Br− (4.6 mg L-1), SO
42
−
(36 mg L-1), NO 3
−
(5.3 mg L-1), PO 43
−
(2.1 mg L-1), Ca2+ (29.3 mg L-1), Mg2+ (30.4 mg L-1), Na+
(124.2 mg L-1), K+ (18.2 mg L-1), and Li+ (< 0.1 mg L-1). The
pH was 6.3, the electrical conductivity was 986.4 µS cm-1,
and the total organic carbon content (TOC) was 19.8 mg L-1.
The TMX and TCL pesticides were not detected in the Marcela reservoir water because of the concentration below LOD and LOQ (Figure 8).
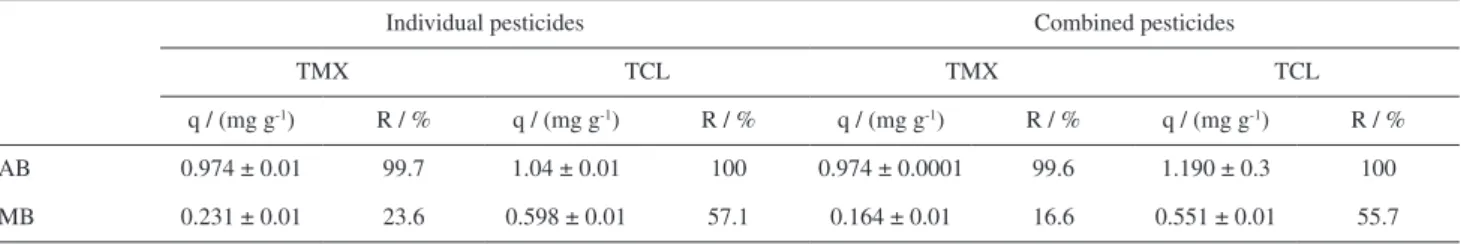
When MB was used, the adsorption capacities for TCL and TMX showed an influence of the components present
Figure 8. Chromatogram of Marcela reservoir water, using gradient elution with an acetonitrile/water mobile phase. The wavelengths were (a) 254 nm (red line) and (b) 242 nm (black line) for TMX and TCL, respectively.
Table 5. Adsorption and desorption percentages for the TMX and TCL pesticides in ultrapure waters using biochars AB and MB
Adsorption / % Desorptiona / % Adsorption / % Desorptionb / %
TMX TCL TMX TCL TMX TCL TMX TCL
AB 97.3 100 6.5 5.5 97.0 100 0 0
MB 46.7 48.0 7.2 4.0 49.0 45.4 4.2 0.4
aAcetonitrile/H
2O (1:10); bhot water (50 °C).
in the water, with values of q decreasing by 0.14 and 0.17 mg g-1 for TCL and TMX, respectively, compared to
the adsorption capacities obtained using ultrapure water, corresponding to decreases in removal of 15.3 and 18.6% (Table 6). These decreases could be attributed to the presence of different ions and natural or anthropogenic organic matter present in the water of the reservoir, which competed for the adsorption sites and hindered removal of the pesticides.
When AB was used as adsorbent, the pesticide removal rates from the reservoir water were similar to those obtained for ultrapure water, showing that despite the high availability of ions and organic matter in the aqueous medium. For this material, using TCL, the final concentrations were below the limit of detection and quantification, so the removal attributed was 100%.
As shown in Table 6, with the exception of adsorption in MB of the combined TMX pesticide, there was no change in the AB adsorption capacity when the pesticides were evaluated simultaneously in the reservoir water, suggesting an absence of competition between TCL and TMX for the active adsorption sites present in this biochar, with migration of pesticide molecules to more internal adsorption sites.
and a high concentration of organic matter increasing the occupation of adsorption sites present on the MB surface, which was already partially blocked by magnetite iron oxides. The greater decrease for removal of TMX could have been associated with steric effects, because this pesticide has a higher molecular weight, compared to TCL. This was likely to have led to a greater difficulty in diffusion of TMX molecules into deeper pores in MB, which, together with the occupation of sites by the organic and inorganic constituents of the reservoir water, resulted in smaller values of q.
Conclusions
The techniques used for characterization enabled the evaluation of the presence in biochars AB and MB of compounds from the parent biomasses (EH and TAN). The pyrolysis processes resulted in losses of several major constituents. In addition, the use of FTIR, XRD, and TGA analyses confirmed the magnetization of MB.
The biochars were effective in removing the pesticides thiacloprid and thiamethoxam from ultrapure water, and the pseudo-second order model was able to satisfactorily describe the kinetics of adsorption of the pesticides. Attempts to desorb the pesticides adsorbed on the biochars resulted in low desorption. This indicated the existence of strong interactions and the need for further studies of the properties of the adsorbents. In evaluation of the adsorption of the same pesticides using water from the Marcela reservoir, the results obtained with AB were similar to those using ultrapure water. However, in the case of MB, decreased adsorption capacity was probably due to the effect of the matrix, since the water contained multiple ions and a high concentration of organic matter. Even with a lower adsorption capacity of MB compared to AB, the importance of the magnetic particles (MB) application promise an alternatives method for use in environmental remediation strategies as they can be removed when exposed to an external magnetic field.
From a practical point of view, the findings demonstrate the feasibility of using the waste (exhausted husk) from
an industrial process, as well as providing an additional application for the tannins extracted in the same process, as an alternative technique for the removal of pesticides from polluted waters.
Acknowledgments
Financial support for this work was provided by CAPES and CNPq. The authors thank Tanac S.A. for provision of the raw materials used to produce the biochars.
References
1. Baird, C.; Química Ambiental; Editora Bookman: Porto Alegre, 2002.
2. Tang, J.; Zhu, W.; Kookana, R.; Katamaya, A.; J. Biosci. Bioeng.
2013, 116, 1.
3. Júnior, R. P. S.; Rigitano, R. L. O.; Rev. Bras. Eng. Agríc Ambient.2012, 16, 564.
4. Campo, J.; Masiá, A.; Blasco, C.; Picó, Y.; J. Hazard. Mater.
2013, 263, 146.
5. Vanloon, G. W.; Duffy, S. J.; Environmental Chemistry: A Global Perspective; Oxford University Press: New York, USA, 2000.
6. Ceballos, B. S. O.; Lima, E. O.; Konig, A.; Martins, M. T.; Rev. Microbiol.1995, 26, 90.
7. US EPA, Chemicals Evaluated for Carcinogenic Potential; National Pesticides Information Center (NPIC), Annual Cancer Report, USA, 2016. Available at http://npic.orst.edu/ chemicals_evaluated.pdf, accessed on February 2017. 8. Ioannidou, O. A.; Zabaniotou, A. A.; Stavropoulos, G. G.; Islam,
M. A.; Albanis, T. A.; Chemosphere2010, 80, 1328.
9. Bhattacharya, A. K.; Naiya, T. K.; Mandal, S. N.; Das, S. K.;
Chem. Eng. J.2008, 137, 529.
10. Rojas, R.; Vanderlinden, E.; Morillo, J.; Usero, J.; Bakouri, H. E.; Sci. Total Environ.2014, 124, 488.
11. Machado, A. A. S. C.; Quim. Nova2012, 35, 1250.
12. Rutherford, D. W.; Wershaw, R. L.; Rostad, C. E.; Kelly, C. N.;
Biomass Bioenergy2012, 46, 693.
13. Mangrich, A. S.; Doumer, M. E.; Mallmann, A. S.; Wolf, C. R.;
Rev. Virtual Quim.2014, 6, 2.
Table 6. Adsorption capacities (q) and removal rates (R) of the Marcela Water Reservoir fortified with TMX and TCL pesticides using AB and MB as adsorbents
Individual pesticides Combined pesticides
TMX TCL TMX TCL
q / (mg g-1) R / % q / (mg g-1) R / % q / (mg g-1) R / % q / (mg g-1) R / %
AB 0.974 ± 0.01 99.7 1.04 ± 0.01 100 0.974 ± 0.0001 99.6 1.190 ± 0.3 100
14. Peres, R. S.; Armelin, E.; Alemán, C.; Ferreira, C. A.; Ind. Crops Prod.2015, 65, 506.
15. Kim, K. H.; Kim, J. Y.; Cho, T. S.; Choi, J. W.; Bioresour. Technol.2012, 118, 158.
16. Werlang, E. B.; Schneider, R. C. S.; Rodriguez, A. L.; Niedersberg, C.; Rev. JovensPesquisadores2013, 3, 156. 17. Azargohar, R.; Dalai, A. K.; Appl. Biochem. Biotechnol.2006,
131, 762.
18. Khan, M. Y.; Mangrich, A. S.; Schultz, J.; Grasel, F. S.; Mattoso, N.; Mosca, D. H.; J.Anal. Appl. Pyrolysis2015, 116, 42. 19. Chen, B.; Chen, Z.; Lv, S.; Bioresour. Technol.2011, 102, 716. 20. Administração Estadual do Meio Ambiente (ADEMA),
Analysis Report on Marcela Water Reservoir in Itabaiana,
Análise Físico-Química e Bacteriológica, Control No. 393/15, November 2015.
21. Ahmed, M. J.; Theydan, S. K.; Powder Technol. 2012, 229, 237. 22. Matos, T. T. S.; Jesus, A. M. D.; Araújo, B. R.; Romão, L. P. C.;
Santos, L. O.; Santos, J. M.; Rev. Virtual Quim.2013, 5, 840. 23. Xu, G.; Sun, J.; Shao, H.; Chang, S. X.; Ecol. Eng.2014, 62,
54.
24. Chia, C. H.; Gong, B.; Joseph, S. D.; Marjo, C. E.; Munroe, P.; Rich, A. M.; Vib.Spectrosc.2012, 62, 248.
25. Ghani, W. A. W. A. K.; Mohd, A.; Silva, G.; Bachmann, R. T.; Taufiq-Yap, Y. H.; Rashid, U.; Al-Muhtaseb, A. H.; Ind. Crops Prod.2013, 44, 18.
26. Souza, B. S.; Moreira, A. P. D.; Teixeira, A. M. R. F.; J. Therm. Anal. Calorim.2009, 97, 637.
27. Riegel, I.; Moura, A. B. D.; Morisso, F. D. P.; Mello, F. S.; Rev. Arvore2008, 32, 533.
28. Magalhães, F.; Pereira, M. C.; Fabris, J. D.; Bottrel, S. E. C.; Sansiviero, M. T. C.; Amaya, A.; Tancredi, N.; Lago, R. M.;
J. Hazard. Mater.2009, 165, 1016.
29. Mohammad, A.; Abdulrasoul, A.; Ahmed, H. E.; Mahmoud, N.; Adel, R. A. U.; Bioresour. Technol.2013, 131, 374. 30. Peterson, S. C.; Jackson, A. M.; Kim, S.; Palmquist, E. D.;
Powder Technol.2012, 228, 115.
31. Angin, D.; Altintig, E.; Kose, T. E.; Bioresour. Technol.2013,
148, 542.
32. Ribani, M.; Bottoli, C. B. G.; Collins, C. H.; Jardim, I. C. S. F.; Melo, L. F. C.; Quim. Nova2004, 27, 771.
33. Jesus, A. M. D.; Romão, L. P. C.; Araújo, B. R.; Costa, A. S.; Marques, J. J.; Desalination2011, 274, 13.
34. Liu, N.; Charrua, A. B.; Weng, C. H.; Yuan, X.; Ding, F.;
Bioresour. Technol.2015, 198, 55.
35. Febrianto, J.; Kosasih, A. N.; Sunarso, J.; Ju, Y.; Indraswati, N.; Ismadji, S.; J. Hazard.Mater.2009, 162, 616.
36. Salman, J. M.; Njoku, V. O.; Hameed, B. H.; Chem. Eng. J.
2011, 174, 41.
Submitted: October 27, 2016