www.ann-geophys.net/24/1725/2006/ © European Geosciences Union 2006
Annales
Geophysicae
Electron velocity distribution and lion roars in the magnetosheath
W. Masood1,2,3, S. J. Schwartz4, M. Maksimovic5, and A. N. Fazakerley6
1Astronomy Unit, Queen Mary, University of London, UK 2Government College University (GCU), Lahore, Pakistan 3PRD, PINSTECH, P.O.Nilore, Islamabad, Pakistan 4The Blackett Laboratory, Imperial College London, UK 5DESPA, Observatoire de Paris, France
6Mullard Space Science Laboratory, University College London, UK
Received: 10 October 2005 – Revised: 15 May 2006 – Accepted: 19 May 2006 – Published: 3 July 2006
Abstract. Whistler waves which are termed “lion roars” in the magnetosheath are studied using data obtained by the Spectrum Analyser (SA) of the Spatio-Temporal Analysis of Field Fluctuations (STAFF) experiment aboard Cluster. Kinetic theory is then employed to obtain the theoretical expression for the whistler wave with electron temperature anisotropy which is believed to trigger lion roars in the mag-netosheath. This allows us to compare theory and data. This paper for the first time studies the details of the electron ve-locity distribution function as measured by the Plasma Elec-tron And Current Experiment (PEACE) in order to investi-gate the underlying causes for the different types of lion roars found in the data. Our results show that while some instances of lion roars could be locally generated, the source of others must be more remote regions of the magnetosheath.
Keywords. Ionosphere (Wave particle interactions) – Mag-netospheric physics (Magnetosheath; Plasma waves and in-stabilities)
1 Introduction
The magnetospheric cavity bounded by the magnetopause is formed as a result of the interaction of the super-magnetosonic solar wind flow with the obstacle of the Earth’s magnetic field. The region between the bow shock, which forms upstream, and the magnetopause is known as the mag-netosheath. In this region, we find shocked solar wind ma-terial. Since it is the magnetosheath that ultimately deliv-ers the shocked solar wind plasma to the magnetosphere, it is a matter of prime importance to understand the processes that take place in the magnetosheath. A characteristic feature of magnetosheath is the existence of narrowband, whistler mode electromagnetic waves termed as “lion roars” and it is Correspondence to:W. Masood
these lion roars that are the subject of investigation in this paper. Much is known about the lion roars:
– Lion roars are intense bursts of electromagnetic waves and are a characteristic feature of the magnetosheath (Smith et al., 1969; Tsurutani et al., 1982; Smith and Tsurutani, 1976).
– Lion roars are extremely low frequency emissions, are narrow-banded with center frequencies near 100 Hz, and are sporadic in occurrence. When played through a loudspeaker, their low frequency and amplitude-time characteristics cause them to sound like a roaring lion, hence the name (Smith and Tsurutani, 1976).
– Lion roars are the strongest whistler mode signals found in the magnetosheath (Smith and Tsurutani, 1976). – Lion roars are identified as right hand circularly
po-larized whistler waves that propagate nearly parallel (<15◦) to the ambient magnetic field (Smith and Tsu-rutani, 1976).
– Lion roars are also observed to be quasi-periodic, with a typical time interval of∼20 s between bursts (Tsurutani et al., 1982).
– On the basis of ISEE satellite observations, Thorne and Tsurutani (1981) showed that the generation of lion roars is due to an electron cyclotron instability that is caused by the presence of anisotropic magnetosheath electrons (T⊥e6=Tke). Smith et al. (1969) and
Tsuru-tani et al. (1982) found a strong correlation between the occurrence of the lion roars and the regions of the weak ambient magnetosheath magnetic field, which are asso-ciated with the magnetosheath mirror waves.
by IMP 6 and related to the quasi-perpendicular type of the bow shocks. These are known as long duration whistler waves (Rodriguez, 1985).
– Lee et al. (1987) proposed a theoretical model for the electron distributions associated with the mirror waves. They found that the electron temperature anisotropy is always higher in the low field region than that in the high field region.
– Zhang et al. (1998) divided the lion roars into types A, B, and C. They found only thirty percent of the lion roars (Type A) to be related to a dip in the magnetic field while the types B and C didn’t show any correla-tion between the occurrence of lion roars and the ambi-ent magnetic field. They also discussed the issue of lo-cal and non-lolo-cal sources of lion roars i.e., whether they are generated by the local plasma conditions or propa-gate from a more remote region.
– Chisham et al. (1998) studied the behavior of the elec-tron distribution function within mirror mode waves in the Earth’s magnetosheath using observations made by the electron experiment on Active Magnetospheric Particle Tracer Explorers United Kingdom Subsatel-lite (AMPTE UKS). The results showed that in the mirror mode troughs the electron distribution displays two distinct features related to particle trapping: (1) The “deeply” trapped electrons (those with pitch angles close to 90◦ in the magnetic field troughs) are signifi-cantly cooled with respect to the rest of the electron pop-ulation and (2) the “shallowly” trapped electrons (those with pitch angles just greater than the critical pitch an-gle for trapping) are significantly heated with respect to the rest of the electron population.
– Baumjohann et al. (1999) used the high resolution data from Equator-S magnetometer and found that wave vec-tors of lion roars are almost aligned with the background magnetic field (<1.5◦) consistent with the earlier
stud-ies (Smith and Tsurutani, 1976; Tsurutani et al., 1982) where the propagation angle was found to be≈<15◦.
– Spatio-Temporal Analysis of Field Fluctuations (STAFF) (Cornilleau-Wehrlin et al., 1997) was used by Maksimovic et al. (2001) to determine the location of source region and characteristics of magnetosheath lion roars. They found some lion roars that propagated in opposite directions simultaneously, consistent with the results of Zhang et al. (1998). In addition, they found lion roars propagating at angles of 30◦–50◦with respect to the ambient magnetic field, which is inconsis-tent with whistler mode waves which are normally very heavily Landau damped in a bi-Maxwellian plasma for oblique propagation with respect to the background magnetic field. It should, however, be noticed that
the time resolution of Cluster measurements is con-siderably lower than that of Equator-S measurements and, therefore, the direction finding is less accurate for Cluster measurements than for Equator-S as discussed by Baumjohann et al. (1999).
A vast majority of work in the recent past has been focused on the observational aspects of lion roars but no attempt has been made to explain the different features of the lion roars observed in the data in the light of theoretical results. This paper attempts to compare the properties of the lion roars found in the data with the theoretical predictions. We have organised the paper in the following way: In the next sec-tion we derive expressions for the frequency and growth rate of lion roars employing kinetic theory of plasmas. We also state the condition for the first order resonant wave particle interaction. In Sect. 3 we briefly describe the Cluster mission and discuss how we obtained the data for the various plasma parameters. In Sect. 4, we present our results and in Sect. 5 we discuss the results obtained in detail. Finally, in the con-clusion we summarise our results, delineate the limitations of our study and also discuss possible future courses of action.
2 Kinetic treatment for the whistler waves with electron temperature anisotropy
2.1 Dispersion relation and growth rate
Whistler waves with electron temperature anisotropy can be obtained from the dielectric tensor of a bi-Maxwellian (i.e.
T⊥e6=Tke) plasma written for the modes parallel to ambient
magnetic fieldB0(i.e.kkB0). Plasma kinetic theory is em-ployed to derive the result under the assumption that the ion contribution can be ignored in the limiti<ω<|e|, where iandeare the ion and electron cycotron or
gyrofrequen-cies respectively (Stix, 1992). The three modes in this case correspond to the right circularly polarized (RCP), left circu-larly polarized (LCP) and the electrostatic mode respectively. The parallel propagating wave that we are interested in is the right circularly polarized wave corresponding to the whistler branch. The interest in these waves is triggered by the study of lion roars in the magnetosheath that are thought to be whistler waves (Smith and Tsurutani, 1976; Zhang et al., 1998). We split the dispersion relation calculated for the right circularly polarized whistler waves with electron tem-perature anisotropy into real and imaginary parts (see Gary, 1993; Baumjohann and Treumann, 1997). The real part of the dispersion relation thus obtained reads as follows:
ω= k2
kc
2 |e| ω2
pe
1+Aeβ||e 2
(1)
where ωpe is the electron plasma frequency and c is the
is defined asAe≡(T⊥e/Tke−1)and βke=nkBTke/B2/2µo.
The growth (negative if damping) rate is:
γ = − √
π ω2pe[(ω− |e|)Ae+ω]e−((ω−|e|)/ kkvke) 2
kkvke
2k2kc2
ω −
ω2 pe
|e|+ kk2vk2eω2
pe
2ω|e|3 (2Ae|e| −ω)
(2)
wherevkep2kBTke/meis the electron thermal velocity
par-allel to the magnetic field. It can be seen from Eq. (2) that the condition for the growth of instability is:
ω/|e|< Ae/(Ae+1) (3)
The ratioω/|e|and temperature anisotropyAeemerge as
the key parameters to study the whistler waves with electron temperature anisotropy.
2.2 Resonant electrons
We have calculated the energy for the resonant electrons to see where they lie in the electron velocity distribution since we are studying whistlers generated by electron cylotron res-onance. The condition for the first order resonant wave par-ticle interaction is given by
ω−kkvres− |e| =0 (4)
which gives
vres =ω− |e|
kk . (5)
We note here that forkk>0, vres is negative. To evaluate
vres, we need to establish values for ω andkk, which are
related to each other via the dispersion relation in Eq. (1). We have calculated the resonant energies by taking that value of frequency (ωobs) from the data where the majority of lion
roars are found. In this case, we have
ωobs−kkvk=
kk2c2|e| ω2
pe
1+Aeβke 2
(6)
which gives
αvc2 |e|k
2
k+vkkk−ωobs =0 (7)
where α=(1+Aeβke/2) and vc2=c2|e|2/ω2pe. Assuming
that the Doppler shiftkkvkis very small and taking only the positive root, we get
kk=
s
ωobs|e| αv2
c
(8)
The value of the Doppler shift is calculated to be≈5% of the observed frequency and, therefore, it is reasonable to drop the termkkvkin Eq. (7).
For some cases, no lion roars are seen. For these, we have assigned values ofvresfrom the suprathermal region of
elec-tron distribution function. This selection is guided by the values ofvres that are found for the cases in the data where
we see postiveAeand the corresponding lion roars.
Substi-tuting the value of frequencyωfrom Eq. (1) in Eq. (4) and solving forkk, we get:
αvc2kk2+ |e||vres|kk− |2e| =0. (9)
Asvres is a negative quantity forkk>0, therefore, we have writtenvres as−|vres|. Solving the quadratic equation, the positive root ofkkis found to be
kk= −|e||vres| + |e|
p
|vres|2+4αv2c
2αv2 c
. (10)
Substituting the value ofkkin Eq. (1) gives us the frequency of the whistler waves corresponding to the assigned value of
vres.
3 Observations from the Cluster Data
In order to look at the values of different plasma param-eters in the magnetosheath, we have made use of Cluster Data. We have used the Cluster Flux Gate Magnetometer (FGM) measurements to look at the background magnetic field. The magnetic field investigation (FGM) on Cluster provides accurate, high time-resolution, intercalibrated four-point measurements of the magnetic field vectors in the mag-netosphere and in the upstream solar wind along the Cluster orbit (Balogh et al., 1997). With the help of background mag-netic field, we can also determine the electron pitch angle ve-locity distribution and hence also the temperature anisotropy. We have used the truncated corrector electron moments (Geach et al., 2005) of the Cluster PEACE (Plasma Electron and Current Experiment) data to analyse the electron distri-bution in the magnetosheath environment. The two PEACE sensors on board each Cluster spacecraft sample the elec-tron velocity distribution across the full 4π solid angle and the energy range 0.7 ev to 26kev with a time resolution of 4 s (Johnstone et al., 1997). The reason for using the trun-cated corrector electron moments is that the moments cal-culated on-board spacecraft typically over or under-estimate the values of the ‘true’ moments, because they convolve ef-fects caused by the presence of a potential (from the space-craft itself) and lower and upper energy truncation imposed by the detector. Furthermore, the spacecraft environment in-cludes photo and secondary electrons, which can return to the spacecraft and enter the detector, therefore contaminating the measured moments (Szita et al., 2001; G´enot and Schwartz, 2004; Geach et al., 2005). Pitch angle distributions derived from the electron data are also studied.
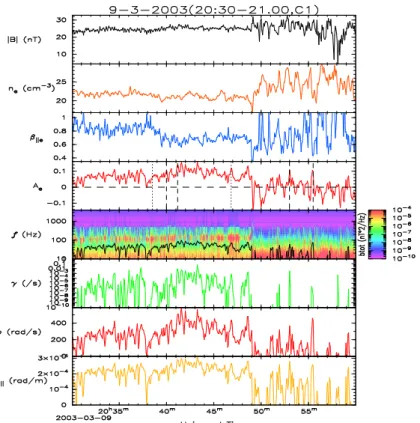
Fig. 1. From 20:30 to 21:00 UT on 9 March 2003 on Cluster 1 (C1). The top panel shows the magnitude of the magnetic field for the selected interval. The second, third, and fourth panels show the values of number density,βke, and electron temperature anisotropy,Ae,
respectively. The fifth panel shows the frequency spectrum of the lion roars as observed from the STAFF data. The solid black line in the same panel reflects the theoretically estimated value of the lion roar frequency for the same times. The last three panels show the theoretical estimates of the growth rate, frequency, and the parallel wave vector respectively at maximum growth. The dashed lines in theAepanel
indicate times when we see positive electron temperature anisotropy but no lion roars whereas the dotted lines correspond to selected times with simultaneous positiveAeand lion roars.
Spatio-Temporal Analysis of Field Fluctuations (STAFF) ex-periment aboard Cluster. STAFF-SA calculates, in near real time, the complete auto and cross-spectral matrix derived from three magnetic and two electric field components of the electromagnetic field at 27 frequencies in the range of 8 Hz to 4 kHz (Cornilleau-Wehrlin et al., 1997).
We have studied a dozen cases in the STAFF data to anal-yse lion roars in the magnetosheath from which we have cho-sen three to discuss in detail (see Results section below). The selected three intervals encapsulate all the features that are found in the different cases and, therefore, are representa-tive of the larger data set used to investigate lion roars in the magnetosheath.
4 Results
4.1 Plasma and wave conditions
Figures 1, 2 and 3 show the plasma parameters for three se-lected time intervals to study lion roars. The top panel in
each figure shows the behavior of ambient magnetic field. Electron number densityne,βke, and temperature anisotropy Aeare plotted in the second, third, and fourth panels retively. The fifth panel shows the magnetic power time spec-tral density plots obtained from the STAFF data. The val-ues of the background magnetic field, density, parallel and perpendicular temperatures (Tke andT⊥ewith respect to the
background magnetic field) for the selected intervals have been taken from FGM and truncated corrector PEACE mo-ments data, respectively.
The theoretical estimates of frequencyω, growth rateγ, and parallel wave vectorkkare calculated by substituting the values of the background magnetic field, density, parallel and perpendicular temperatures (TkeandT⊥e) obtained from data
in the theoretically determined expressions for dispersion re-lation and the growth rate for whistler waves with electron temperature anisotropy (Eqs. 1 and 2). We calculate the val-ues of frequencyω, growth rateγ, and parallel wave vector
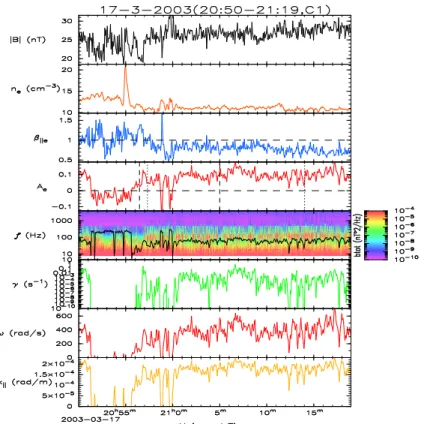
Fig. 2.From 20:50 to 21:19 UT on 17 March 2003 on C1. Format as in Fig. 1.
met. These values are shown in the last three panels. Those values in the data that correspond toAe<0 are excluded from
the calculations as these conditions are stable against all pos-sible whistler modes.
The theoretical estimate of the frequency (in Hz) of the fluctuating magnetic field is plotted in the fifth panel along with STAFF plot for the frequency obtained from the data so that comparison be made between the two values.
The chosen three intervals from 9 March 2003, 17 March 2003, and 10 April 2003 highlight the different features prevalent in the larger data set. We have considered here three categories: 1) positive electron temperature anisotropy but no lion roars; 2) positive electron temperature anisotropy and corresponding lion roars; 3) lion roars but no positive electron temperature anisotropy.
Figure 1 reflects the case that is encountered most fre-quently in all the data sets used to study lion roars in the magnetosheath. The electron temperature anisotropyAe is
positive for most of the time on 9 March 2003. The insta-bility criterion (Eq. 3) is satisfied but we need to look at the values of growth rate to determine whether instability can proceed fast enough to generate the observed waves locally. The growth rates for the selected interval are shown in the sixth panel. We present here a simple analysis to determine whether these growth rates are fast enough to generate lion roars. It takes≈3 min for the shocked solar wind to traverse
the distance between bow shock and magnetopause for a typ-ical downstream solar wind velocity of 100 km/s and a mag-netosheath thickness of 3RE, whereREis the radius of the
Earth. This means that we would expect to observe lion roars in the magnetosheath only if the whistler waves grow in a time which is faster than 3 min. The fastest values of growth rate observed in Fig. 1 correspond to a growth time of the order of 1000 s or 17 min, though we observe the lion roars throughout the time interval under consideration. The small values of growth rate may only indicate the fact that the wave growth began sometime in the past and not at the time when we observed them and that the plasma has relaxed to a less unstable configuration. Alternatively it may be that the lion roars observed in the data come from a remote region and are not generated by the local plasma parameters at all. It should be noted that the calculated growth rates are positive (though very small). Therefore, the waves are not damped but sitting in the magnetosheath in an almost marginally stable state.
Despite the positive electron temperature anisotropy throughout the interval, there are times, for instance (20:40:00, 20:41:11, and 20:53:00 UT) when we don’t see any lion roars. The growth rates calculated for these times do not differ significantly from those where see the simulta-neous presence of lion roars and positiveAe.
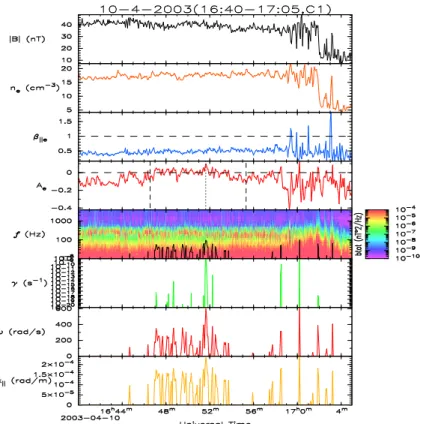
Fig. 3.From 16:40 to 17:05 UT on 10 April 2003 on C1. Format as in Fig. 1.
is roughly a factor ≈2 less than the one observed in the data. We shall talk more about this underestimation in the Discussion section.
Figure 2 shows a much better agreement between local theory and data than Fig. 1. The theoretical estimate of the frequency of the lion roars is closer to, but still less than, the observed one (see panel 5 of Fig. 2). The regions where we see positiveAe correspond to lion roars in the STAFF
plots and their absence correspond to the negative Ae
val-ues. The fastest growth rate corresponds to a time of 10 s which indicates that the whistler waves are probably gener-ated locally. As was the case in Fig. 1, we also encounter here times (20:56:28 and 21:05:00 UT) when we see positiveAe
but no corresponding lion roars in the data (see Discussion section). The growth rates corresponding to these times do not differ significantly from those observed where positive
Aeand lion roars are seen simultaneously. The fact that the
agreement between the observed and theoretically predicted frequencies improves significantly in the presence of faster wave growth rates support the view that the lion roars are lo-cally generated there whereas the ones in Fig. 1 come from a remote region and are not generated by the local plasma con-ditions. However, there is still no clue for those instances in the data where no lion roars are seen corresponding to posi-tiveAevalues even when the growth rate would be expected
to be appreciable. We shall explore this anomaly further in the Discussion section.
Figure 3 vividly reflects the third category found in the data where we see lion roars throughout the day but very sel-dom the positiveAe. Even when we do see positiveAe, it
is very small. We shall explore the reasons for these ob-servations in the Discussion section as well. The theoreti-cal estimate of the lion roar frequency is poorest in this case and owing to negativeAevalues, we find almost no growth for the whistler instability throughout the selected interval. When we do find wave growth, it corresponds to a growth time of 108s which indicates that lion roars seen in this in-terval come from a remote source. The comparison of growth rates in Figs. 1 and 3 suggests that the source of lion roars in Fig. 1 is intermediate between local and remote whereas it lies in a remote region in case of Fig. 3.
The values of plasma parameters are found to be similar for the cases studied on 9 March 2003 (Fig. 1) and 17 March 2003 (Fig. 2) but differ significantly for the case studied on 10 March 2003 (Fig. 3). TheAe values are negative most
E
resa)
E
resb)
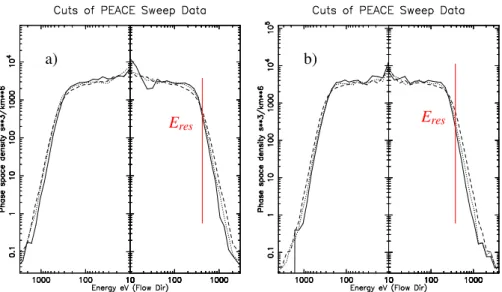
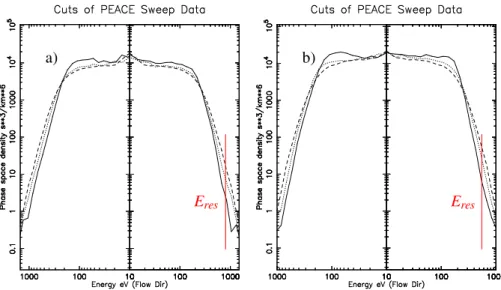
Fig. 4. (a)Electron velocity distribution from Cluster 1 (C1) at 20:47:00 UT on 9 March 2003 for the case when we find positiveAeand
corresponding lion roars in the data. The solid lines represent the cut in the parallel, dashed lines in perpendiclar, and dotted lines at 45 deg to the ambient magnetic field. The vertical line on the plot represents the resonant energy of the electrons,Eres, calculated at the same time
instant (i.e., 20:47:00 UT).(b)Electron velocity distribution from C1 at 20:55:26 UT on 9 March 2003 for the case when we see postiveAe
but no lion roars. Format as in (a).
E
resa)
E
resb)
Fig. 5. (a)Electron velocity distribution from C1 at 20:57:19 UT on 17 March 2003 for the case when we find positiveAeand corresponding
lion roars in the data.(b)Electron velocity distribution from C1 at 21:05:00 UT on 17 March 2003 for the case when we see postiveAebut
no lion roars. Format as in Fig. 4.
effect of the high magnetic field on 10 March 2003 on the de-termination of locality or non-locality (Sect. 1) of the source of lion roars shall be explored in detail in Sect. 5.
4.2 Electron velocity distributions
We have also taken cuts of the electron pitch angle distri-butions (Figs. 4–6) to characterise the electron distribution
in the intervals in which the three main categories of lion roars were observed in the data. It should be noted that we have drawn the electron velocity distribution plots for electrons having energy≥10 ev because the electrons below this energy are contaminated due to the presence of photo and secondary electrons. We want to mention here that the difference between the phase space density of 0◦ and 90◦
E
resa)
E
resb)
Fig. 6. (a)Electron velocity distribution from C1 at 16:51:38 UT on 10 April 2003 for the case when we find positiveAeand corresponding
lion roars in the data.(b)Electron velocity distribution from C1 at 16:55:19 UT on 10 April 2003 for the case when we see lion roars but no positiveAe. Format as in Fig. 4.
spacecraft C1 is found to be nearly a factor of 2. This is much greater than the variations from spin to spin, which we have estimated to be roughly 30% by comparing single spins with the 3-spin averaging used here.
Figures 4– 6 show that at lower energies (≈below 150 eV) the electron velocity distribution is broader parallel to the magnetic field by comparison to the perpendicular direction. However, the situation reverses at the higher energies to leave an overallT⊥e>Tkeanisotropy. We shall now discuss in more
detail the selected intervals of the days under consideration. Figures 4a and 4b show the electron distribution function for selected intervals on 9 March 2003 (Fig. 1). The case where we observe positive Ae≈0.14 accompanied by lion
roars in the data is shown in Fig. 4a. For lower energies in Fig. 4a, the spread in parallel electron velocity exceeds the perpendicular one. The situation reverses at the higher energies for the parallel cut in the positive magnetic field di-rection (right hand side of the plot) but on the left hand side the situation is less pronounced. In other words, the electron velocity distribution is asymmetric. Figure 4b on the other hand reflects the case when we do see positiveAe≈0.1 but no lion roars. The parallel and anti-parallel electron veloc-ity distibutions with respect to background magnetic field of Figs. 4a and 4b look similar to each other and do not seem to influence the presence or absence of lion roars.
Using Eq. (6) for the case when we see the simultaneous presence of positiveAe and lion roars in the data, the
reso-nant energy for Fig. 4a is found to be 193 eV. This is only slightly above the thermal energy, so that the phase space density is still appreciable, and falls in the band of energies where the perpendicular anisotropy is most pronounced. The values of anisotropy and phase space density should be high
near the resonant energy to obtain appreciable growth rate for lion roars and the calculated value in this case fulfills the condition.
Following the procedure described in Section 2.2 to deal with the cases where we see positiveAe and no lion roars,
we have calculated the frequency of the whistler waves cor-responding to Eres=170 eV (shown as the vertical line in
Fig. 4b), by using Eqs. (10) and (1), respectively. The cor-responding wave frequency is calculated to be 237 Hz in this case, though we don’t see any lion roars in the data at this frequency. It is important to note that there is no significant difference between the electron pitch angle distrbutions for the case when we see simultaneous presence of positiveAe
and lion roars in the data and when we do not observe lion roars corresponding to positiveAe value. We, therefore, are
unable to explain the absence of lion roars corresponding to positiveAevalue as both the theory and electron pitch angle
distributions do not give any clue about this peculiar feature of the data.
We note that for the conditions where we see lion roars (Figs. 1 and 4a) and positiveAe, the theoretically unstable waves do not extend up to the observed wave frequencies. Similarly, in the case when no lion roars are observed (Figs. 1 and 4b), our inferredEres does not correspond to unstable waves. We shall explore this discrepancy between between theory and data in more detail in the Discussion section.
Figures 5a and 5b show the electron velocity distribution plots for the selected intervals on day 17 March 2003 (Fig. 2). We see lion roars corresponding to positiveAein most of the
data, though, there are times when we see positiveAe but
Figure 5a reflects the case where we see positive Ae and
lion roars in the data. The electron velocity distribution plot shows that the spread in the parallel velocity exceeds the per-pendicular one at lower energies whereas the situation verses at higher energies as observed in Figs. 4a and 4b, re-spectively. Figure 5b shows a similar velocity distribution pattern at 0 and 180 deg as observed in Fig. 5a for the case where we see positiveAe but no lion roars. The
parallel-anti-parallel asymmetry with respect to the ambient magnetic field in the electron velocity distribution is present in both Figs. 5a and 5b though not very pronounced. The resonant energy calculated for Fig. 5a following the same procedure adopted above for the case with simultaneous postiveAeand lion roars is 423 eV and lies in that part of the electron veloc-ity distribution where there is significant amount of electron population with perpendicular anisotropy. The frequency of the lion roars corresponding toEres=400 eV and following
the procedure as described above for case with postiveAe
and no lion roars is calculated to be 219 Hz for Fig. 5b. As in Figs. 4a and 4b, the instability criterion (Eq. 3) for the growth of whistler instability is not met for the observed fre-quencies corresponding to Figs. 5a and 5b as well although the frequencies are relatively close to the theoretical expec-tations on this day.
The selected interval to study lion roars on 10 April 2003 (Fig. 3) shows that the electron temperature anisotropyAe
is either negative or very close to zero for most of the time except for a few periods where we find positiveAe, though we observe lion roars throughout in the data. Figure 6a is taken from the period that corresponds to the case where we see positiveAeand lion roars simultaneously. The
elec-tron velocity distribution plot shows that the parallel spread exceeds the perpendicular spread at lower energies whereas the situation reverses at higher energies. A slight parallel-anti-parallel asymmetry with respect to the ambient mag-netic field is present in the electron velocity distribution at lower energies (≈below 150 eV) but it is almost negligible at higher energies. The resonant energy calculated for Fig. 6a is 817 eV and belongs to that region of the electron velocity dis-tribution where the phase space density is very low, though we find lion roars in the data. As discussed earlier, the val-ues of phase space density and anisotropy should be high in order to get appreciable growth rate for lion roars and this definitely is not the case here with regard to the phase space density. This means that the lion roars seen in the data are generated elsewhere where the value of phase density was high enough to give rise to substantial growth of whistler waves. Figure 6b shows the electron velocity distribution for the case when we see lion roars but no positiveAe. Most of
the features of the electron distribution function in Fig. 6b are the same as in Fig. 6a with the exception of greater difference in the parallel and perpendicular spread at lower energies in Fig. 6b than Fig. 6a. This results in negativeAevalue as
ob-served in the data. The resonant energy calculated for Fig. 6b is≈563 eV and falls in a region where phase space density
is low and the perpendicular spread in energy exceeds the parallel spread.
The fact that lion roars are seen throughout in the data de-spite a negativeAefor most of the interval strongly suggests that these lion roars are not generated by the local plasma conditions but, instead, come from a source lying in a re-mote region. We shall discuss more about this feature of the data in the next section.
5 Discussion
One noticeable feature in Figs. 1, 2 and 3 is the difference be-tween the theoretical estimate of the lion roar frequency and the one observed in the data. The electron velocity distribu-tion plots shown here reveal a non-Maxwellian distribudistribu-tion in the magnetosheath contrary to the bi-Maxwellian distri-bution assumed to derive the theoretical expressions for the frequency and growth rate of the lion roars. This fact may explain the disagreement in the theoretical estimate and ob-served frequencies of lion roars in the data.
As shown in the results section, we have used the frequen-cies observed in the data to calculate the resonant energies for the case where we see the simultaneous presence of pos-itiveAe and lion roars. The instability criterion (Eq. 3) is
not satisfied for these observed frequencies and theory pre-dicts that we should not get wave growth from these values according to Eq. (2). The reason for this conflict between theory and observations may again be due to the fact that the observed electron velocity distributions are non-Maxwellian as opposed to the Maxwellian assumed to derive the theoreti-cal results. It may also be that the linear Vlasov theory is not adequate to explain the observed phenomenon and we need to incorporate non-linear and/or saturation effects.
The growth rates calculated from the theory offer no ex-planation for the cases where we see positiveAebut no lion roars because the values of growth rate, γ, for these cases do not significantly differ from those calculated for the cases with simultaneousAe and lion roars in the data. This fact
holds true irrespective of whether lion roars could have been generated by the local plasma conditions or propagate from a more remote region.
The electron velocity distribution plots show that the reso-nant energies lie in the suprathermal region where there is a significant electron population with perpendicular anisotropy which fulfills the condition for appreciable wave growth as described in the preceding section. Another important obser-vation is that the cuts of electron velocity distribution for the cases where we observe the simultaneous presence of posi-tiveAe and lion roars do not look different from the cases
where we find positive Ae and no lion roars. This makes
it more difficult to speculate any process or processes that might have given rise to this peculiar feature (i.e., positive
Figure 6a corresponds to one of those few times in the data on 10 March 2003 where we find positiveAe. The resonant
energy in this case is calculated to be 817 eV. The electron velocity distribution plot of Fig. 6a shows that the resonant energy lies in the region where the phase space density is very low. The fastest value of growth rate observed in this case corresponds to a growth time of 108s which suggests the impossibility of the generation of lion roars by the local plasma conditions. Moreover, the lion roars are frequently found in the data for the selected interval on this day despite the fact that the electron temperature anistropy, Ae, is pre-dominantly negative during the same time and so we would expect the waves to be heavily damped. These facts strongly suggest that these lion roars are not generated by the local plasma conditions but, instead, are coming from a remote source.
In order to shed some light on the source region, we can investigate how the resonant energy varies for a fixed fre-quency. In order to be able to transfer significant energy to the waves at substantial growth rates, the phase space den-sity and anisotropy should both be appreciable near the res-onant velocity. We expect the resonance to occur at lower (suprathermal) energies where both the phase space density and anisotropy are higher. Substituting the expression forkk
from Eq. (1), assumingω/|e|≪1, and using the value ofω
observed in the data, we find that the resonant velocity is pro-portional toB3/2and inversely proportional ton1/2meaning thereby that the resonant velocity or equivalently the energy has a stronger B dependence than n; thus, the source may be somewhere close to the bow shock where the field is less compressed.
6 Conclusions
We have identified three categories of plasma and whistler wave properties in the magnetosheath. We tried to explain them with the help of electron pitch angle distributions and theoretical results obtained for whistler waves with electron temperature anisotropy in a bi-Maxwellian plasma using ki-netic theory. No attempt has been made in the past to com-pare the theory and data for the lion roars that are not associ-ated with the mirror waves. This paper for the first time stud-ies the details of the electron velocity distribution function as measured by PEACE in order to investigate the underlying causes for the different cases of lion roars found in the data.
The values of growth rate obtained from theory suggest that the source of the majority of lion roars must be remote. Some exceptional instances where they could be locally gen-erated were found. Detailed analysis of magnetosheath envi-ronment shows that the source of lion roars could be local for a wave growth rate,γ, of the order of 1/10 s−1, intermediate between local and remote forγ of the order of 1/100 s−1, and remote forγ≪1, respectively. The presence of lion roars in the data corresponding to negative anisotropies is another
in-dication that the source of lion roars lies in the remote region. The cases in the data where we see positive electron tempera-ture anisotropy,Ae, sufficient to expect significant local wave
growth but no lion roars cannot be explained within the the-oretical framework.
There are several ways to make further progress in this subject. One way is to re-derive the theory for non-Maxwellian distribution functions instead of bi-non-Maxwellian (see Summers and Thorne, 1991; Qureshi et al., 2004; Chateau and Meyer-Vernet, 1989) and then repeat the pro-cedure adopted in the paper to see if the predicted wave frequencies and growth rates (and presence/absence of lion roars) can be brought into closer agreement with the data. Surveying the different regions of magnetosheath to find the source of lion roars would be an interesting study. Compari-son could then be made between theory and data in the source region. An indirect way to locate the source of lion roars would be to find the pumping mechanism or mechanisms that bring about the positive electron temperature anisotropy in the magnetosheath. The results presented in this paper use data from a single Cluster spacecraft. A related paper that employs multi-spacecraft measurements is in preparation and shall be reported elsewhere.
Acknowledgements. Cluster FGM data were drawn from the Clus-ter Science Data System prime parameClus-ters supplied by the FGM team (E. Lucek, PI). W. Masood acknowledges the support of Higher Education Commission (HEC) of Pakistan through the pro-vision of a Split-PhD studentship.
Topical Editor I. A. Daglis thanks R. A. Treumann and another referee for their help in evaluating this paper.
References
Balogh, A., Dunlop, M. W., Cowley, S. W. H., Southwood, D. J., Thomlinson, J. G., Glassmeier, K. H., Musmann, G., Luhr, H., Buchert, S., Acuna, M. H., Fairfield, D. H., Slavin, J. A., Riedler, W., Schwingenschuh, K., and Kivelson, M. G.: The Cluster Mag-netic Field Investigation, Space Sci. Rev., 79, 65–91, 1997. Baumjohann, W. and Treumann, R. A.: Basic space plasma physics,
London: Imperial College Press, 1997.
Baumjohann, W., Treumann, R. A., Georgescu, E., Haerendel, G., Fornacon, K.-H., and Auster, U.: Waveform and packet structure of lion roars, Ann. Geophys., 17, 1528–1534, 1999.
Chateau, Y. F. and Meyer-Vernet, N.: Electrostatic noise in non-Maxwellian plasmas - ’Flat-top’ distribution function, J. Geo-phys. Res., 94, 15 407–15 414, 1989.
Chisham, G., Burgess, D., Schwartz, S. J., and Dunlop, M. W.: Observations of electron distributions in magnetosheath mirror mode waves, J. Geophys. Res., 103, 26 765–26 774, 1998. Cornilleau-Wehrlin, N., Chauveau, P., Louis, S., Meyer, A., Nappa,
G´enot, V. and Schwartz, S.: Spacecraft potential effects on electron moments derived from a perfect plasma detector, Ann. Geophys., 22, 2073–2080, 2004.
Gary, S. P.: Theory of Space Plasma Microinstabilities, Cambridge University Press, 123–140, 1993.
Geach, J., Schwartz, S. J., G´enot, V., Moullard, O., Lahiff, A., and Fazakerley, A. N.: A corrector for spacecraft calculated electron moments, Ann. Geophys., 23, 931–943, 2005.
Johnstone, A. D., Alsop, C., Burge, S., Carter, P. J., Coates, A. J., Coker, A. J., Fazakerley, A. N., Grande, M., Gowen, R. A., Gur-giolo, C., Hancock, B. K., Narheim, B., Preece, A., Sheather, P. H., Winningham, J. D., and Woodliffe, R. D.: PEACE: a Plasma Electron and Current Experiment, Space Sci. Rev., 79, 351–398, 1997.
Lee, L. C., Wu, C. S., and Price, C. P.: On the generation of the mag-netosheath lion roars, J. Geophys. Res., 92, 2343–2348, 1987. Maksimovic, M., Harvey, C. C., Santol´ık, O., Lacombe, C., de
Conchy, Y., Hubert, D., Pantellini, F., Cornilleau-Werhlin, N., Dandouras, I., Lucek, E. A., and Balogh, A.: Polarisation and propagation of lion roars in the dusk side magnetosheath, Ann. Geophys., 19, 1429–1438, 2001.
Qureshi, M. N. S., Shah, H. A., Murtaza, G., Schwartz, S. J., and Mahmood, F.: Parallel propagating electromagnetic modes with the generalized (r,q) distribution function, Phys. Plasmas, 11, 3819–3829, 2004.
Rodriguez, P.: Long duration lion roars associated with quasi-perpendicular bow shocks, J. Geophys. Res., 90, 241–248, 1985. Smith, E. J. and Tsurutani, B. T.: Magnetosheath lion roars, J.
Geo-phys. Res., 81, 2261–2266, 1976.
Smith, E. J., Holtzer, R. E., and Russell, C. T.: Magnetic emissions in the magnetosheath at frequencies near 100 Hz, J. Geophys. Res., 74, 3027, 1969.
Stix, T. H.: Waves in Plasmas, American Institute of Physics, NY, 247–267, 1992.
Summers, D. and Thorne, R. M.: The modified plasma dispersion function, Phys. Fluids B, 3, 1835–1847, 1991.
Szita, S., Fazakerley, A. N., Carter, P. J., James, A. M., Tr´avn´ıcek, P., Watson, G., Andr´e, M., Eriksson, A., and Torkar, K.: Clus-ter PEACE observations of electrons of spacecraft origin, Ann. Geophys., 19, 1721–1730, 2001.
Thorne, R. M. and Tsurutani, B. T.: The generation mechanism for magnetosheath lion roars, Nature, 293, 384–386, 1981. Tsurutani, B. T., Smith, E. J., Anderson, R. R., Ogilvie, K. W.,
Scudder, J. D., Baker, D. N., and Bame, S. J.: Lion roars and non-oscillatory drift mirror waves in the magnetosheath, J. Geophys. Res., 87, 6060–6072, 1982.