Rev Saúde Pública 2013;47(6):1-11
Doracelly Hincapie-PalacioI Viviana Lenis BallesterosI Martha Ospina OspinaII Olga Lucía Pérez ToroII Francisco J DíazIII
I Grupo de Epidemiología. Facultad Nacional de Salud Pública. Universidad de Antioquia. Medellín, Colombia
II Laboratorio Departamental de Salud Pública. Secretaria Seccional de Salud y Protección Social de Antioquia. Medellín, Colombia III Grupo Inmunovirología. Facultad de
Medicina. Universidad de Antioquia. Medellín, Colombia
Correspondence:
Doracelly Hincapie-Palacio
Calle 62 No 52-59 Medellín, Colombia E-mail: [email protected]
Received: 2/1/2013 Approved: 8/19/2013
Article available from: www.scielo.br/rsp
Seroprevalence of rubella in
Colombia: a birth-year cohort
analysis
ABSTRACT
OBJECTIVE: To estimate the seroprevalence of rubella and associated factors.
METHODS: Population-based seroprevalence study in a random sample of 2,124 individuals, aged six to 64 years, representative by age, sex and area in Medellín, Colombia, 2009. Biological and socioeconomic variables were analyzed for their association with serum protection against rubella, according to birth-year cohort; those born before (1954-1990) and after (1991-2003) the introduction of universal immunization. Titer of IgG antibodies against the rubella virus was detected using a high sensitivity (AxSYM® Rubella IgG – Abbott Laboratories) and a high speciicity test (VIDAS RUB IgG II® – BioMerieux Laboratories). Proportions and weighted averages derived from a complex sample, including a correction factor for differences in gender participation, were estimated. Association with protection for groups of biological and social variables according to birth cohort was analyzed using a logistic regression model.
RESULTS: Titers of IgG antibodies were higher in those born before (mean 110 UI/ml, 95%CI 100.5;120.2) compared to those born after (mean 64 UI/ml; 95%CI 54.4;72.8; p = 0.000) the introduction of mass immunization. The proportion of protection increased from 88.9% in those born 1990-1994, to 89.2% in those born 1995-1999 and to 92.1% in those born between 2000 and 2003, possibly due to boosters being administered from 1998 onwards. In those born before the introduction of the immunization, seroprotection was associated with previous contact with cases (OR 2.6; 95%CI 1.1;5.9), self- perceived health status (OR 2.5; 95%CI 1.05;6.0), educational level (OR 0.2; 95%CI 0.08;0.8) and years of residence in the neighborhood (RD 0,96; 95%CI 0.98;1.0) after adjusting for all variables. In those born after, serum protection was associated with effective sleep time (OR 1,4; 95%CI 1.09;1.8) and self-perceived health status (OR 5.5; 95%CI 1.2;23.8).
CONCLUSIONS: The seroprevalence profile changed with the mass immunization plan, with higher titers of IgG antibodies in those born before the start of the immunization. It is recommended that the level of long-term protection be monitored and concerted action taken to improve potentially associated socioeconomic conditions.
DESCRIPTORS: Rubella Vaccine, supply & distribution. Rubella, prevention & control. Cohort Effect. Socioeconomic Factors. Seroepidemiologic Studies.
2 Seroprevalence of rubella in Colombia Hincapie-Palacio D et al
The Americas proposed to eliminate rubella and congenital rubella syndrome by 2010.20 Conirmed cases decreased by 98.0% between 1998 and 2006, but there was an outbreak between 2006 and 2009, primarily affecting young men who had not been included in the vaccination campaign, which was aimed at women of childbearing age. There were 18,230 conirmed cases of rubella and 27 of congenital rubella syndrome, especially in Brazil, Chile and Argentina.6,7 In Colombia, there were 928 conirmed cases between 1995 and 2005, falling to 18 cases between 2006 and 2009. Immunization coverage increased from 82.0% in 1995 to 93.0% in 2002.25 Coverage had been less than 90.0% in several years in the last decade, in addition there are some areas with less than 80.0% coverage,a and there are gaps in immunization coverage among localities.1 The immunization campaign began with children aged under ive in 1995. In 1998, a booster at age ten was included. From 2002, this booster started to be given at age ive. There have been a variety of immunization campaigns aimed at children, teenagers and adults, from ten to 12 years old in 1996, from 14 to 15 in 1997 and from 14 to 39 in 2005. The current immunization scheme includes a Measles-Mumps and Rubella (MMR) dose at one year of age.
In Medellín, the second biggest city in Colombia, with 2.4 million inhabitants,b a reduction in incidence has also been observed, although MMR coverage was above 100.0% between 2005 and 2009 (2005 = 127.6%; 2006 = 114.7%; 2007 = 107.5%; 2008 = 109.6%; 2009 = 111.4%), suggesting limitations of the available data.a
Knowledge of the socioeconomic factors associated with seroprevalence may help guide the design of comprehensive health care and immunization programs. Immunization coverage depends on access to health care services, which differs according to health insur-ance and socioeconomic condition.24 Rubella transmis-sion could be favored by close and prolonged contact,3 relating to crowding and social mixing at home, school and neighborhood.
The above mentioned factors are important in this region, the country and the city, where considerable poverty and social inequalities exist.5 The experience of coordinating health promoting activities with immu-nization and elimination efforts is also promising.18 The aim of this study was to estimate the seroprevalence of rubella and associated factors in Medellin. We seek to evaluate the impact of immunization and to document INTRODUCTION
the disease elimination, given the limitations of the immunization data and because about 20.0% and 50.0% of rubella infections are asymptomatic.8
METHODS
In 2009 a population-based seroprevalence survey in urban and rural areas in Medellín was conducted. The sample size of 2,400 individuals (200 in each age group, sex and area), was calculated to detect a seropositive proportion of 75.0% based on a previous study.22
A random cluster survey design was used. Each sector, neighborhood and home constituting a stage and one individual in each home was selected by simple random sampling. Inclusion criteria were: being male or female aged between six and 64 years old, residing in the selected household whose home was included in oficial cartography data. Individuals with potentially hazardous phlebotomy were excluded.
A structured questionnaire was applied to investigate the three groups of variables:26 (a) proximal variables of natural or artiicial exposure to rubella virus (immuniza -tion status according to immuniza-tion record, length of residence in the neighborhood and history of contact with diagnosed cases, or reporting travel to places in Colombia where cases had been notiied between 2003 and 2009, or to countries where outbreaks had occurred between 2006 and 20087); (b) Intermediate variables or
poten-tial mediators of the immune response (self-perceived health status, nutritional status – body mass index, avail-ability of protein-rich foods – and effective sleep time, namely the hours between going to bed and getting up, subtracting the time not spent sleeping); (c) socioeco-nomic variables (socioecosocioeco-nomic status according to the oficial classiication, self-perceived household problems in the preceding year, household crowding – persons per room, satisfaction with household income, home owner-ship, education level education and health insurance afiliation according to accreditation card).
Weight and height were measured and a blood sample taken. The data were collected by experienced nursing staff.
The blood samples were centrifuged at 10,000 rpm for ten minutes before testing. The sera were stored at -70ºC in the serum bank at the Regional Public Health Laboratory, until tested.
IgG titers were determined using the AxSYM® Rubella IgG (Abbott Laboratory) test, with 98.8% sensitivity
a Ministerio de Salud y Protección Social de Colombia. Coberturas de vacunación en Colombia. Bogotá; 2011 [cited 2012 Sep 28]. Available from: http://www.minsalud.gov.co/salud/Paginas/ProgramaAmpliadodeInmunizaciones(PAI).aspx
3 Rev Saúde Pública 2013;47(6):1-11
and 87.3% speciicity.10 Samples with results between 5 UI/ml and 20 UI/ml were tested using the VIDAS RUB IgG II® test (BioMerieux Laboratory) with a speciicity of 95.8%.10 Individuals with titers ≥ 15 UI/m were considered to indicate seropositivity, whereas those seronegative had titers < 15 UI/ml.10
All estimates were weighted to represent the total city population and non-response to the household interview.
No signiicant difference were found between partici -pants and non-partici-pants for age group (p = 0.087) nor for area (p = 0.160). Differences for sex (p = 0.010) were adjusted using a correction factor.23
Variables demonstrating a p value of less than 0.25 were included in the multivariate analysis. The logistic regression model estimated, separately, the association between rubella seroprevalence in those born between
Figure. (A) Distribution of mean IgG titers for rubella by birth year, versus proportion of seroprevalence; (B) Frequency of im-munized individuals versus year in which anti-rubella immunization was administered. Medellín, Colombia, 2009.
A
B
N = 2,124
N = 613
In 1995, mass vaccination in under 5s born in 1991 began and, from 2002, at age 5 In 2005
campaign in individuals aged 14 to 39. 140
120
100
80
60
40
20
0
1961 1971 1974 1978 1982 1984 1985 1986 1987 1988 1989 1990 1991 1992 1993 1994 1995 1996 1997 1998 1999 2000 2001 2002 2003 2004 2005 2006 2007 2008 2009
Frequenc
y
Year of vaccination Booster Dose
120 250.0
200.0
150.0
100.0
50.0
00.0 0
100
80
60
40
20
W
eighted per
centage of protection
Mean IgG titers (UI/ml)
1945 - 1949 1950 - 1954 1955 - 1959 1960 - 1964 1965 - 1969 1970 - 1974 1975 - 1979 1980 - 1984 1985 - 1989 1990 - 1994 1995- 1999 2000 - 2003 Year of Birth
Mean IgG titers
4
Seroprev
alence of rubella in Colombia
Hincapie-P
alacio D et al
Table 1. Weighted proportion of seroprevalence and mean IgG antibodies for rubella for variables of exposure to the virus, immune response and socioeconomic variables, according to year of birth – before and after immunization began – and seroprevalence against rubella. Medellín, Colombia, 2009.
Variable
Overall Born before (1954-1990) Born after (1991-2003)
Seropositive Seronegative Seropositive Seronegative Seropositive Seronegative
Categorical variables
WP 95%CI WP 95%CI WP 95%CI WP 95%CI WP 95%CI WP 95%CI
Natural or artificial exposure
Contact with casesa
Yes 93.3 89.5;94.3 7.7 5.7;10.5 93.2 90.0;95.5 6.8 4.5;10.0 90.5 84.6;94.3 9.5 5.7;15.4
No 85.6 80.6;89.5 14.4 10.5;19.4 84.8 78.7;89.5 15.2 10.5;21.3 87.0 77.9;92.8 13.0 7.2;22.1
Rubella immunizationa
Yes 92.8 89.5;95.2 7.2 4.8;10.5 94.2 88.9;97.1 5.8 2.9;11.1 91.8 86.5;95.1 8.2 4.9;13.5
No 84.4 78.3;89.0 15.6 11.0;21.7 83.5 76.8;88.6 16.5 11.4;23.2 90.6 74.3;97.0 9.4 3.0;25.7
Immune response
Health statusa
Regular/Bad/Very bad 93.4 88.3;96.3 6.6 3.7;11.7 91.7 85.2;95.5 8.3 4.5;14.8 98.7 94.0;99.7 1.3 0.6;6.0
Good/ very good 88.7 85.7;91.2 11.3 8.8;14.3 89.1 85.3;;92.0 10.9 8.0;14.7 88.1 82.6;91.9 11.9 8.1;17.4
Availability of protein-rich foodsb
Yes 90.9 87.3;93.5 9.1 6.5;12.7 91.6 87.2;94.6 8.4 5.4;12.8 89.5 82.6;93.9 10.5 6.1;17.4
No 87.6 83.4;90.8 12.4 9.2;13.9 87.0 81.8;90.9 13.0 9.1;18.2 88.5 80.9;93.4 11.5 6.6;19.1
Socioeconomic
Education level
Primary to
Postgraduate 90.5 87.6;92.8 9.5 7.2;12.4 91.5 88.5;93.8 8.5 6.2;11.5 88.0 81.2;92.5 12.0 7.5;18.8
None 85.3 77.5;90.7 14.7 7.3;26.4 77.7 62.7;87.8 22.3 12.2;37.3 90.5 82.1;95.1 9.5 4.9;17.9
Self- perceived household problemsa
Yes 87.1 81.6;91.2 12.9 8.8;18.4 90.7 85.3;94.8 9.3 5.2;16.1 80.7 68.7;88.9 19.3 11.1;31.3
No 90.1 87.2;92.4 9.9 7.6;12.8 89.2 85.3;92.1 10.8 7.9;14.7 91.9 86.4;95.2 8.1 4.8;13.6
5
Rev Saúde Pública 2013;47(6):1-11
Continuation
Satisfied with incomea
More than the
minimum 95.2 82.9;98.8 4.8 1.2;17.1 95.0 73.7;99.2 5.0 0.8;26.3 95.5 83.2;98.9 4.5 1.1;16.8
No less than the
minimum 89.1 86.3;91.3 10.9 8.7;13.7 89.3 85.9;91.9 10.7 8.1;14.1 88.0 83.5;92.5 11.2 7.5;16.5
Persons per roomb
Up to one 89.9 87.4;91.9 10.1 8.1;12.6 89.5 86.3;92.0 10.5 8.0;13.7 90.7 86.1;93.9 9.3 6.1;13.9
More than one 85.6 73.6;92.7 14.4 7.3;26.4 89.6 72.1;96.7 10.4 3.3;27.9 77.5 55.8;90.4 22.5 9.6;44.2
Socioeconomic statusb
High (4.5.6) 90.8 84.1;94.8 9.2 5.2;15.9 89.0 80.5;94.0 11.0 6.0;19.5 95.8 83.3;99.0 4.2 1.0;16.7
Low (1.2.3) 89.4 86.5;91.8 10.6 8.2;13.5 89.6 86.2;92.4 10.4 7.6;14.0 89.1 83.8;92.8 10.9 7.2;16.2
Home ownershipb
Yes 95.2 82.9;98.8 4.8 1.2;17.1 95.0 73.7;99.2 5.0 0.8;26.3 95.5 83.2;98.9 4.5 1.1;16.8
No 89.1 86.3;91.3 10.9 8.7;13.7 89.3 85.9;91.9 10.7 8.1;14.1 88.0 83.5;92.5 11.2 7.5;16.5
Health insuranceb
Insured 89.9 87.4;91.9 10.1 8.1;12.6 89.5 86.3;92.0 10.5 8.0;13.7 90.7 86.1;93.9 9.3 6.1;13.9
Not insured 85.6 73.6;92.7 14.4 7.3;26.4 89.6 72.1;96.7 10.4 3.3;27.9 77.5 55.8;90.4 22.5 9.6;44.2
Quantitative variables
Mean 95%CI Mean 95%CI Mean 95%CI Mean 95%CI Mean 95%CI Mean 95%CI
Length of
residence (years)a 14.9 13.8;15.9 16.0 12.3;19.7 17.0 15.6;18.2 21.6 16.6;26.5 11.1 9.8;12.3 6.1 4.0;8.1
Body Mass Index
(kg/m2)a 23.0 22.6;23.4 24.4 22.9;25.9 25.1 24.7;25.5 26.7 25.1;28.3 19.2 18.7;19.7 20.3 17.6;22.9
Effective sleep
time (hours)a 8.2 8.0;8.3 7.7 7.3;8.1 7.8 7.6;7.9 7.6 7.0;8.1 9.0 8.7;9.2 8.0 7.5;8.5
WP: Weighted proportion
Variables with significant differences (p obtained with non-weighted data in the simple logistic regression): a p value below 0.05; b p value between 0.05 and 0.25.
6 Seroprevalence of rubella in Colombia Hincapie-Palacio D et al
1954 and 1990 (before mass immunization began – i.e., born before) and those born between 1991 and 2003 (born after), adjusting the variables in ive models: model 1, univariate analysis; model 2, natural and arti-icial exposure variables; model 3, exposure to the virus and variables mediating the immune response; model 4, exposure to the virus and socioeconomic variables; model 5; all variables. Variables with a p value of less than 5% were considered signiicant.
The analyses were conducted using the SPSS program, version 15 (IBM SPSS Statistics).
The study was approved by the Ethics Committee of the National Public Health School, Universidad de Antioquia
(Record 17, 2007). All national ethical regulations for human research (Resolution 8430 of 1993 Colombian Ministry of Health) and the principles of the Declaration of Helsinki were adhered to.27 In the case of children,
consent was obtained from parents or guardians.
After visiting 2,390 homes, 2,124 individuals agreed to participate. Percentages of participation were as follows: overall 88,5%, urban 83,8% and rural 93.2%. Twenty-two individuals did not meet the inclusion criteria and 244 individuals refused to participate due to declining to provide a blood sample (14.9%), lack of time (9.7%), change of address (7.9%) and lack of parental consent for children (7.5%).
RESULTS
The overall weighted proportion of seropositivy was 89.4% (95%CI 86.8;91.6) and seronegativity was 10.6% (95%CI 8.4;13.2)
No difference was observed in seropositive for age in the groups aged six to 17 years old (88.9%; 95%CI 83.8;92.5), 18 to 40 years old (90.8%; 95%CI 86.2;94.1) and 41 to 64 years old (87.9%; 95%CI 83.2;91.4). There were not differences in seropositivity in males (88.5%; 95%CI 83.8;91.9) and females (90.3%; 95%CI 87.3;92.6), nor in inhabitants in urban (87.4%; 95%CI 85.2;87.8) and rural areas (90.2%; 95%CI 84.2;95.0). Mean IgG titers were signiicantly different between those born before (mean 110 UI/ml; 95%CI 100.5;120.2) and after mass vaccination began (mean 64 UI/ml; 95%CI 54.4;72.8), p = 0.000 (Figure, A).
No differences were recorded in the weighted propor-tion of seropositive (born before: 89.6; 95%CI 86.3;92.1; born after: 89.1; 95%CI 84.1;92.7) and seronegative (born before: 10.4; 95%CI 7.9;13.7; born after: 10.9; 95%CI 84.1;92.7). An increasing proportion of seropositive was found according to the dates of birth of the individuals born after: from 88.9% in those born between 1990 and 1994, 89.2% in those born between 1995 and 1999 and 92.1% in those born between 2000 and 2003 (Figure, A).
Of the sample, 33.7% of individuals presented their immunization record (95%CI 30; 37.5), particularly those born after mass immunization began (59.9%; 95%CI: 53.5;66.1). Of 613 individuals, a single vacci -nation dose was administered to 32.0% and 22.8% of those born before and after, respectively. In those born before, the mean age of receiving the irst dose was 21 years old (median = 20; CV = 58.7%), in a mass immunization campaign in 2005 (17.9%), and in those born after the mean age was one year old (median = 3, CV = 128.7%) (Figure, B). The booster was received by 8.6% of those born before and 36.5% of those born after, especially from 2002 onwards, with a median age of ive years in both groups (Figure, B).
In those born before, significant differences were observed in seroprevalence by previous immunization and contacts with cases (Table 1).
The mean length of residence in the neighborhood was high in those born before. The seroprevalence was signiicantly different in those born after, with longer mean residence in seropositive (Table 1).
The difference in self-reported health status in sero-negative was signiicant in individuals born after, with a higher proportion of seropositivity in those who reported their health to be good or very good (Table 1).
No association was observed between self-perceived health status and rubella immunization either overall (OR 1.6; 95%CI 0.93;2.8) nor disaggregated by birth-year cohort (born before: OR 1.12; 95%CI 0.61;2.5; born after: OR 3.6; 95%CI 0.68;19.2). Signiicant differences were found in education level, with a higher seropositivity in those who had attained a higher level, compared with those who had not (Table 1). An potential association was observed between education levels and immunization status in those born before (OR 0.14; 95%CI 0.06;0.34) but not in those born after nor overall (born after: OR 1.8; 95%CI 0.4;8.2; overall: OR 1.2; 95%CI 0.8;2.0).
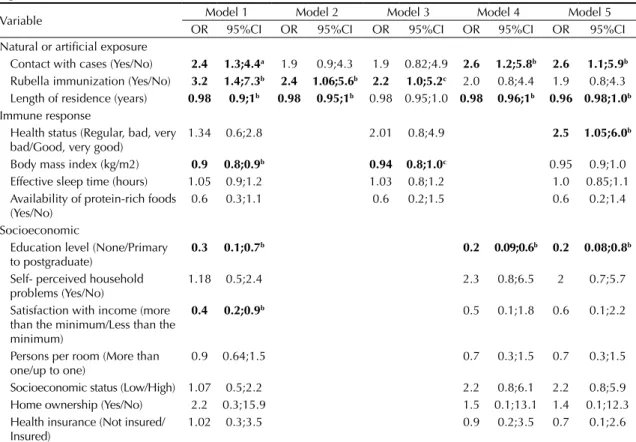
A potential association was observed in individuals born before, adjusting for all variables (model 5), according to: previous contact with cases, length of residence in the neighborhood, self-perceived health status and education level (Table 2).
7 Rev Saúde Pública 2013;47(6):1-11
Previous contact with cases was signiicant in model 1 and when adjusted for socioeconomic variables (models 4 and 5). Previous immunization was signiicant when adjusted for variables of exposure and mediating immune response (models 1, 2 and 3), but not for socioeconomic variables (Table 2).
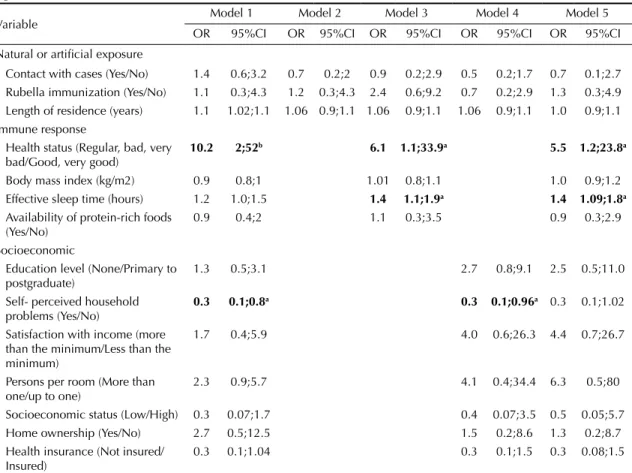
The OR was signiicant in individuals born after in model 5, according to self-perceived health status and effective sleep time (Table 3).
The odds of seropositivity were greater among indi-viduals who perceived their health status to be worse than those who felt it to be good. No association was observed in seroprevalence for previous immunization or contact with cases, in individuals born after mass immunization began (Table 3).
DISCUSSION
This study estimated an overall proportion of sero-positivity of 89.4% (95%CI 86.8;91.6), below the minimum proportion of 90.0% required to achieve herd immunity (95%CI 88.6;95.2).15 In the six to 17 year old age group, the proportion was 88.9% (95%CI 83.8;92.5). In a previous study from 1997,22 74.8% of seropositive was found in 912 children, aged between one and 14. Despite limitations of this comparison, an increase in prevalence was observed in this group, although protection needs to be increased in order to sustain rubella elimination in the Region.14,15
The lack of differences in seroprevalence for sex and area may be due to immunization programs being aimed equally at these groups.12
Table 2. Potential factors associated with rubella seroprevalence in those born between 1954 and 1990, before mass vaccination began. Medellín, Colombia, 2009.
Variable Model 1 Model 2 Model 3 Model 4 Model 5
OR 95%CI OR 95%CI OR 95%CI OR 95%CI OR 95%CI
Natural or artificial exposure
Contact with cases (Yes/No) 2.4 1.3;4.4a 1.9 0.9;4.3 1.9 0.82;4.9 2.6 1.2;5.8b 2.6 1.1;5.9b Rubella immunization (Yes/No) 3.2 1.4;7.3b 2.4 1.06;5.6b 2.2 1.0;5.2c 2.0 0.8;4.4 1.9 0.8;4.3 Length of residence (years) 0.98 0.9;1b 0.98 0.95;1b 0.98 0.95;1.0 0.98 0.96;1b 0.96 0.98;1.0b Immune response
Health status (Regular, bad, very bad/Good, very good)
1.34 0.6;2.8 2.01 0.8;4.9 2.5 1.05;6.0b
Body mass index (kg/m2) 0.9 0.8;0.9b 0.94 0.8;1.0c 0.95 0.9;1.0
Effective sleep time (hours) 1.05 0.9;1.2 1.03 0.8;1.2 1.0 0.85;1.1
Availability of protein-rich foods (Yes/No)
0.6 0.3;1.1 0.6 0.2;1.5 0.6 0.2;1.4
Socioeconomic
Education level (None/Primary to postgraduate)
0.3 0.1;0.7b 0.2 0.09;0.6b 0.2 0.08;0.8b
Self- perceived household problems (Yes/No)
1.18 0.5;2.4 2.3 0.8;6.5 2 0.7;5.7
Satisfaction with income (more than the minimum/Less than the minimum)
0.4 0.2;0.9b 0.5 0.1;1.8 0.6 0.1;2.2
Persons per room (More than one/up to one)
0.9 0.64;1.5 0.7 0.3;1.5 0.7 0.3;1.5
Socioeconomic status (Low/High) 1.07 0.5;2.2 2.2 0.8;6.1 2.2 0.8;5.9
Home ownership (Yes/No) 2.2 0.3;15.9 1.5 0.1;13.1 1.4 0.1;12.3
Health insurance (Not insured/ Insured)
1.02 0.3;3.5 0.9 0.2;3.5 0.7 0.1;2.6
Model 1: Simple Model; unadjusted OR (95%CI);
Model 2: Independent variables of natural or artificial exposure: previous contact with cases of rubella, immunization history, length of residence in the neighborhood; adjusted OR (95%CI);
Model 3: Independent variables of natural or artificial exposure and potential mediators in immune response (self-perceived health status, body mass index, effective sleep time in hours, availability of protein-rich foods); adjusted OR (95%CI); Model 4: Independent variables of natural or artificial exposure and socioeconomic variables (education level, Self- perceived household problems, satisfaction with household income, number of persons per room, home ownership, health insurance); adjusted OR (95%CI);
Model 5: Complete model. Independent variables of natural or artificial exposure, potential mediators in immune response and socioeconomic variables; adjusted OR (95%CI).
Variables with significant p value in bold. a p value 0.003 to 0.005
8 Seroprevalence of rubella in Colombia Hincapie-Palacio D et al
Table 3. Potential factors associated with rubella seroprevalence in those born between 1991 and 2003, after mass vaccination began. Medellín, Colombia, 2009.
Variable Model 1 Model 2 Model 3 Model 4 Model 5
OR 95%CI OR 95%CI OR 95%CI OR 95%CI OR 95%CI
Natural or artificial exposure
Contact with cases (Yes/No) 1.4 0.6;3.2 0.7 0.2;2 0.9 0.2;2.9 0.5 0.2;1.7 0.7 0.1;2.7 Rubella immunization (Yes/No) 1.1 0.3;4.3 1.2 0.3;4.3 2.4 0.6;9.2 0.7 0.2;2.9 1.3 0.3;4.9 Length of residence (years) 1.1 1.02;1.1 1.06 0.9;1.1 1.06 0.9;1.1 1.06 0.9;1.1 1.0 0.9;1.1 Immune response
Health status (Regular, bad, very bad/Good, very good)
10.2 2;52b 6.1 1.1;33.9a 5.5 1.2;23.8a
Body mass index (kg/m2) 0.9 0.8;1 1.01 0.8;1.1 1.0 0.9;1.2
Effective sleep time (hours) 1.2 1.0;1.5 1.4 1.1;1.9a 1.4 1.09;1.8a
Availability of protein-rich foods (Yes/No)
0.9 0.4;2 1.1 0.3;3.5 0.9 0.3;2.9
Socioeconomic
Education level (None/Primary to postgraduate)
1.3 0.5;3.1 2.7 0.8;9.1 2.5 0.5;11.0
Self- perceived household problems (Yes/No)
0.3 0.1;0.8a 0.3 0.1;0.96a 0.3 0.1;1.02
Satisfaction with income (more than the minimum/Less than the minimum)
1.7 0.4;5.9 4.0 0.6;26.3 4.4 0.7;26.7
Persons per room (More than one/up to one)
2.3 0.9;5.7 4.1 0.4;34.4 6.3 0.5;80
Socioeconomic status (Low/High) 0.3 0.07;1.7 0.4 0.07;3.5 0.5 0.05;5.7
Home ownership (Yes/No) 2.7 0.5;12.5 1.5 0.2;8.6 1.3 0.2;8.7
Health insurance (Not insured/ Insured)
0.3 0.1;1.04 0.3 0.1;1.5 0.3 0.08;1.5
Model 1: Simple Model; unadjusted OR (95%CI);
Model 2: Independent variables of natural or artificial exposure: previous contact with cases of rubella, immunization history, length of residence in the neighborhood; adjusted OR (95%CI);
Model 3: Independent variables of natural or artificial exposure and potential mediators in immune response (self-perceived health status, body mass index, effective sleep time in hours, availability of protein-rich foods); adjusted OR (95%CI); Model 4: Independent variables of natural or artificial exposure and socioeconomic variables (education level, Self- perceived household problems, satisfaction with household income, number of persons per room, home ownership, health insurance); adjusted OR (95%CI);
Model 5: Complete model. Independent variables of natural or artificial exposure, potential mediators in immune response and socioeconomic variables; adjusted OR (95%CI).
Variables with significant p value in bold. a p value 0.003 to 0.005
b p value 0.01 to 0.04 c p value = 0.05
In individuals born before 1991, a potential association was found among seroprevalence for previous contact with cases, length of residence in the neighborhood, self- perceived health status and education level.
The higher mean levels of antibody titers in individuals born before, corresponds to indings by other authors.3 The association for previous contact with cases and length of residence in the neighborhood may be due to greater time and opportunities to be exposed to the virus and to higher incidence of the disease before 1995. Mandatory reporting of rubella was initiated in 1978c and, therefore, data on exposition before this date is limited. Those born
before 1991 had probably been repeatedly exposed to the virus, due to the frequent epidemics which occurred in these years, including the pandemic in the 1960s, which are not found in local records.
Although those born before 1991 had not received free immunization, a higher proportion of seropositive was observed in individuals between 17 and 39 years old. This may be related to access to mass immunization aimed at adults in 2005.25
An association was observed between seroprevalence and immunization status of those born before 1991, when the exposure and mediating immune response
9 Rev Saúde Pública 2013;47(6):1-11
variables were analyzed. Although no association was found between immunization in those born after, the increasing proportion of seropositivity, according to date of birth, is possibly related to the administration of the booster from 1998 onwards and the reduction to ive years of age from 2002 onwards.
The positive impact of immunization onto increasing the protection of the groups to whom immunization strategies are directed has also been observed in popu-lation – based studies in the United States between 1988 and 1994 (The National Health and Nutrition Examination Survey – NHANES III) and 1999 to 2004
(NHANES IV).11,16
A limitation of this study was the quality of immuni-zation data. Fewer than 40.0% of the individuals had immunization records, which limited the ability to differentiate between natural and artiicial exposure. A potential association was observed between previous immunization and seroprevalence, without disag-gregating by date of birth (OR 2.39; 95%CI 1.3;4.2). Likewise, consistency was observed between immuni-zation and seroprevalence: the proportion of seroposi-tive was higher among those who had been immunized and the proportion of seronegative was higher among those who had not been immunized (Table 1).
Although the data on vaccine doses received were limited, it may indicate the need for timely compliance with the scheme. Administration of the irst dose varies in those born after 1991, with median age of one year old, and an average of three years old, which may be due to missed immunization opportunities, as has been seen in other studies.19 Seroprevalence data were reliable given the high sensitivity and speciicity of the tests used.10
Education level was a protector factor in those born before 1991, with higher odds for seropositivity in those who had achieved some schooling.2 This may be related to access to immunization. In these individuals, schooling could inluence the opportunity of exposure in schools and colleges, where viral dissemination was usually facilitated.
A potential association was found with self-perceived health status and effective sleep time in individuals born after 1991.
Self-perceived health status has been studied as a predictive indicator of mortality, access to health care services and is a proxy of health status,9 and it has been studied in other studies of seroprevalence.11,16 Reliability has been observed between self-reported health status according to age, sex and cultural condi-tions.13 Understanding the potential mediating role of perceived health status, related to immunization and access to health care services requires further studies. The higher seropositivity found in those who reported having better health status may be associated with immunization, and this in turn may be related to access to health care services. No asso-ciation was found between rubella immunization and self-reported health. The proxy variable of access to health care services was health insurance afiliation, which was not associated with either immunization or seropositivity.
Over the last years, researchers have accumu-lated evidence about sleep and immune response. Additional studies are needed to support the asso-ciation between the production of speciic antigens and the quality and quantity of sleep, as well as the association between sleep and long-term anti-body response as has been studied in other diseases, such as hepatitis A and B and inluenza AH1N1.4,17,21 To
our knowledge this is the irst report of a potential association between effective sleep time and rubella seroprevalence, however, it is a cross-sectional study, which limits the temporal analysis of exposure history to this factor and immune response.
The potential association of seropositivity with socio-economic variables studied highlights the need for concerted actions to be taken to improve living condi-tions. New approaches to improve the timeliness of the immunization schedule are required, to increase and sustain herd immunity and monitor the level of long-term protective antibody titers.
ACKNOWLEDGEMENTS
10 Seroprevalence of rubella in Colombia Hincapie-Palacio D et al
1. Acosta-Ramirez N, Rodriguez-Garcia J. Inequidad en las coberturas de vacunación infantil en Colombia, años 2000 y 2003. Rev Salud Publica. 2006 May;8(Suppl 1):102-15. DOI:10.1590/S0124-00642006000400009
2. Ay P, Topuzoglu A, Korukluoglu G, Cali S. Rubella seroprevalence among first-grade primary school students in a district in Istanbul, Turkey. Public Health Rep. 2006;120(3):267-73.
3. Banatvala J, Peckham C, editors. Rubella viruses. Amsterdam: Elsevier Science; 2007.
4. Benedict C, Brytting M, Markstrom A, Broman JE, Schioth HB. Acute sleep deprivation has no lasting effects on the human antibody titer response following a novel influenza A H1N1 virus vaccination. BMC Immunol. 2012 Jan 4;13. DOI:10.1186/1471-2172-13-1
5. Casas-Zamora JA. Salud, desarrollo humano y gobernabilidad en América Latina y el Caribe a inicios del siglo XXI. Rev Panam Salud Publica. 2002 May-Jun;11(5-6):397-408. DOI:10.1590/S1020-49892002000500014
6. Castillo-Solorzano C, Marsigli C, Bravo-Alcantara P, Flannery B, Ruiz Matus C, Tambini G, et al. Elimination of rubella and congenital rubella syndrome in the Americas. J Infect Dis. 2011 Sep 1;204(Suppl 2):S571-8. DOI:10.1093/infdis/jir472
7. Castillo-Solórzano C, Marsigli C, Bravo Alcántara P, Andrus J, Filippis A, Danovaro-Holliday M, et al. Progress toward elimination of rubella and congenital rubella syndrome – the Americas, 2003-2008.
MMWR Morb Mortal Wkly Rep. 2008;57(43):1176-9.
DOI:mm5743a4
8. Castillo-Solorzano C, Reef SE, Morice A, Andrus JK, Ruiz Matus C, Tambini G, et al. Guidelines for the documentation and verification of measles, rubella, and congenital rubella syndrome elimination in the region of the Americas. J Infect Dis. 2011 Sep 1;204(Suppl 2):S683-9. DOI:10.1093/infdis/jir471
9. Cella D, Riley W, Stone A, Rothrock N, Reeve B, Yount S, et al. The Patient-Reported Outcomes Measurement Information System (PROMIS) developed and tested its first wave of adult self-reported health outcome item banks: 2005-2008.
J Clin Epidemiol. 2010 Nov;63(11):1179-94. DOI:10.1016/j.jclinepi.2010.04.011
10. Dimech W, Panagiotopoulos L, Francis B, Laven N, Marler J, Dickeson D, et al. Evaluation of eight anti-rubella virus immunoglobulin g immunoassays that report results in international units per milliliter. J Clin Microbiol 2008;46(6):1955-60. DOI:10.1128/JCM.00231-08
11. Dykewicz CA, Kruszon-Moran D, McQuillan GM, Williams WW, Van Loon FP, Cossen C, et al. Rubella seropositivity in the United States, 1988-1994. Clin Infect Dis. 2001 Oct 15;33(8):1279-86. DOI:10.1086/322651
12. Forest B, Castañeda A, Ojeda C, Rojas J, Harb A, Velandia M, et al. Colombia frente a la rubéola y el síndrome de rubéola congénita, 2005 - 2006. Inf Quinc Epidemiol Nac. 2007;12(15):225-40.
13. Fosse NE, Haas SA. Validity and stability of self-reported health among adolescents in a longitudinal, nationally representative survey. Pediatrics. 2009 Mar;123(3):e496-501. DOI:10.1542/peds.2008-1552
14. Hincapie-Palacio D, Ospina-Giraldo J, Gomez-Arias RD, Uyi-Afuwape A, Chowell-Puente G. Simulación del nivel de eliminación de sarampión y rubéola según la estratificación e interacción social. Rev Salud Publica. 2010;12(1):103-15. DOI:10.1590/S0124-00642010000100010
15. Hincapié Palacio D, Ospina Giraldo J, Lenis Ballesteros V, Ospina Ospina MC, Arroyave Cadavid M, Hoyos Muñoz N, et al. Inmunidad colectiva contra la rubéola según una encuesta poblacional en Medellín, Colombia. Rev Panam Salud Publica. 2012;32(2):101-8. DOI:10.1590/S1020-49892012000800003
16. Hyde TB, Kruszon-Moran D, McQuillan GM, Cossen C, Forghani B, Reef SE. Rubella immunity levels in the United States population: has the threshold of viral elimination been reached? Clin Infect Dis. 2006 Nov 1;43 (Suppl 3):S146-50. DOI:10.1086/505947
17. Lange T, Perras B, Fehm HL, Born J. Sleep enhances the human antibody response to hepatitis A vaccination.
Psychosom Med. 2003 Sep-Oct;65(5):831-5. DOI:10.1097/01.PSY.0000091382.61178.F1
18. Molina-Aguilera IB, Mendoza-Rodriguez LO, Palma-Rios MA, Danovaro-Holliday MC. Integrating Health Promotion and Disease Prevention Interventions With Vaccination in Honduras. J Infect Dis. 2012 Mar 1;205(Suppl 1):S77-S81. DOI:10.1093/infdis/jir774
19. Mora-Garcia GJ, Ramos-Clason E, Mazenett E, Gomez-Camargo D. Seroprevalencia de IgG contra rubeola en mujeres entre 10-49 años, en Cartagena, Colombia. Rev Salud Pública. 13(2):288-97. DOI:10.1590/S0124-00642011000200010
20. Organización Panamericana de La Salud. Nueva meta de los programas de vacunación en la Región de las Américas: eliminar la rubéola y el síndrome de rubéola congénita.
Rev Panam Salud Publica. 2003;14(5):359-63. DOI:10.1590/S1020-49892003001000015
21. Prather AA, Hall M, Fury JM, Ross DC, Muldoon MF, Cohen S, et al. Sleep and antibody response to hepatitis B vaccination. Sleep. 2012 Aug;35(8):1063-9. DOI:10.5665/sleep.1990
22. Rodríguez M, Díaz F, Restrepo C, Uribe G, Melguizo M, Jaramillo N. Seroepidemiología del sarampión, la hepatitis B y la rubéola en población de 1 a 14 años.
Colombia Med. 1999;30(2):82-8.
23. Silva Aycaquer LC. Diseño razonado de muestras y captación de datos para la investigación sanitaria. Madrid: Ediciones Díaz de Santos; 2000.
24. Smith PJ, Singleton JA. Vaccination coverage estimates for selected counties: achievement of Healthy People 2010 goals and association with indices of access to care, economic conditions, and demographic composition. Public Health Rep.
2008 Mar-Apr;123(2):155-72.
11 Rev Saúde Pública 2013;47(6):1-11
This study was supported by the Colombian Institute of Scientific and Technological Development (Colciencias – contract 111540820522); by the Sustainability Strategy 2013-2014, Universidad de Antioquia, by the Medellín Health Secretariat (Secretaria de Salud de Medellín record 4600018820); and the support of the Antioquia Regional Secretariat of Health and Social Protection, part of the Strengthening the Public Health Laboratory Department of Antioquia project (Laboratorio Departamental de Salud Publica de Antioquia BPID code: 2012050000298).
Article based on the doctoral thesis of Hincapie-Palacio D., entitled: “Modelado del umbral de eliminación de la rubéola”, and the master’s dissertation of Lenis Ballesteros V., entitled: “Seroprevalencia de anticuerpos tipo IgG para rubéola y factores asociados. Medellín, 2009”, both presented to the Universidad de Antioquia in 2010.
The authors declare that there are no conflicts of interest. 25. Urquijo L, Pastor D, Velandia MP, Vicari AS. Rubella
and congenital rubella syndrome elimination activities: Colombia, 2005-2006. J Infect Dis. 2011;204 (Suppl 2):S603-7. DOI:10.1093/infdis/jir446
26. Victora CG, Huttly SR, Fuchs SC, Olinto MT. The role of conceptual frameworks in epidemiological
analysis: a hierarchical approach. Int J Epidemiol.
1997;26(1):224-7. DOI:10.1093/ije/26.1.224