NORMS FOR THE MINI-MENTAL STATE EXAMINATION
Adjustment of the cut-off point in population-based studies
(evidences from the Bambuí health aging study)
Érico Castro-Costa
1,2,3, Cíntia Fuzikawa
1, Elizabeth Uchoa
1,4,
Josélia Oliveira Araújo Firmo
1, Maria Fernanda Lima-Costa
1Abstract – Objective: To estimate the prevalence of cognitive impairment in an elderly population-based cohort, using several Mini-Mental State Examination (MMSE) cut-off points recommended by Brazilian authors and to examine the percentile distribution of MMSE scores in the study population. Method: A total of 1558 subjects aged ≥60 years (89.4% of the total), living in the city of Bambuí, MG, completed the MMSE and were included in the present study. Results: The estimated prevalences of cognitive impairment varied from 13.2% to 27.0% depending on the cut-off point and agreement varied widely between them (kappa range: 0.38 to 0.88). Cut-off point 13/14 corresponded to the 5th percentile and 21/22 corresponded to the lower quartile of the MMSE
score distribution. Conclusion: In the absence of comparable cut-off points, percentile distributions are more adequate for population-based studies of elderly with low schooling level.
KEy wordS: elderly, cognitive symptoms, epidemiology, Brazil.
Normas para o uso do Mini-Exame do Estado Mental: adequação do ponto de corte em estudos populacionais (evidências do Projeto Bambuí)
Resumo – Objetivo: Estimar a prevalência de déficit cognitivo em uma base populacional de idosos, utilizando-se os diferentes pontos de corte do Mini-Exame do Estado Mental (MEEM) recomendados por autores brasileiros e verificar a distribuição em percentis da pontuação do MEEM na população estudada. Método: Participaram do estudo 1558 (89,4% do total) indivíduos com idade ≥60 anos residentes na cidade de Bambuí, MG, que foram submetidos ao MEEM. Resultados: A prevalência estimada de déficit cognitivo variou de 13,2% a 27,0%, dependendo do ponto de corte utilizado, observando-se grande variação na sua concordância (índices de kappa entre 0,38 e 0,88). o ponto de corte de 13/14 correspondeu ao 5º percentil e o de 21/22, ao quartil inferior da distribuição dos escores do MEEM. Conclusão: Na ausência de pontos de corte comparáveis, a distribuição em percentis é mais adequada para estudos de base populacional de idosos com baixa escolaridade.
PAlAvrAS-ChAvE: idosos, sintomas cognitivos, epidemiologia, Brasil.
1Public health and Ageing research Group (PhArG), Federal University of Minas Gerais Medical School and oswaldo Cruz Foundation, rené rachou
research Institute, Belo horizonte MG, Brazil; 2Faculty of health and human Ecology, vespasiano MG, Brazil; 3health Services research department,
King’s College london, Institute of Psychiatry, london, UK; 4department of Mental health, Federal University of Minas Gerais Medical School, Belo
hori-zonte MG, Brazil. E. Castro-Costa receives a post-doctoral scholarship from the Fundação ao Amparo à Pesquisa do Estado de Minas Gerais(FAPEMIG). o Conselho Nacional de desenvolvimento Cientíico e Tecnológico (CNPq) provided M. F. lima-Costa and E. Uchoa’s scholarships.
received 25 october 2007, received in inal form 6 May 2008. Accepted 27 May 2008.
Dr. Érico Castro-Costa – Laboratório de Epidemiologia e Antropologia Médica / Centro de Pesquisas René Rachou - Avenida Augusto de Lima 1715 - 30190-002 Belo Horizonte MG - Brasil. E-mail: [email protected]
The Mini-mental State Examination (MMSE)1 is one of
the most widely used cognitive screening scales2, but
pop-ulations with low schooling level present a worse per-formance in this test3,4. Therefore, several strategies have
been proposed in order to minimize the effects of school-ing level in the interpretation of results, such as: (1) ad-justment of cut-off points according to schooling level5-8,
(2) the use of cut-off points based on the distribution of MMSE scores in the study population9 and (3)
transcultur-al adaptation10-12. In Brazil, the most common approach
has been the use of different cut-off points according to schooling level. Bertolucci et al.5 were the irst to suggest
this, proposing a cut-off of 12/13 for illiterate subjects, 17/18 for individuals with one to seven years of schooling and 25/26 for those with eight or more years of school-ing5. later, other cut-off points were suggested:
Almei-da7 recommended 19/20 as the cut-off point for illiterate
Car-amelli et al.6 suggested a cut-off point of 17/18 for
illit-erate individuals. More recently, lourenço et al.8
recom-mended 18/19 as the cut-off point for illiterate subjects and 24/25 for those with any schooling level (for further details, see Appendix).
when score distribution is used to establish cut-off points, the most recommended approach is to consid-er that subjects with scores below the 5th percentile have
a high probability of dementia13,14 and to use the lower
quartile as the cut-off for cognitive screening9,15. In Brazil,
the 5th percentile was used to deine the cut-off points
in a study of patients aged 15 years or more at a general hospital triage5. Another study determined the percentile
distribution of MMSE scores of a sample of community-dwelling elders aged 65 to 84 years, with no impairment in activities of daily living9.
The present study evaluated the MMSE scores of 1558 elderly participants of the Bambuí population-based co-hort and had the following objectives: (1) to estimate the prevalence of cognitive impairment, using several cut-off points recommended by Brazilian authors; (2) to estimate the agreement when those cut-off points were used; (3) to examine the percentile distribution of MMSE scores in this population.
METHOd Study population
The present study was conducted at the baseline of the Bambuí cohort of elderly, a population-based study carried out in Bambuí, a city of approximately 15,000 inhabitants, in the State of Minas Gerais. Participants were identiied in a com-plete census of the city population and all 1742 residents with 60 or more years of age on January 1, 1997, were invited to take
part in the study16. The cohort baseline included 1606 of those
individuals (92%). The 1558 baseline members who answered the MMSE were included in the present study; exclusions were due to refusals (n=48).
Mini-Mental State Examination
The MMSE is an instrument that evaluates cognitive func-tion, widely used in clinical practice and community studies1.
In the present study, a version in Portuguese of the MMSE was used11. In the orientation section, questions about season of the
year, hospital and loor were substituted for part of the day, room and address. In the attention and calculation section, se-rial sevens were replaced by summing by ives from zero and the word “Maria” was to be spelled backwards. These adaptations were made after investigations that established the degree of dificulty of questions of the original version in English11. Serial
ives were considered for the total MMSE score because more subjects completed those items. The MMSE was administered by interviewers with at least 11 years of schooling who were se-lected among Bambuí inhabitants. They were trained by a qual-iied psychiatrist (E. Uchoa) and certqual-iied after evaluation of the intra and inter-rater reliabilities.
The Bambuí health Aging Study was approved by the Ethics Committee of the oswaldo Cruz Foundation. All participants signed an informed consent.
Statistical analysis
To evaluate agreement beyond chance when different MMSE cut-off points were used, Cohen’s Kappa statistic was calculated17
and interpreted as proposed by Altman: values equal or above 0.81 indicated very good agreement; 0.61–0.80, good agreement; 0.41–0.60, fair; 0.21–0.40 indicated poor agreement and values equal or below 0.20 were considered very poor18. The normality
Appendix. Previous Brazilian studies that recommended cut-off points for the Mini-mental State Examination (MMSE) according to schooling level.
Author (year) Setting / Study subjects Age (years) MMSE cut-off points Bertolucci et al. (1994) n=530, most from triage service and few
inpatients from a general hospital 55% women
38% 15–50 37% 51–64 25% ≥65
Illiterate: 12/13 1–7 years of schooling: 17/18
≥8 years of schooling: 25/26 Almeida (1998) 211 geriatric mental health
clinic outpatients: 70 with dementia
141 with other mental disorders 69.2% women
≥60 Mean: 69.4
Illiterate: 19/20 Any schooling: 23/24
Caramelli et al. (1999) Community-based sample 570 illiterate subjects: 62 with dementia 67.7% women
≥65 Mean: 74.7±7.1
Illiterate: 17/18
lourenço and veras (2006) 303 geriatric clinic outpatients: 78 with dementia
71.6% women
≥65 Mean: 73±5.3
of score distribution was examined by a test that takes into ac-count the skewness and kurtosis of the curve19 and both
param-eters separately. If the distribution is symmetrical (normal) this test presents a value of zero for skewness and 3 for kurtosis. dis-tributions that are skewed to the left (when the mean is small-er than the median) have negative skewness, while heavy-tailed distributions (peaked) will have kurtosis greater than 3 and light-tailed distributions (lat) will have kurtosis lower than 3. Percen-tile distributions were also examined. Statistical analyses were performed using Stata 9.2 (College Station, TX, USA).
RESuLTS
Among the 1558 subjects (39.7% male and 60.3% fe-male), 518 were 60 to 64 years old. The mean age was 69.0±7.3 years (range: 60–95 years). low schooling level was predominant: 31.9% had no formal education; 60.1% had 1 to 7 years of schooling, and only 8.0% had 8 or more years of schooling.
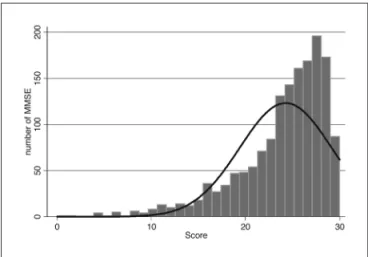
Figure presents the distribution of MMSE scores in the study population. The full line shows values that would be expected were the distribution normal. An absence of normality with a pronounced deviation to the right is noted in the score distribution (p<0.001; skewness: –1.43; kurtosis: 5.30).
The median MMSE score in the study population was 26. In the group aged 60 to 64 years the median MMSE score was 26.5 while in the group aged 65 or more years it was 25, with a statistically signiicant difference between age groups (t=6.25; p<0.00001). Scores below the 5th
per-centile were those below 14 (cut-off 13/14), and scores below the lowest quartile were those below 22 (cut-off 21/22). The corresponding values for the group aged 60– 64 years were 17 and 24 and for the group aged ≥65 years were 13 and 16, respectively. MMSE scores presented a non-normal distribution in all situations, i.e., in the total population, in younger and older groups (Table 1).
Table 2 presents the estimated prevalence of cognitive impairment according to different MMSE cut-off points, as well as Cohen’s Kappa values obtained comparing those cut-off points. The estimated prevalence of cognitive im-pairment was 13.2% with the cut-off points proposed by Bertolucci et al.5 and 22.1%, 23.8% and 27.0% when the
cut-Figure. Mini-mental State Examination score distribution of 1558 el-derly participants of the Bambuí cohort baseline.
Table 1. Percentile distribution of scores in the Mini-mental State Examination, and results of the test for normality of the scores for 1558 elderly participants of the Bambuí cohort baseline), according to age.
Percentile Age (years) Total
(n=1558)
60–64 (n=518)
≥65 (n=1040)
5 14 17 13
25 (1st quartile) 22 24 16
50 (median) 26 26.5 25 75 (3rd quartile) 28 28 28
95 30 30 29
results of the test for normality of the MMSE score (ordinal data)
c2
p-value 399.5
<0.0001
202.2
<0.0001
224.4
<0.0001 Skewness –1.43 –1.82 –1.29 Kurtosis 5.30 7.41 4.70
Skewness: 0; kurtosis: 3 when distribution is normal.
Table 2. Estimated prevalence of cognitive impairment among 1558 elderly of the Bambuí cohort baseline, according to different Mini-mental State Examination cut-off points and Cohen’s Kappa between these cut-off points.
Prevalence N (%)
Cohen’s Kappa (Sd)
Almeida (1998) Caramelli et al. (1999) lourenço et al. (2006) Bertolucci et al. (1994) 205 (13.2) 0.38 (0.02) 0.54 (0.03)** 0.40 (0.02) Almeida (1998) 371 (23.8) 0.73 (0.04)** 0.80 (0.02) Caramelli et al. (1999) 110 (22.1)* 0.88 (0.04)**
lourenço et al. (2006) 421 (27.0)
offs proposed by Caramelli et al.6, Almeida7 and
louren-ço et al.8 were used, respectively. In regard to the
agree-ment between them, a poor agreeagree-ment was found in two of the three combinations that evaluated all schooling levels (kappa=0.38 and 0.40) and moderate to excellent agreement in the combinations that considered only il-literate subjects (kappa range 0.54–0.88).
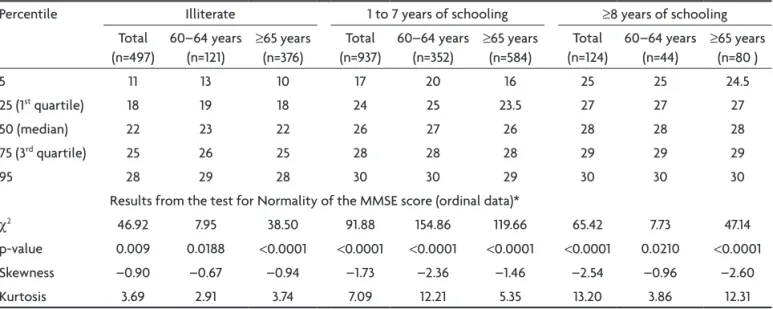
Table 3 presents the percentile distribution of MMSE scores of the study subjects, and the results of the test for normality of its score distribution, according to age and schooling level. The 5th percentile of the score
distri-bution ranged from 11 among illiterate to 17 among those with 1 to 7 years of schooling, and 24 among those with higher schooling level. The distribution of MMSE scores remained non-normal even after stratiication by age and schooling level. .
dIScuSSION
The present study is the irst to examine the perfor-mance of MMSE cut-off points that have been proposed for the Brazilian population, in a well defined popula-tion-based sample. A great variation in the prevalence of cognitive impairment was found when the previously recommended cut-off points were used. Agreement var-ied widely, relecting the absence of consensus among Brazilian studies.
Part of the observed variation among proposed cut-off points may have been due to differences in the char-acteristics of the study samples. The population evalu-ated by Bertolucci et al. was considerably younger than other studies. Furthermore, studies were performed in di-verse settings: a general hospital triage5, a geriatric mental
health outpatient clinic7, a geriatric outpatient clinic8 and
in a community-based sample6. differences in the
meth-od used to determine the recommended cut-off point(s) may also have contributed to the observed variation (for further details, see Appendix). In most cases, the cut-off that presented the best balance between sensitivity and speciicity for the detection of dementia was chosen6-8.
In one study, the 5th percentiles of MMSE scores achieved
by a sample of patients at a general hospital triage were deined as the cut-off points5.
Additionally, most of the MMSE cut-off points that have been recommended in Brazil were based on studies performed in health services5-8, limiting their
generaliz-ability to other settings. Traditionally when validated cut-off points are not available from population-based stud-ies, the mean and the dispersion around it (usually the mean ±2 standard deviations) are adopted as “normality” limits. however this criterion can only be used when test scores present a normal distribution. The use of the mean MMSE score ±2 Sd is usually inadequate because of the absence of a normal score distribution. This was the case in the present study, where the absence of normality was evident. Furthermore, it is important to stress that it was not possible to normalize the MMSE scores of the study population, even using the types of transformation more commonly found in the literature such as logarithmic, cu-bic or quadratic, among others (results not shown). Thus, the use of the mean is not adequate for the MMSE score distribution in the present study20,21.
Therefore, percentile distribution of the MMSE score seems to be the most adequate option for the study pop-ulation. Scores below cut-off point 13/14 corresponded to those below the 5th percentile and the prevalence of
cognitive impairment estimated using this cut-off was
Table 3. Percentile distribution of scores in the Mini-Mental State Examination and results of the test for normality of its scores, according to age and schooling level, for 1558 elderly participants of the Bambuí cohort baseline).
Percentile Illiterate 1 to 7 years of schooling ≥8 years of schooling Total
(n=497)
60–64 years (n=121)
≥65 years (n=376)
Total (n=937)
60–64 years (n=352)
≥65 years (n=584)
Total (n=124)
60–64 years (n=44)
≥65 years (n=80 ) 5 11 13 10 17 20 16 25 25 24.5 25 (1st quartile) 18 19 18 24 25 23.5 27 27 27
50 (median) 22 23 22 26 27 26 28 28 28 75 (3rd quartile) 25 26 25 28 28 28 29 29 29
95 28 29 28 30 30 29 30 30 30 results from the test for Normality of the MMSE score (ordinal data)*
c2 46.92 7.95 38.50 91.88 154.86 119.66 65.42 7.73 47.14
p-value 0.009 0.0188 <0.0001 <0.0001 <0.0001 <0.0001 <0.0001 0.0210 <0.0001 Skewness –0.90 –0.67 –0.94 –1.73 –2.36 –1.46 –2.54 –0.96 –2.60 Kurtosis 3.69 2.91 3.74 7.09 12.21 5.35 13.20 3.86 12.31
4.3%. It is interesting to note that this prevalence is very similar to the one found in an area of the city of São Paulo (5.9%)22 using the 10/66 dementia research Group
proto-col, developed to avoid educational and cultural biases in population-based studies in developing countries23. This
prevalence is also similar to estimates for elderly in latin America (4.6%)24.
regarding methodological aspects of the present study, it is important to note that the MMSE version used was adapted for populations with low schooling level. In-terviews were conducted by lay-interviewers who under-went extensive training by a qualiied psychiatrist. They were only certiied as interviewers after intra and inter-rater reliabilities were assessed. Although the study was carried out in a population in the State of Minas Gerais with characteristics similar to the elderly Brazilian popu-lation as a whole, this does not mean it can be considered representative of the elderly population of this country. Furthermore, the study was done in a non-selected el-derly population, living in the community. These measures allowed the aim of the study to be reached: to compare the estimated prevalences of cognitive impairment in a single population, using the different MMSE cut-off points proposed in the Brazilian literature.
The results of the present study show that the adop-tion of the cut-off points suggested in the Brazilian litera-ture led to great variations in estimates of the prevalence of cognitive impairment in the study population. Thus, it is reasonable to consider that those cut-off points are not comparable between populations. In the absence of com-parable cut-off points, percentile distribution of MMSE scores is more adequate for population-based studies of the elderly with low schooling level.
REFERENcES
1. Folstein MF, Folstein SE, McHugh PR. “Mini-Mental State”: a practi-cal method for grading the cognitive state of patients for the clinician. J Psychiat Res 1975;12:189-198.
2. Shulman KI, Herrmann N, Brodaty H, et al. IPA survey of brief cogni-tive screening instruments. Int Psychogeriatr 2006;18:281-294. 3. Crum RM, Anthony JC, Basset SS, Folstein MF. Population-based norms
for the Mini-Mental State Examination by age and educational level. JAMA 1993;269:2386-2391.
4. Tombaugh TN, McIntyre NJ. The Mini-Mental State Examination: a comprehensive review. J Am Geriatr Soc 1992;40:922-935.
5. Bertolucci PHF, Brucki SMD, Campacci SR, Juliano Y. O mini-exame do estado mental em uma população geral: impacto da escolaridade [The Min-Mental State Examination in a general population: impact of edu-cational status]. Arq Neuropsiquiatr 1994;52:1-7.
6. Caramelli P, Herrera E Jr, Nitrini R. O mini-exame do estado mental no diagnóstico de demência em idosos analfabetos[The Mini-State Exam-ination and the diagnosis of dementia in illiterate elderly]. Arq Neu-ropsiquiatr 1999;57(Suppl 1):S7.
7. Almeida OP. Mini Exame do Estado Mental e o diagnóstico de dêmen-cia no Brasil [Mini mental state examination and the diagnosis of de-mentia in Brazil]. Arq Neuropsiquiatr 1998;56:605-612.
8. Lourenço RA, Veras RP. Mini-Exame do Estado Mental: características psicométricas em idosos ambulatoriais[Mini-Mental State Examination: psychometric characteristics in elderly outpatients]. Rev Saude Publica 2006;40:712-719.
9. Laks J, Baptista EM, Contino AL, de Paula EO, Engelhardt E. Mini-Men-tal State Examination norms in a community-dwelling sample of elder-ly with low schooling in Brazil. Cad Saude Publica 2007;23:315-319. 10. Brucki SM, Nitrini R, Caramelli P, Bertolucci PH, Okamoto IH.
Sug-estões para o uso do Mini-Exame do Estado Mental no Brasil[Sugestions for utilization of the mini-mental state examination in Brazil]. Arq Neu-ropsiquiatr 2003;61:777-781.
11. Seabra MLV, Concílio GV, Villares JB, Carlini EA. Avaliação do teste “Mini-mental state” em voluntários e pacientes brasileiros[Evaluation of Mini Mental State in Brazilian volunteers and patients]. Rev ABP-APL 1990;12:1-29.
12. Brito-Marques PR, Cabral-Filho JE. The Role of Education in Mini-Men-tal State Examination. Arq Neuropsiquiatr 2004;62:206-211.
13. Anderson TM, Sachdev PS, Brodaty H, Trollor JN, Andrews G. Effects of sociodemographic and health variables on Mini-Mental State Exam scores in older Australians. Am J Geriatr Psychiatry 2007;15:467-476. 14. Chui H, Zhang Q. Evaluation of dementia: a systematic study of the
usefulness of the American Academy of Neurology’s practice parame-ters. Neurology 1997;49:925-935.
15. Lezak MD, Howieson DB, Loring DW, Hannay HJ, Fischer JS. Neuro-psychological Assessment, 4th ed. Oxford University Press, 2004.
16. Lima-Costa MF, Uchoa E, Guerra HL, et al. The Bambuí Health and Ageing Study (BHAS): methodological approach and preliminary re-sults of a population-based cohort study of the elderly in Brazil. Rev Saude Publica 2000;34:126-135.
17. Cohen J. A coeficient of agreement for nominal scales. Educ Psychol
Meas 1960;20:37-46.
18. Altman DG. Practical Statistics for Medical Research. London: Chap-man & Hall, 1990.
19. D’Agostino RB, Belanger A, D’Agostino RB Jr. A suggestion for using powerful and informative tests of normality. Am Stat 1990;44:316-321. 20. Brugha TS, Bebbington PE, Jenkins R, et al. Cross validation of a gener-al population survey diagnostic interview: a comparison of CIS-R with SCAN ICD-10 diagnostic categories. Psychol Med 1999;29:1029-1042. 21. Wittchen HU, Ustün TB, Kessler RC. Diagnosing mental disorders in the
community: a difference that matters? Psychol Med 1999;29:1021-1027. 22. Scazufca M, Menezes PR, Vallada HP, et al. High prevalence of demen-tia among older adults from poor socioeconomic backgrounds in São Paulo, Brazil. Int Psychogeriatrics 2008;20:394-405.
23. Prince M, Acosta D, Chiu H, Scazufca M, Varghese M. Dementia diag-nosis in developing countries: a cross-cultural validation study. Lancet 2003;361:909-917.