DOI: http://dx.doi.org/10.5007/1980-0037.2014v16n3p345
original article
RBCDH
1 State University of São Paulo. Institute of Biosciences. Center for Physical Activity, Sport and Health. Rio Claro, SP. Brazil.
2 Federal University of Pelotas. Graduate Program in Epidemiolo-gy. Pelotas, Brazil.
Received: 08 May 2013 Accepted: 02 October 2013
Walking for leisure and commuting and
association with socioeconomic factors and
perceived environment in adults
Prática de caminhada no lazer e no deslocamento e
associação com fatores socioeconômicos e ambiente
percebido em adultos
Inaian Pignatti Teixeira1
Priscila Missaki Nakamura1;2
Eduardo Kokubun1
Abstract – his study aimed to analyze the association between walking for leisure and commuting and the perceived environment in adults living in Rio Claro, São Paulo, Bra-zil. A cross-sectional household-based study was conducted with 470 adults (45.7±17.8 years). Subjects responded to the International Physical Activity Questionnaire (long version) and to an adapted version of the Neighborhood Environmental Walkability Scale, which was used to evaluate the perceived built and social environments. Data analysis was performed using logistic regression. he outcome was walking ≥10minutes/week for leisure or commuting. he prevalence of participants who regularly walked ranged from 20.6% (walking for leisure) to 58.9% (walking for commuting). he prevalence of walking for commuting was higher in women than in men (66.3% and 50.0%, respectively), and walking for leisure was more common among men (21.7% when compared to 19.8% of women). Walking for commuting was associated with the female sex, lower economic classes (C, D, and E), and perceived availability of crosswalks. Walking for leisure was associated with the following individual and environmental variables: age (60 years or above), social class (B2, C, D, and E), invitations by friends and/or neighbors for walking. he results demonstrate that there is an association between perceived environment and walking for leisure or commuting.
Key words:Leisure activities; Perception; Transportation; Walking.
INTRODUCTION
he regular practice of physical activity is recognized as an important component of a healthy lifestyle, and consequently has been associated with increased longevity and reduced risk of mortality and morbidity due to chronic non-communicable diseases1.
Among the various forms of physical activity, walking is gaining prominence as it is a simple activity that can be performed by most of the population, does not require special skills or special facilities and can be
performed at home or outdoors, alone or with other people2. herefore,
various types of interventions have been proposed with the aim of pro-moting walking3 and contribute to reduce the high prevalence of physical inactivity that reaches 31.1% of people worldwide 4 and its harmful health consequences.
In Brazil, walking is among the primary means of locomotion for 24% of the population, being even more common than family car (16%)5. As for leisure, studies in Brazil indicate a variation from 8.8%6 to 35%7 of people practicing walking in the leisure domain.
In a recent paper, Bauman et al.8 pointed out that several original stud-ies and systematic reviews have searched for patterns and characteristics associated with the practice of physical activity and the characteristics of the perception of natural, social and built environments. For this, objective measures such as direct observation and Geographic Information System and subjective measures through questionnaires8 have been both used. Also in this work, Bauman et al.8 highlight key environmental variables that are associated with physical activity for leisure and commuting; however, in Latin America as in middle- or low-income countries, further studies on this topic are need.
Speciically regarding walking, some studies carried out in Brazil have investigated the relationship between walking and the natural, social and built environments6,10-13. he results of these studies showed that the environment interacts diferently with walking in commuting and leisure
domains and in commuting, security seems to play an important role7,13
and in leisure, structures such as sidewalks6 appear as prominent. Other attributes such as street lighting and proximity of residence in relation to the health facility, soccer ield and square are associated with the practice of walking in a more general way (leisure + commuting)12,13.
METHODS
his home-based cross-sectional study was conducted from January 2011 to January 2012 with a sample of adults of both sexes aged over 18 years living in the urban area of the municipality of Rio Claro - SP.
Rio Claro is located in the southeastern region of the state of São Paulo and has 187,637 inhabitants, mostly women (51.3%) and had a popula-tion growth of 10.7% in the last decade14. he per capita GDP is around
27 thousand Reais / year14 and the Human Development Index (HDI) in
2011 was 0.82515.
Study Design
he sample size calculation was based on the following formula: n = [p(1-p)/(d/z)2]. Def, regarding the estimation of proportions proposed by Kish (1965) apud Salvador and colleagues12. To this end, the proportion of inactive subjects (P) as equal to 0.5; Z = 1.96 was adopted, regarding the value of the standard normal curve corresponding to the 95% conidence level used in determining the conidence interval; d = 0.065, referring to the maximum allowed sampling error; and def = 2, corresponding to the design efect. Applying the values in the formula, the minimum sample size of 455 adults was estimated.
he sampling process was conducted in ive stages according to the following procedures: 1 - Listing of all urban census tracts in the city of Rio Claro registered at IBGE (n = 200); 2 – Drawing of census tracts (n = 100); 3 - Listing of all households in the selected sectors (enrollment); 4 – Drawing of households proportionally to the sector area, ranging from two to ten houses per sector; 5 - Drawing of one adult resident in the selected household.
To select individuals living in the household, the methodology of Kish16 was used, which deines six tables with identiication numbers varying according to the total number of residents.
Exclusion criteria for this study included institutionalized individuals (hospitals, long term care facilities - nursing homes, prisons), people who had diseases or problems that afected the practice of physical activity in the week prior to the interview, mental problems that prevented them from answering the questionnaire independently.
Individuals who did not want to answer the interviewer or did not ac-cept signing the informed consent form were considered refusals. Losses were characterized as situation in which the resident (possible research subject) was absent in 5 visits of the interviewer.
Outcomes
time in each domain, the International Physical Activity Questionnaire (IPAQ) in its long version was used. he period of seven days preceding the interview was considered as the reference.
Independent variables
Independent variables were related to the perceived environment collected through an adapted version of the scale Neighborhood Environment Walkability Scale (NEWS) 17 previously used in other studies10,12,13. Such adaptation was performed in order to improve the scale understanding, being discussed by experts in the ield of environment and physical activity in Brazil and showing intraclass correlation coeicient ≥ 0.70 for all scores elaborated based on individual questions13.
he irst part of NEWS consists of 18 structured questions so that respondents report how long they walk from their homes to diferent busi-ness, services or recreation (parks, squares, places to walk, exercise lanes, clubs, sports courts, soccer ields, bus shelters, health clinics, pharmacies, churches or religious temples, bakeries, banks, bars, fairs, stores, markets and supermarkets) in the neighborhood in which they live.
he second part consists of 41 questions related to environmental struc-tures nearby the residence, such as the presence and quality of sidewalks and green areas, if streets are lat, presence of garbage near residences, open sewage, if traic makes walking or bicycle riding diicult, existence of crosswalk to cross the street and if drivers tend to respect them, pol-lution, smoke, street lighting at night, safety in walking during day and night, invitation of friends, neighbors and relatives to walk, ride bike or play sports in the neighborhood, weather and presence of pets. Individuals were asked to assess how close to their residence were places they could reach in up to 10 minutes walking.
Some scores based on individual questions were also generated, being assigned a concept that ranged from poor to great, namely:
• Pollution: his score took into account places with accumulation of
garbage on streets close to residences, if there are places with open sewage in streets close to residences and if there are many walls with graiti close to residences. his score ranged from 0 to 3, and for those who answered no positive aspect to the practice of physical activity, the score was 0, for those who responded one positive aspect, the score was 1 and so on.
• Access to recreational areas: his score took into account seven
later transformed into quartiles (Poor - 0-3, Regular - 4-7, Good - 8-10 and Great - 11-14).
• Places of convenience: his score took into account 10 structures of
convenience: health centers, pharmacies, churches or religious tem-ples, bakeries, banks, bars, fairs, grocery stores, supermarkets and restaurants. Each item received a score from 0 to 2 (no structure = 0, presence of structure, more than 10 minutes walking = 1, and presence of structure, less than 10 minutes walking = 2). he total score was obtained by summing the ten items, ranging from 0 to 20, and later transformed into quartiles (Poor - 0-4, Regular - 5-9, Good - 10-14 and Great - 15-20).
• Access to total areas: his score took into account 18 structures: parks, squares, places to walk, exercise lanes, clubs, sports courts, soccer ields, bus shelters, health clinics, pharmacies, churches or religious temples, bakeries, banks, bars, fairs, restaurants, markets and supermarkets. Each item received a score from 0 to 2 (no structure = 0, presence of structure, more than 10 minutes walking = 1, and presence of struc-ture, less than 10 minutes walking = 2). he total score was obtained by summing the eighteen items, ranging from 0 to 36, and was later transformed into quartiles (Poor - 0-9, Regular – 10-8, Good - 19-27 and Great - 28-36).
In addition to the variables above, questions regarding year of birth/ age, religion, skin color (white, black, brown, yellow, indigenous, others), marital status (single, married, widowed, divorced, cohabiting) and edu-cational level were performed (illiterate, incomplete elementary school; complete elementary school, incomplete high school; complete high school, incomplete higher education and complete higher education). To access the economic class, the questionnaire proposed by the Brazilian Association of Research Companies that groups individuals into economic classes A (high), B, C, D and E (low) according to the purchasing power was used19.
he questionnaires were applied by nine interviewers who were submit-ted to a ten-hour training period on the research tools and interviewing techniques, followed by two interviews accompanied by responsible for the research.
he study was approved by the Ethics Committee on Human Research, Institute of Biosciences, State University of São Paulo (UNESP), Campus of Rio Claro (process No.: 078/2010).
Statistical Analysis
used. Statistical analyses were performed in four steps: 1) Chi-square of all independent variables with two walking outcomes; 2) Variables with p values <0.20 in the previous step were used for the elaboration of bivari-ate analyses, being individually tested; 3) For the elaboration of multiple models, only variables with p <0.20 in the previous step were selected 19 4) For the inal model, only variables with p <0.05 in the previous step were included. he inal model was adjusted for control variables sex, age and economic class. All statistical analyses were performed using the Statistical Package for the Social Sciences (SPSS) version 17.0.
RESULTS
Of the 579 eligible households, 42 (7.3%) were classiied as refusals and 67 (11.5%) as losses. Overall, 470 subjects were interviewed (81.7%) and the average time spent for the application of the questionnaire was 21.1 ± 7.5 minutes (mean ± standard deviation). he results of sociodemo-graphic variables showed that most respondents were married or cohabit-ing (54.5%), with 12 or more years of schoolcohabit-ing (57.7%), with 10 or more years of residence in the neighborhood (61.3 %), Caucasians (70.4%) and Catholics (60.2%) (Table 1).
he prevalence of at least 10 minutes of walking in the commuting domain per week was 58.9%, being more prevalent among women (66.3%) compared to men (50.0%). For walking in the leisure domain, 20.6% of respondents reported doing this activity for at least 10 minutes per week (women - 19.8%; men - 21.7%) (Figure 1).
Figure 1. Prevalence of walking in commuting and leisure domains stratiied by sex. Rio Claro - SP. (n = 470 adults).
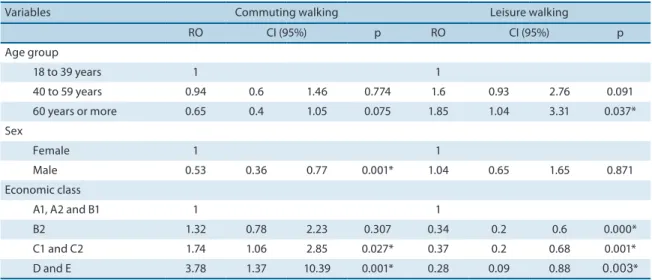
Table 2 presents the results of the binary logistic regression for walking in commuting and leisure domains and the control variables age, gender, and economic class. For walking in the leisure domain, it was observed that older adults (60 years or more) had higher odds of practicing at least 10 minutes / week of walking in the leisure domain (OR = 1.85 CI95% = 1.04 to 3 , 31) compared to younger adults (≤ 39 years).
(C, D and E) had higher odds compared with those of class A and B1. As in walking in the commuting domain, people of lower economic classes (B2, C, D and E) had lower odds of walking in the leisure domain when compared with people of class A and B1.
Table 1. Demographic characteristics of participants. Rio Claro, SP. Brazil (n = 470 adults).
Variables % CI95% n(470)
Lower Upper
Sex
Male 45.1 39.2 51.0 212
Female 54.9 49.0 60.8 258
Age group
18 to 39 years 44.0 38.1 49.9 207
40 to 59 years 31.3 25.8 36.8 147
60 years or more 24.7 19.6 29.8 116
Marital status
Single 27.2 21.9 32.5 128
Separated, widowed, divorced 18.3 13.7 22.9 86
Married and cohabiting 54.5 48.6 60.4 256
Educational level
0 to 7 years 27.4 22.1 32.7 129
8 to 11 years 14.9 10.7 19.1 70
12 years or more 57.7 51.8 63.6 271
Economic class
A1, A2 and B1 21.5 16.6 26.4 101
B2 28.9 23.5 34.3 136
C1 and C2 43.8 37.9 49.7 206
D and E 5.8 3.0 8.6 27
Time of residence in the neighborhood
1 year or less 11.1 7.4 14.8 52
1 to 10 years 27.7 22.4 33.0 130
10 years or more 61.2 55.5 67.1 288
Skin color
White 70.4 65.0 75.8 331
Non white 29.6 24.2 35.0 139
Religion
Catholic 60.2 54.4 66.0 283
Evangelical 20.6 15.8 25.4 97
None 11.3 7.5 15.1 53
Others 7.9 4.7 11.1 37
cross-walk in the neighborhood, feeling of safety at night, weather as a barrier to practice and pollution smoke. All independent variables previously mentioned composed the multivariate model (gross) and only presence of crosswalk in the neighborhood showed p <0.05. Ater adjustment for sex, age and economic class, it remained with signiicant association (p = 0.032). hus, people who perceived the presence of crosswalks in the neighborhood were 73% more likely to perform at least 10 minutes of walking per week as a form of displacement when compared with those who did not perceive such structures (Table 3).
Table 2. Binary logistic regression of physical activity outcomes with independent variables age, gender and economic class
Variables Commuting walking Leisure walking
RO CI (95%) p RO CI (95%) p
Age group
18 to 39 years 1 1
40 to 59 years 0.94 0.6 1.46 0.774 1.6 0.93 2.76 0.091
60 years or more 0.65 0.4 1.05 0.075 1.85 1.04 3.31 0.037*
Sex
Female 1 1
Male 0.53 0.36 0.77 0.001* 1.04 0.65 1.65 0.871
Economic class
A1, A2 and B1 1 1
B2 1.32 0.78 2.23 0.307 0.34 0.2 0.6 0.000*
C1 and C2 1.74 1.06 2.85 0.027* 0.37 0.2 0.68 0.001*
D and E 3.78 1.37 10.39 0.001* 0.28 0.09 0.88 0.003*
*p < 0.05
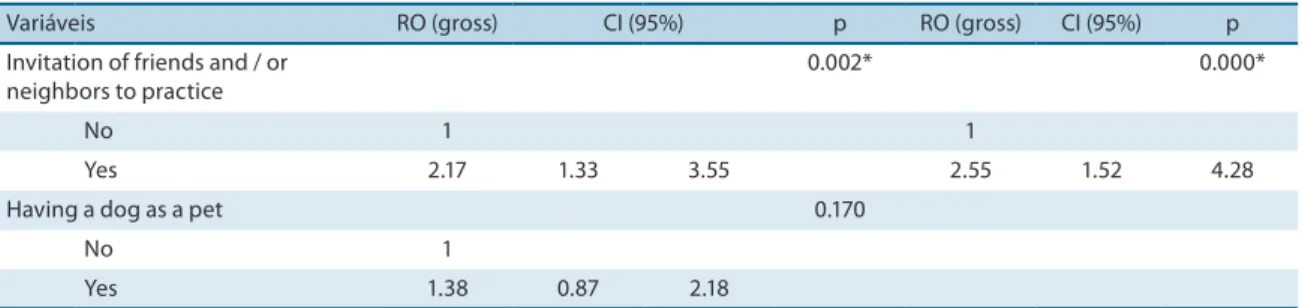
Variables with p <0.20 in the bivariate analysis between practice of at least 10 minutes of walking in the leisure domain and independent vari-ables were: Invitation of friends and having a dog as a pet. All independent variables previously mentioned composed the crude model and only the invitation of friends was part of the inal model with p <0.05. hus, it was observed that people who were invited by friends for physical activity (OR = 2.55, CI 95% 1.52-4.28) had higher odds of practicing at least 10 minutes of walking per week in the leisure domain (Table 4).
DISCUSSION
The practice of walking in the commuting domain was reported by 58.9% of respondents. In 2011, a study conducted in the district of Er-melindo Matarazzo with 890 subjects found that 85.7% of respondents performed at least 10 minutes of walking in the commuting domain 13, but in Curitiba, this value was 55% 7 when the national average was
53% 5. It is noteworthy that the proportion of people who walk in the
Table 3. Gross and adjusted binary logistic regression model with dependent variable practice of at least 10 minutes of walking in the commuting domain
Variables RO (crude) CI (95%) p RO
(adjusted)# CI (95%) p
Pollution score 0.162&
Poor 1
Regular 0.26 0.05 1.30
Good 0.28 0.06 1.39
Great 0.31 0.06 1.65
Quartile of access to total areas 0.055&
Poor 1
Regular 2.19 0.81 5.93
Good 2.22 0.60 8.17
Great 3.68 0.66 20.39
Quartile of access to convenience 0.246&
Poor 1
Regular 1.20 0.67 2.16
Good 0.59 0.26 1.36
Great 0.46 0.16 1.29
Quartile of access to leisure areas 0.076&
Poor 1
Regular 1.33 0.49 3.62
Good 1.16 0.39 3.45
Great 1.08 0.29 3.99
Crosswalk near home 0.024* 0,032
No 1 1
Yes 1.81 1.08 3.02 1.73 1,05 2,85
Feeling of safety for night practice 0.173
No 1
Yes 0.74 0.48 1.14
Weather as barrier for practice 0.344
No 1
Yes 0.82 0.54 1.24
Smoke pollution
0.098
Presence 1
Absence 0.62 0.36 1.09
Note: R² = 0.15 (Nagelkerke); 0.11 (Cax and Snell); & p of trend; *p<0.05; # Model adjusted for sex, age and socioeconomic status.
Table 4. Gross and adjusted binary logistic regression model with dependent variable practice of at least 10 minutes of walking in the leisure domain.
Variáveis RO (gross) CI (95%) p RO (gross) CI (95%) p
Invitation of friends and / or neighbors to practice
0.002* 0.000*
No 1 1
Yes 2.17 1.33 3.55 2.55 1.52 4.28
Having a dog as a pet 0.170
No 1
Yes 1.38 0.87 2.18
which, as found in Rio Claro, can influence walking in the commuting domain (Table 2).
he prevalence of walking in the commuting domain was higher among women (66.3%) compared with men (50.0%). One possible explanation for this may be due to the high number of men who use car to go to work (44.3%) and to the place of physical activity in leisure time (15.6%) compared with women, 18.6% and 9.7% respectively (data not shown).
In the present study, 36.8% of respondents perceived the existence of crosswalks near the residence and this environmental variable was signii-cantly associated with the practice of walking in the commuting domain (OR = 1.73 CI = 1.05-2.85).
International studies have shown that 54% of pedestrian accidents occur when the person is crossing the street20 and in most cases, these pe-destrians are not crossing the street in appropriate places for such purposes
such as walkways, crosswalks and underground passages21.
he act of crossing the street is a complex behavior that involves several skills including cognitive, physical and sensory actions. Before performing the task of crossing the street, there is a need for checking the traic of vehicles, to integrate several sources of information, feel safe to cross it and to adjust the motor action according to the perception of surrounding vehicles. Crosswalks guarantee, even partially, pedestrian safety to accom-plish this task, since according to Article 70 of the Brazilian Traic Code, cars should give preference to the passage of pedestrians on crosswalks even if they have not completed the crossing and the lights have turned green for the vehicle.
he results of this study reinforce the idea that investment in struc-tures aimed at providing safety for pedestrians, such as crosswalks, may contribute to the promotion of walking in the commuting domain. However, crosswalks are predominantly located at downtown, which is characterized as an area of mixed use, with high number of squares and business, and these attributes can also contribute to walking in the commuting domain.
In contrast, the present study found no positive association between perceived safety and the practice of walking in the commuting domain,
as observed in other studies7,13. A possible explanation may be due to
the fact that the population of the cities of Curitiba and São Paulo are considerably higher than that of Rio Claro (1.7 million and 11.3 million versus 187,000).
Oliveira (2005) apud Santos and Kassou 22 report that the city size is crucial to the crime rate, and the greater the city size, the higher the crime rate. hus, perceived safety may have a greater impact on the decision to walk in large urban centers compared to smaller cities.
Regarding gender, this study showed higher prevalence of walk-ing in the leisure domain among men (21.7%) compared with women
(19.8%), which is not consistent with other indings in literature23,24.
Nevertheless, the logistic regression analysis showed no signiicant as-sociation between sex and practice of walking in the leisure domain, which behavior is similar to results found in the cities of Recife, Curitiba, Vitória6 and Pelotas24.
Regarding factors associated with walking in the leisure domain, this study found that the invitation of friends / neighbors for physical activity (OR = 2.33 CI = 1.37-3.96) was signiicantly associated with greater odds of practicing some walking in the leisure domain.
Several studies have shown that social support is positively associated with several outcomes for physical activity13,25,26. his social support can manifest in various spheres of personal relationships, which can be attrib-uted to friends, relatives, doctors, teachers, spouses, to the fact of seeing other people practicing physical activities and also to having pets such as dogs and horses.
Some authors suggest that social support from dogs can positively impact the practice of walking27,28. his efect is related to the number of
sessions and time of walking per week27 and to the chance of achieving
recommended levels of walking28. Despite such evidence, the present study found this association only in the bivariate model, which seems to disap-pears in the crude logistic regression model (OR = 1.38 CI = 0.87-2.18).
In contrast, social support from friends and neighbors plays an im-portant role in the practice of walking in the leisure domain. Our results show that people who receive invitations for walks, either from friends or neighbors, are more likely to practice this modality. hese indings are consistent with several studies that have evaluated the inluence of relatives and friends on the practice of physical activity.
Ball et al.29, in a study with over 1,200 women, evaluated personal, social and environmental characteristics and the practice of walking in leisure and commuting domains. hey found that social support from friends was signiicantly associated with walking in the leisure domain (OR = 1.77 CI = 1.39-2.14), but this behavior did not occur in the commuting domain. On the other hand, the same study observed positive association between social support from family and walking in the commuting domain, a fact that was not observed in our results.
he results found in this study demonstrate that no variable of percep-tion of built environment was signiicantly associated with walking in the leisure domain. However, variable social environment represented by the invitation of friends, was considered important to explain the involvement in this type of activity.
the environment is in fact the cause for the practice of walking. Another problem that may have occurred is that the residence time in the neighbor-hood may be related to the way people perceive the environment around their homes; however, this limitation was minimized by the fact that 89% of subjects live more than one year in the neighborhood.
In addition, another problem that may have inluenced the results refers to the notion of proximity. As it was deined as the distance equivalent to 10 minutes of walking, people may have had diferent notions for such distances. Finally, the sample size calculation used is not speciic for the estimation of associated factors and thus, it is possible that some associa-tions have been harmed due to the lack of statistical power.
CONCLUSION
his study identiied some perceived environmental attributes that are dif-ferently associated with walking in the commuting and leisure domains. For walking in the leisure domain, social support from friends was more important than attributes of the physical environment. For walking in the commuting domain, only the perception of the presence of crosswalks was associated.
hese results reinforce that public policies to promote walking should consider both variables related to the environment as those related to social support.
REFERENCES
1. Lee IM, Shiroma EJ, Lobelo F, Puska P, Blair SN, Katzmarzyk PT. Efect of physical inactivity on major non-communicable diseases worldwide: an analysis of burden of disease and life expectancy. he lancet 2012;380(9838):219-29.
2. Lee IM, Buchner DM. he importance of walking to public health. Med Sci Sports Exerc 2008;40(7 Suppl):S512-8.
3. Ogilvie D, Foster CE, Rothnie H, Cavill N, Hamilton V, Fitzsimons CF, Mutrie N. Interventions to promote walking: systematic review. BMJ 2007;334(7605):1204. 4. Hallal PC, Andersen LB, Bull FC, Guthold R, Haskell W, Ekelund U. Physical
ac-tivity levels of the world’s population: Surveillance progress, gaps and prospects. he lancet 2012;380(9838):247-57.
5. CNI – IBOPE. Retratos da sociedade Brasileira: locomoção urbana. Brasília, 2011. Available from: http://www.cni.org.br/portal/data/iles/FF80808131D306B- 60131D9067A4F0083/Pesquisa%20CNI_IBOPE%20Retratos%20da%20Socie-dade%20Brasileira%20Locomocao%20urbana%20Agosto%202011.pdf [2013 Jun 4]. 6. Gomes GAO, Reis RS, Parra DC, Ribeiro I, Hino AAF, Hallal PC, et al. Walking for
leisure among adults from three Brazilian cities and its association with perceived environment attributes and personal factors. Int J Behav Nutr Phys Act 2011; 8(111). Doi:10.1186/1479-5868-8-111
8. Bauman AE, Reis RS, Sallis JF, Wells JC, Loos RJF, Martin BW. Correlates of physi-cal activity: why are some people physiphysi-cally active and others not? he lancet 2012; 380(9838):258-71.
9. Van Cauwenberg J, De Bourdeaudhuij I, De Meester F, Van Dyck D, Salmon J, Clarys P, et al. Relationship between the physical environment and physical activity in older adults : A systematic review. Health & Place 2011;17(2):458-69.
10. Salvador EP, Reis RS, Florindo AA. Practice of walking and its association with perceived environment among elderly Brazilians living in a region of low socio-economic level. Int J Behav Nutr Phys Act 2010; 7:67.
11. Reis RS, Hino AAF, Parra SCP. Bicycling and Walking for Transportation in hree Brazilian Cities. Am J Prev Med 2013;44(2):e9-e17.
12. Salvador EP, Reis RS, Florindo AA. Prática de caminhada como forma de deslo-camento e sua associação com a percepção do ambiente em idosos. Rev. bras. ativ. fís. saúde. 2009;14(3):197-205.
13. Florindo AA, Salvador EP, Reis RS, Guimarães VV. Percepção do ambiente e prática de atividade física em adultos residentes em região de baixo nível socioeconômico. Rev saúde pública 2011;45(2):302-10.
14. IBGE - Instituto Brasileiro de Geograia e Estatística. Dados sociodemográicos da população do município de Rio Claro- SP. Available from: http://www.censo2010. ibge.gov.br/painel/?nivel=mn [2012 Jan 25].
15. Programa das Nações Unidas para o Desenvolvimento. Tabelas de ranking do IDH-M. Available from: http://www.pnud.org.br/atlas/tabelas/index.php [2013 May 16] 16. Kish LA. Procedure for Objective Respondent Selection within the Household. J
Am Stat Assoc 1949;44(247):380-7.
17. Malavasi LM, Duarte MFS, Both J, Reis RS. Escala de mobilidade ativa no ambiente comunitário – NEWS Brasil: retradução e reprodutibilidade. Rev Bras Cineantro-pom Desempenho Hum 2007;9(4):339-50.
18. ABEP – Associação Brasileira de Empresas de Pesquisa. Critérios de classii-cação econômica Brasil. Available from: <http://www.abep.org/novo/Content. aspx?ContentID=301 [2013 May 8].
19. Speed FM, Hocking RR. he use of the R-notation with unbalanced data. Am Stat. 1976; 30(1):30-3.
20. Erke A, Elvik R. Making Vision Zero real: Preventing pedestrian accidents and making them less severe. Institute of Transport Economics 2007. Available from: http://cycle-helmets.com/norway.pdf [2012 May 3].
21. King MJ, Soole D, Ghafourian A. Illegal pedestrian crossing at signalised inersec-tions: incidence and relative risk. Accid Anal Prev 2009; 41(3):485-90.
22. Santos MJ, Kassouf AL. Estudos econômicos das causas da criminalidade no Brasil: evidências e controvérsias. Economia 2008, 9(2):343-72.
23. Pucher J, Buehler R, Merom D, Bauman . Walking and cycling in the United States, 2001-2009: evidence from the National Household Travel Surveys. Am J Public Health. 2011; 101(1Suppl):310-7.
24. Hallal PC, Azevedo MR, Reichert FF, Siqueira FV, Araújo CL, et al. Who, when, and how much? Epidemiology of walking in a middle-income country. Am J Prev Med 2005; 28(2):156-61.
25. Granner ML, Sharpe PA, Hutto B, Wilcox S, Addy CL. Perceived Individual , Social , and Environmental Factors for Physical Activity and Walking. J Phys Act Health 2007; 4(3):278-93.
Corresponding author
Inaian Pignatti Teixeira Avenida 24a, 1515
Departamento de Educação Física. Bela Vista
13506-900 - Rio Claro, SP. Brasil E-mail: [email protected]
27. Cutt H, Giles-Corti B, Knuiman M, Timperio A, Bull F. Understanding dog own-ers’ increased levels of physical activity: results from RESIDE. Am J Public Health 2008; 98(1):66-9.
28. Giles-Corti B, Donovan RJ. Relative inluences of individual, social environmen-tal, and physical environmental correlates of walking. Am J Public Health 2003. 93(9):1583-9.