ACPD
9, 13199–13233, 2009Trends in integrated water vapor from ground-based FTIR
R. Sussmann et al.
Title Page
Abstract Introduction
Conclusions References
Tables Figures
◭ ◮
◭ ◮
Back Close
Full Screen / Esc
Printer-friendly Version
Interactive Discussion
Atmos. Chem. Phys. Discuss., 9, 13199–13233, 2009 www.atmos-chem-phys-discuss.net/9/13199/2009/ © Author(s) 2009. This work is distributed under the Creative Commons Attribution 3.0 License.
Atmospheric Chemistry and Physics Discussions
This discussion paper is/has been under review for the journalAtmospheric Chemistry
and Physics (ACP). Please refer to the corresponding final paper inACPif available.
Technical Note: New trends in
column-integrated atmospheric water
vapor – Method to harmonize and match
long-term records from the FTIR network
to radiosonde characteristics
R. Sussmann1, T. Borsdorff1, M. Rettinger1, C. Camy-Peyret2, P. Demoulin3, P. Duchatelet3, E. Mahieu3, and C. Servais3
1
Research Center Karlsruhe, IMK-IFU, Garmisch-Partenkirchen, Germany
2
Laboratoire de Physique Mol ´eculaire pour l’Atmosph `ere et l’Astrophysique (LPMAA), CNRS/UPMC/IPSL, Paris, France
3
Institute of Astrophysics and Geophysics, University of Li `ege, Li `ege, Belgium
Received: 5 May 2009 – Accepted: 29 May 2009 – Published: 16 June 2009
Correspondence to: R. Sussmann ([email protected])
ACPD
9, 13199–13233, 2009Trends in integrated water vapor from ground-based FTIR
R. Sussmann et al.
Title Page
Abstract Introduction
Conclusions References
Tables Figures
◭ ◮
◭ ◮
Back Close
Full Screen / Esc
Printer-friendly Version
Interactive Discussion
Abstract
We present a method for harmonized retrieval of integrated water vapor (IWV) trends from existing, long-term, measurement records at the ground-based mid-infrared solar FTIR spectrometry stations of the Network for the Detection of Atmospheric Composi-tion Change (NDACC). CorrelaComposi-tion of IWV from FTIR with radiosondes shows an ideal
5
slope of 1.00(3). This optimum matching is achieved via tuning one FTIR retrieval pa-rameter, i.e., the strength of a Tikhonov regularization constraining the derivative (with
respect to height) of retrieved water profiles given in per cent difference relative to an
a priori profile. All other FTIR-sonde correlation parameters (intercept=0.02(12) mm,
bias=0.02(5) mm, standard deviation of coincident IWV differences (stdv)=0.27 mm,
10
R=0.99) are comparable to or better than results for all other ground-based IWV
sound-ing techniques given in the literature. An FTIR-FTIR side-by-side intercomparison
re-veals a strong exponential increase instdv as a function of increasing temporal
mis-match starting at∆t∼1 min. This is due to atmospheric water vapor variability. Based
on this result we derive an upper limit for the precision of the FTIR IWV retrieval for the
15
smallest ∆t(=3.75 min) still giving a statistically sufficient sample (32 coincidences),
i.e., precision (IWVFTIR)<0.05 mm (or 2.2% of the mean IWV). The bias of the IWV
re-trievals from the two different FTIR instruments is nearly negligible (0.02(1) mm). The
optimized FTIR IWV retrieval is set up in the standard NDACC algorithm SFIT 2 with-out changes to the code. A concept for harmonized transfer of the retrieval between
20
different stations deals with all relevant control parameters; it includes correction for
differing spectral point spacings (via regularization strength), and final quality selection
of the retrievals (excluding the highest residuals (measurement minus model), 5% of the total).
The method is demonstrated via IWV trend analysis from the FTIR records at the
25
Zugspitze (47.4◦N, 11.0◦E, 2964 m a.s.l.) and Jungfraujoch (46.5◦N, 8.0◦E, 3580 m
ACPD
9, 13199–13233, 2009Trends in integrated water vapor from ground-based FTIR
R. Sussmann et al.
Title Page
Abstract Introduction
Conclusions References
Tables Figures
◭ ◮
◭ ◮
Back Close
Full Screen / Esc
Printer-friendly Version
Interactive Discussion
confidence) via bootstrap resampling. For the Zugspitze a significant trend of 0.79
(0.65, 0.92) mm/decade is found for the time interval (1996–2008). There is a
sig-nificantly increased trend of 1.41 (1.14, 1.69) mm/decade in the second part of the
time series (2003–2008) compared to 0.63 (0.20, 1.06) mm/decade in the first part
(1996–2002). For the Jungfraujoch no significant trend is found in any of the periods
5
(1988–2008), (1996–2008), (1996–2002), or (2003–2008). The results imply either an altitude dependency with a significantly higher trend below 3.58 km than above, and/or
strong, regional variations of IWV trends on the scale of∼250 km. This is in line with
a widespread, complex, IWV trend picture over Eurasia during the last decades. Our paper provides a basis for future exploitation of more than a dozen existing,
multi-10
decadal FTIR measurement records around the globe for joint IWV trend studies within NDACC that complement existing trend data sets which are based primarily on ra-diosondes.
1 Introduction
Integrated water vapor (IWV) is a key climate variable. In the lower troposphere,
con-15
densation of water vapor into precipitation provides latent heat which dominates the structure of tropospheric diabatic warming. Water vapor is also the most important gaseous source of infrared opacity in the atmosphere. It accounts for about 60% of
the natural greenhouse effect for clear skies and provides the largest positive feedback
in model projections of climate change. Accurate measurements of IWV are therefore
20
one of the most important input parameters for climate models, i.e. measured IWV trends are important because they may be indicators of anthropogenic climate change. However, evidence for long-term changes in IWV is limited by the availability and quality of measurements (Trenberth et al., 2007).
Data for the last three or four decades of the twentieth century indicate an increase
25
El-ACPD
9, 13199–13233, 2009Trends in integrated water vapor from ground-based FTIR
R. Sussmann et al.
Title Page
Abstract Introduction
Conclusions References
Tables Figures
◭ ◮
◭ ◮
Back Close
Full Screen / Esc
Printer-friendly Version
Interactive Discussion
liott, 2001). However, homogeneity of the radiosonde records was affected by changes
in instrumentation and reduction of sounding activities. E.g., the major changes in US radiosonde types at the end of 1995 led to spurious changes dependent on time of observation, elevation, location, and season. In terms of moisture, there was a spuri-ous drying, but mainly in the upper troposphere. In the lower troposphere, the relative
5
humidity decreased from 5% to 8% with the switch from VIZ to Vaisala sondes (Elliott et al., 2002). A series of changes were made in the Vaisala sensor types used at oper-ational stations in the first few years after 2000 and significant inter-sensor biases have been identified (e.g., Miloshevich et al., 2006).
Beginning in 1987, satellite-based data from microwave instruments provided
10
improved observations of IWV. For example, data from the Special Sensor Mi-crowave/Imager (SSM/I) have been exploited for investigation of IWV trends (Wentz and Schabel, 2000). However, key aspects of any, satellite-based dataset used to study decadal or longer timescales are changes in instrumentation and algorithms. For instance, the number of SSM/I instruments used in the NASA Water Vapor Project
15
(Randel et al., 1996; Vonder Haar et al., 2003) dataset has ranged from one (1988– 1992) to three (Vonder Haar et al., 2005). So it is not surprising that a number of pub-lications have noted that statistically significant, long-term trends in climate variables
are difficult to derive from satellite data because of problems with satellite
intercalibra-tion and sensor drift (Hurrel and Trenberth, 1997, 1998; Christy et al., 1998; Wenz
20
and Schabel, 1998; Trenberth et al., 2007). First satellite based IWV trend studies via ERS-2/GOME and ENVISAT/SCIAMACHY data were reported only recently (Wagner et al., 2006; Mieruch et al., 2008).
Clearly, it is important to re-examine internally consistent, existing and ongoing long-term records from other independent sounding techniques that contain information on
25
IWV. One valuable source of data has turned out to be ground-based microwave ra-diometry (e.g., Morland et al., 2006; Fiorucci et al., 2008). Such measurements are
being carried out to some extent within the NDACC1 network, which is dedicated to
1
ACPD
9, 13199–13233, 2009Trends in integrated water vapor from ground-based FTIR
R. Sussmann et al.
Title Page
Abstract Introduction
Conclusions References
Tables Figures
◭ ◮
◭ ◮
Back Close
Full Screen / Esc
Printer-friendly Version
Interactive Discussion
long-term, ground-based, atmospheric sounding observations at many stations around the globe.
In addition, long-term observations using ground-based, mid-infrared solar FTIR
spectrometry are organized within NDACC by the IRWG2. At its annual meetings
dur-ing the last 15 years or so, a best-practice for FTIR measurements has been set up.
5
This guarantees both high-level inter-station comparability and long-term stability of the measurements. Recently, IRWG activities have been extended to support harmoniza-tion of retrieval approaches.
This paper is a contribution to this effort. Although FTIR has been used for retrieval
of numerous other species, it is clear that solar infrared spectra contain a considerable
10
amount of information on water vapor as well. However, up to now there have been few
attempts to retrieve water vapor from FTIR. The lack of sufficiently accurate
spectro-scopic data in the spectral domains of interest has been a major hindrance. However, it has been shown by Sussmann and Camy-Peyret (2002) that using the new, mid-infrared, water vapor spectroscopy from Toth and coworkers included in HITRAN 2000
15
(Rothmann et al., 2003) that information on water in the 11.7–11.9 µm region from solar spectra can be retrieved without the severe, spectral residuals due to line parameter errors left by HITRAN 1996 (see Figs. 9–14 in Sussmann and Camy-Peyret, 2002). Subsequently, Schneider et al. (2006) showed the first water vapor profile retrieval from ground-based FTIR spectrometry. This retrieval was optimized to obtain profile
20
information, especially in the upper troposphere.
Retrievals of IWV from NDACC-type FTIR measurements still need to be systemati-cally optimized before best-possible IWV data for trend studies can be obtained. There are more than a dozen FTIR stations around the globe with time series data covering more than one decade so that it is possible to create a substantial, complementary
25
IWV set of trends.
The purpose of this paper is to develop an FTIR retrieval optimized for IWV which can be used to complement the radiosonde records. Section 2 presents a new method
2
ACPD
9, 13199–13233, 2009Trends in integrated water vapor from ground-based FTIR
R. Sussmann et al.
Title Page
Abstract Introduction
Conclusions References
Tables Figures
◭ ◮
◭ ◮
Back Close
Full Screen / Esc
Printer-friendly Version
Interactive Discussion
for optimizing IWV retrievals from FTIR measurements so that they match radiosonde characteristics. It includes a concept for station-to-station harmonization of the retrieval as well as error characterization. Section 3 demonstrates the method via retrieval of harmonized IWV series from the long-term FTIR records obtained at the Zugspitze (1996–2008) and Jungfraujoch (1988–2008) NDACC stations. It presents the analysis
5
of IWV trends and their significance and discusses the trend results. In Sect. 4, we summarize our work and its potential in global trend studies.
2 Method
2.1 Retrieval strategy
An IWV retrieval from ground-based, mid-infrared solar FTIR spectrometry has been
10
set up to i) yield an accuracy and precision comparable to the best among the other ground-based IWV sounding techniques, ii) match IWV retrieval response with stan-dard radiosonde characteristics (i.e., correlation slope equals 1.0), and iii) implement it in the retrieval algorithm SFIT 2 (Pougatchev et al., 1995), which is the standard within the NDACC IRWG, without performing any changes to the code. The retrieval
15
is thereby easily transferable to all ground-based, FTIR measurement stations of the NDACC network.
The classical approach to retrieve column integrated quantities from ground-based FTIR spectrometry has used least squares spectral fitting with iterative scaling of an
(inflexible)VMR3a priori profile via one (unconstrained) altitude-constant factor (e.g.,
20
Rinsland et al., 1984). Because of the free scaling, this approach has the advantage that it does not damp true column variability in the retrieval. However, it frequently leads to significant spectral residuals (measurement minus model). This is because of i) likely discrepancies of the shape of the true profile relative to the a priori profile and
3
ACPD
9, 13199–13233, 2009Trends in integrated water vapor from ground-based FTIR
R. Sussmann et al.
Title Page
Abstract Introduction
Conclusions References
Tables Figures
◭ ◮
◭ ◮
Back Close
Full Screen / Esc
Printer-friendly Version
Interactive Discussion
ii) possible spectral line shape errors in the forward calculation and/or the
measure-ment. Both effects can introduce significant biases to the retrieved columns.
A strategy to reduce this problem is to derive total columns from (flexible) profile retrievals which help to better integrate the area of the measured absorption line shape and thereby obtain a more accurate estimate of the total column integral (even allowing,
5
to some extent, for retrieval of unphysical profile shapes to compensate for line shape errors). Up to now, most profile retrievals from solar FTIR spectrometry have been regularized via diagonal a priori covariance matrices. This type of profile retrieval has, however, the tendency to damp variability in the retrieved total columns as a result of profile smoothing at the cost of any deviation between the retrieved profile and the
10
a priori profile. In particular, this damping is a critical issue in the case of water vapor because of its high natural variability, which covers more than one order of magnitude in IWV.
Therefore, we have developed an IWV retrieval that combines the advantages of both a profile scaling and a profiling approach while avoiding their disadvantages at
15
the same time. In other words, we construct a regularization matrix that allows for some (constrained) flexibility in profile shape (degree of flexibility to be tuned) and also guarantees that pure profile-scaling type variations remain unconstrained. This is achieved by imposing a Tikhonov first order smoothing constraint to retrieve per cent
changes of the water vapor VMR profile relative to the a priori profile. Part of the
20
strategy to optimally constrain the total water vapor column is to search for a set of spectral microwindows which contain information on the water vapor profile throughout the troposphere.
2.2 Retrieval set up
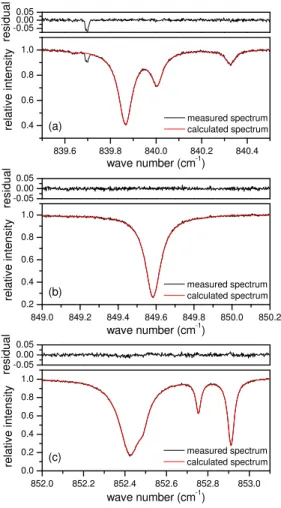
Figure 1 shows the spectral microwindows (i.e., the measurement vectory) which have
25
been selected from a spectroscopic point of view with two different targets in mind.
First, these windows completely avoid interference errors (Sussmann and Borsdorff,
ACPD
9, 13199–13233, 2009Trends in integrated water vapor from ground-based FTIR
R. Sussmann et al.
Title Page
Abstract Introduction
Conclusions References
Tables Figures
◭ ◮
◭ ◮
Back Close
Full Screen / Esc
Printer-friendly Version
Interactive Discussion
one small and narrow solar OH line seen in Fig. 1a. Since it is difficult to perfectly
simu-late such lines, we eliminated any resulting perturbations of the retrieval by deweighting
theSε matrix accordingly (i.e., setting the signal-to-noise ratio to zero in the spectral
vicinity of this line). Second, the microwindows are selected to yield sensitivity for wa-ter vapor variations throughout the whole troposphere to constrain the total column
5
in the best possible way for a wide range of IWV levels. This is achieved by a using well-balanced mixture of strong and weak absorption lines.
The forward modelFmaps the water vapor profiles to be retrieved from state space
xinto measurement spacey. Figure 1 shows the final forward calculation of a retrieval
performed using the HITRAN 2000 line parameters compilation (Rothman et al., 2003).
10
The residuals in Fig. 1 show a perfect fit down to the noise level without any systematic residuals due to spectroscopic errors.
The retrieval is the (ill-posed) inverse mapping from y tox which is formulated as
a least squares problem. Due to the non-linearity ofF, a Newtonian iteration is applied
and a regularization termR ∈ ℜ.n×n is used that allows one to constrain the solution
15
and thereby avoid oscillating profiles
xi+1=xi +
KTx, iS−ε1Kx, i +R
−1
×nKT x, iS
−1
ε [y−F(xi)]−R(xi −xa)
o, (1)
where the subscript i denotes the iteration index and xa is the a priori profile. Here
Kx=∂F/∂xare the Jacobians andSεis the measurement covariance (assumed to be
diagonal with a signal-to-rms-noise ratio of 100 in our formulation). Using Tikhonov
20
regularization (Tikhonov, 1963),Ris setup by the relation
R=αLTL, (2)
ACPD
9, 13199–13233, 2009Trends in integrated water vapor from ground-based FTIR
R. Sussmann et al.
Title Page
Abstract Introduction
Conclusions References
Tables Figures
◭ ◮
◭ ◮
Back Close
Full Screen / Esc
Printer-friendly Version
Interactive Discussion
operatorL=L1
L1=
−1 1 0 . . .0
0 −1 1 . .. ...
..
. . .. ... ... 0 0 . . . 0 −1 1
∈ ℜn×(n−1), (3)
which constrains x in a way such that a constant profile is favored for the difference
x−xa. The prior xa is given in Fig. 2. It was constructed using data from a 3-month
radiosonde campaign at the Zugspitze (see Sect. 2.3 for details). We use the mean
5
profile scaled by 0.25 because otherwise retrievals for the driest days are not able to calculate a reasonable first iteration (because of saturated lines with no distinct line center position in a high IWV initial forward calculation).
The state vector x is set up on a 66-layer scheme with an exponential increase
of layer width (0.162 km width for first layer above the Zugspitze site at 2964 m a.s.l.
10
up to 5.292 km width for the last layer ending at 100 km a.s.l.). The state vectorx is
implemented in units of (dimensionless) scaling factors for the 66 layers relative to the
a priori VMR profile (standard setting in SFIT 2). Therefore, the limiting caseα → ∞
represents free scaling of the a priori VMR profile with one altitude-constant factor
(i.e., an infinitely strong constraint to the profile shape and a zero constraint to the
15
absolute value of the column). The limiting caseα → 0 describes a retrieval without
any regularization (which will suffer from oscillating profiles). The tuning of αto achieve
an optimum IWV retrieval is described in the next section.
2.3 Matching FTIR to radiosonde characteristics
Section 2.2 left open the question of how to find an optimum setting forα. Figure 3a
20
shows the correlation of IWV retrievals from Zugspitze FTIR measurements to
coin-cident radiosondes for varied settings of α. Clearly, there is an impact of α on the
ACPD
9, 13199–13233, 2009Trends in integrated water vapor from ground-based FTIR
R. Sussmann et al.
Title Page
Abstract Introduction
Conclusions References
Tables Figures
◭ ◮
◭ ◮
Back Close
Full Screen / Esc
Printer-friendly Version
Interactive Discussion
the scatter plot. Figure 3b shows all correlation parameters derived from the scatter plots of Fig. 3a (and from a few more scatter plots which are not shown) as a function
of α. It can be seen that an optimum correlation (i.e., slope=1.0) can be achieved
forαopt=183, corresponding to adofs4of 1.84. Figure 3c shows the underlying
scat-ter plot for this optimum setting with R=0.99, slope=1.00 and a negligible bias and
5
intercept of 0.015 mm5. This means that it is possible to obtain a high-quality match
between the FTIR retrieval and the radiosonde response, i.e., the measurements of
the sonde and the FTIR no longer differ by a scaling factor after the matching.
Data for the 25 FTIR-sonde coincidences in Fig. 3 have been obtained during the (19 Aug 2002–17 Nov 2002) AIRS validation campaign (Sussmann and Camy-Peyret,
10
2002, 2003) with FTIR measurements at the Zugspitze (47.4◦N, 11.0◦E, 2964 m a.s.l)
and 180 radiosondes launched at Garmisch (47.5◦N, 11.1◦E, 734 m a.s.l.).
The 25 IWV data from Zugspitze FTIR (y-axis in Fig. 3a, c) were obtained by
av-eraging the IWV typically retrieved from 3–4 individual spectra (each obtained from
15–20 min integration) recorded within ±1 hour around a ∼12:00 UT fixed time (i.e.,
15
the time of AIRS overpasstop).
The 25 IWV data from the Garmisch radiosondes (x-axis in Fig. 3a, c) were each
ob-tained from integration of one “Tobin-sonde” VMR profile above the Zugspitze altitude. This profile was derived from a pair of soundings according to the “best-estimate of the state of the atmosphere” principle (Tobin et al., 2006). I.e., a first sonde was launched
20
1 h beforetopand a second sonde 5 min beforetop. The best estimated humidity profile
for the overpass timeVMRTobin(z, top) was then constructed via inter-/extrapolation of
the two soundings according to the relation
VMRTobin(z, top)=VMRsonde(z, t0)+(dVMR(z)/dt)(top−t0), (4)
where for t0 one uses the time of either of the two sondes at a level z as a starting
25
point. See Fig. 3 in Sussmann and Camy-Peyret (2002) for an example.
4
degreesoffreedom ofsignal, i.e., the spur of the averaging kernel matrix
5
ACPD
9, 13199–13233, 2009Trends in integrated water vapor from ground-based FTIR
R. Sussmann et al.
Title Page
Abstract Introduction
Conclusions References
Tables Figures
◭ ◮
◭ ◮
Back Close
Full Screen / Esc
Printer-friendly Version
Interactive Discussion
For this purpose two sonde receivers were used operating on two different
frequen-cies in parallel (Vaisala Digicora III, Marwin 21, SPS220G sounding processor). Vaisala RS80-30G radio sondes were used (A-Humicap sensor). Several studies have been carried out to assess water vapor measurement accuracy of the RS80-A sonde and
de-velop corrections for different classes of errors (Wang et al., 2002; Miloshevich et al.,
5
2001, 2004, 2006; Leiterer et al., 2005; Suortti et al., 2008). Since we are interested
in IWV, we quantified the known effect of the temperature-dependent dry bias (mainly
at low temperatures) by applying the correction suggested by Leiterer et al. (2005); to
visualize this see Fig. 1 (left center image) in Suortti et al. (2008). The effect of the
correction on IWV is only of the order of 1 permille. We did not perform corrections for
10
a possible overall bias from chemical contamination (e.g., term∆1U in Leiterer et al.,
2005), because i) no statistical correction data are available for our RS80-A production batch, ii) our later trend analysis is not impacted by the possible existence of FTIR bi-ases, and iii) there is no significant overall bias of our optimized FTIR retrieval versus the sondes (Fig. 3c).
15
2.4 Precision and bias
Two FTIR instruments are operated side-by-side at the Jungfraujoch, one Bruker IFS 120 HR and one home-made instrument (see Sect. 3.1 for information on instruments and site). We transferred the optimized IWV retrieval developed and tested for the Zugspitze FTIR to the two Jungfraujoch instruments (see Sect. 2.6 for the transfer
pro-20
cedure). We have further taken advantage of the quasi-simultaneous measurements available from the two Jungfraujoch time series (essentially in the 1995–2001 time span) to derive precision and bias of the IWV retrieval. See Table 2 for the result.
The given numbers were derived as follows. We applied different temporal
coinci-dence criteria∆t to the individual column retrievals of the two time series and created
25
a scatter plot for each coincidence ensemble. From these scatter plots we obtained the
standard deviationstdv of the differences of coincident FTIR pairs as a function of∆t,
ACPD
9, 13199–13233, 2009Trends in integrated water vapor from ground-based FTIR
R. Sussmann et al.
Title Page
Abstract Introduction
Conclusions References
Tables Figures
◭ ◮
◭ ◮
Back Close
Full Screen / Esc
Printer-friendly Version
Interactive Discussion
to an monotonous increase ofstdv. I.e., atmospheric variability dominates stdv even
at the smallest time scale of minutes. Unfortunately one cannot use ∆t=0 because
there is a tradeoffbetween reducing∆tand the number of remaining coincidences. In
our case, we stopped at∆t=3.75 min which still gave 32 coincidences. So in general,
the strictest temporal coincidence criterion which gives a sufficient statistical sample
5
of coincidences would ideally be used to derive an estimate of IWV measurement pre-cision from side-by side intercomparisons. Even in so doing, the estimate will always
be an upper limit. For ∆t=3.75 min, we obtain stdv=0.07 mm (3.1% of mean IWV)
for the pairwise differences. Under the simplifying assumption of identical precision
for both FTIR systems, we calculate for the precision prec of one FTIR instrument:
10
prec<stdv/sqrt(2)=0.05 mm (orprec<2.2% of mean IWV).
A nearly negligible bias of 0.02(1) mm is found between the two Jungfraujoch FTIR instruments (for∆t=3.75 min). Note in Table 1, that the bias is not significantly altered
when∆t is increased to 120 min.
2.5 Comparison to other techniques
15
Table 1 shows examples of comparisons of the different ground-based remote sounding
techniques with radiosondes. First of all we discuss the comparison of the Zugspitze FTIR with Tobin sondes (4th row): The perfect slope of 1.00(3) is the result of our matching procedure where the intercept of 0.02(12) as well as the bias of 0.02(5) are
negligibly small. Thestdv of the coincident differences is 0.27 mm (or 7.9%), which is
20
much higher than thestdv=0.07 mm found in the FTIR-FTIR side-by-side
intercompar-ison for∆t=3.75 min (1st row in Table 1). Clearly, thestdv of 0.27 mm is dominated by
atmospheric variability within the coincidence interval∆t=120 min and the 8 km
hori-zontal distance∆x between the FTIR and the sonde launching site. This interpretation
is in line with the observation that nearly the same stdv, i.e., 8.0%, is found in the
25
FTIR-FTIR side-by-side intercomparison for∆t=120 min (3rd row in Table 1). In other
ACPD
9, 13199–13233, 2009Trends in integrated water vapor from ground-based FTIR
R. Sussmann et al.
Title Page
Abstract Introduction
Conclusions References
Tables Figures
◭ ◮
◭ ◮
Back Close
Full Screen / Esc
Printer-friendly Version
Interactive Discussion
sounder has good precision as is the case for the FTIR.
As an example for a ground-based microwave instrument, we show the sonde-correlation data for TROWARA (taken from Morland et al., 2006) in the 5th row of
Table 1. The slope is 0.88, the intercept 1.36 mm, and the bias 0.36 mm. Thestdv of
2.02 mm is relatively high. This is a result of the large distance between TROWARA and
5
the launching site of the sondes (∆x=40 km), i.e., the observed stdv=2.02 mm is not
an appropriate measure of the (certainly significantly better) precision of TROWARA. Morland et al. (2006) report correlating GPS and sun photometer (PFR) data with sondes (6th and 7th row of Table 1). The PFR shows a smaller bias (0.08 mm) than the
GPS (0.53 mm). For both intercomparisons a relatively highstdv on the order of 1 mm
10
is found, which is again certainly a result of the large∆x=80 km.
The FTIR-sonde correlation data shown in the 8th row of Table 1 have been taken from Palm et al. (2008). The slope is 0.85(1) and the intercept 0.66(9) mm. Comparing these numbers to the FTIR-sonde slope of 1.00(3) and intercept of 0.02(12) mm from our work (4th row), one has to keep in mind that the Palm et al. (2008) results originate
15
from an FTIR retrieval which is different than the one described in our work.
The intercomparison data of BASIL (Raman lidar) and GBMS (microwave) with son-des (9th sand 10th row of Table 1) were taken from Fiorucci et al. (2008). Both instru-ments show slopes very close to 1, very small intercepts and biases below 0.1 mm. The
stdvis also very small which is the result of the very strict, temporal coincidence criteria
20
(∆t=20 min) and the fact that the sondes were launched right next to the ground-based
vertical sounder (∆x=0).
2.6 Station-to-station harmonization
A crucial point of our approach is that it is implemented in the community-retrieval algorithm SFIT 2 (Pougatchev et al., 1995) without performing any changes to the
25
ACPD
9, 13199–13233, 2009Trends in integrated water vapor from ground-based FTIR
R. Sussmann et al.
Title Page
Abstract Introduction
Conclusions References
Tables Figures
◭ ◮
◭ ◮
Back Close
Full Screen / Esc
Printer-friendly Version
Interactive Discussion
the Zugspitze and Jungfraujoch NDACC stations.
The algorithm harmonization is achieved via exchange of only a few control files, i.e., “binput” (containing among other fitting parameters the definition of microwindows shown in Fig. 1), “refmod” (containing the a priori profile given in Fig. 2; it should be ap-plicable to all stations because there is no strong gradient around the tropopause), and
5
the “cfgl-files” (containing the spectroscopic line list). Care has to be taken to use the same rule for setting up the exponential retrieval layer grid as described in Sect. 2.2 at all stations (“bnd-file”). This is important because the strength and altitude dependency
of the effective regularization scheme depends on the details of the vertical grid.
In order to find a harmonized optimum α value for each station, clearly, the best
10
approach would be to use a set of coincident radiosondes and follow the approach described for the Zugspitze in Sect. 2.3 for the other stations. However, if this kind of data is not available for some stations or if the stations have similar geophysical characteristics (IWV levels, station altitude), a simplified approach would be to just
use the same value of αopt=183 as found for the Zugspitze. However, in so doing
15
one has to take into account that effective regularization strength depends linearly on
spectral point spacingp. Therefore, possible station-to-station differences inpshould
be compensated for by correctingα according to the relation
αstation/ αZugspitze=pZugspitze/ pstation, (5)
withαZugspitze=183 andpZugspitze=0.0015 cm
−1
as reference.
20
Finally, harmonizing the procedure for final quality selection of the IWV retrievals
at different stations is an important task. For this purpose, a threshold for the
root-mean-square (rms) residuals of the spectral fit was used. A value for the threshold was derived by inspection of the probability distribution of all residuals of the Zugspitze time series. This distribution is right skewed with only 5% of the retrievals showing
25
ACPD
9, 13199–13233, 2009Trends in integrated water vapor from ground-based FTIR
R. Sussmann et al.
Title Page
Abstract Introduction
Conclusions References
Tables Figures
◭ ◮
◭ ◮
Back Close
Full Screen / Esc
Printer-friendly Version
Interactive Discussion
the rms residuals at each station so that∼5% of the IWV retrievals, i.e. those with the
largest residuals, are excluded.
3 Results and discussion
3.1 Harmonized Zugspitze and Jungfraujoch FTIR time series
The Zugspitze (47.4◦N, 11.0◦E, 2964 m a.s.l) solar FTIR system was set up in 1995 as
5
part of the “Alpine Station” of the NDACC network. It is operated by the Group
“Vari-ability and Trends” at IMK-IFU6, Research Center Karlsruhe, together with a variety of
additional sounding systems at the Zugspitze/Garmisch site. These include an NDACC aerosol lidar and an NDACC UV spectroradiometer. The FTIR team contributes to satellite validation and studies of atmospheric variability and trends (e.g., Sussmann
10
and Buchwitz, 2005; Sussmann et al., 2005a, b). The FTIR system is based upon a Bruker IFS125HR interferometer; details can be found in Sussmann and Sch ¨afer (1997). The spectra used for IWV retrieval have been recorded with an optical path
difference (OPD) of typically 250 cm, averaging a number of 8 scans (15–20 min
inte-gration time). Pressure-temperature profiles, necessary for the inversion, have been
15
taken from the National Center for Environmental Prediction (NCEP) automailer. For quality selection of the IWV retrievals, a threshold for the rms residuals of the spectral fit was used (see Sect. 2.6 for details). The resulting Zugspitze time series including the years 1996–2008 comprises IWV retrievals from a number of 5815 individual spectra
as displayed in Fig. 5. The retrievals contain a meandofsof 1.88.
20
High-resolution FTIR solar absorption spectra are regularly recorded at the
Jungfrau-joch station (46.5◦N, 8.0◦E, 3580 m a.s.l.) since 1984, with a home-made instrument
installed at the Coud ´e focus of the Jungfraujoch telescope. In 1990, a commercial
6
ACPD
9, 13199–13233, 2009Trends in integrated water vapor from ground-based FTIR
R. Sussmann et al.
Title Page
Abstract Introduction
Conclusions References
Tables Figures
◭ ◮
◭ ◮
Back Close
Full Screen / Esc
Printer-friendly Version
Interactive Discussion
Bruker IFS120HR has augmented the observational capacity of the site. Both spec-trometers are maintained and operated by the GIRPAS group of the University of Li `ege (Groupe Infra-Rouge de Physique Atmosph ´erique et Solaire). More information on these instruments and on important related key findings can be found in Zander et al. (2008) and references therein. Jungfraujoch data are further used for the calibration
5
and validation of atmospheric space-based sensors (e.g., Mahieu et al., 2008). The spectra from the home-made instrument used here have been recorded with OPD of 82 cm, including 7 scans per spectrum for an integration time of 37 min. For the Bruker instrument, the OPD was either equal to 82 or 125 cm, averaging 6 or 18 scans per spectrum, with resulting integration times ranging from 3 to 15 min. Assumed
pressure-10
temperature profiles were also provided by NCEP.
The retrievals of the two different Jungfraujoch FTIRs were harmonized with the
op-timized, Zugspitze FTIR retrieval as described in Sect. 2.6. In particular, the spectral
point spacings of the two Jungfraujoch FTIRs (0.0061 cm−1for the home-made
instru-ment and 0.0038 cm−1 for the Bruker) differ from the one of the Zugspitze instrument.
15
Therefore, the regularization strength for each Jungfraujoch FTIR had to be harmo-nized separately with the Zugspitze instrument according to Eq. (5).
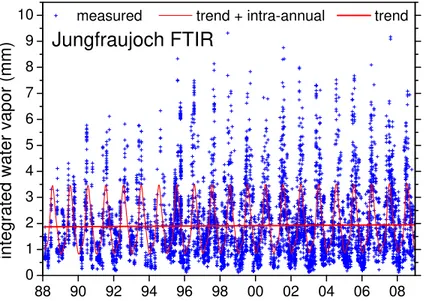
For quality selection of the IWV retrievals, a threshold for the rms residuals was set so as to exclude the highest-rms retrievals (5% of total retrievals) as described above for the Zugspitze. The resulting Jungfraujoch time series from the years 1988–2008
20
comprises IWV retrievals from a number of 8045 individual spectra as displayed in
Fig. 6. The retrievals contain a meandofsof 1.87.
3.2 Trend analysis
The IWV trend results for the Zugspitze and Jungfraujoch time series are given in Ta-ble 3. They have been derived according to the approach described in Gardiner et al.
25
ACPD
9, 13199–13233, 2009Trends in integrated water vapor from ground-based FTIR
R. Sussmann et al.
Title Page
Abstract Introduction
Conclusions References
Tables Figures
◭ ◮
◭ ◮
Back Close
Full Screen / Esc
Printer-friendly Version
Interactive Discussion
confidence limits associated with the trend estimates. For the inter-annual model, a 3rd order Fourier series (a constant and 3 sine and 3 cosine components) is used. In order to investigate the significance of the trends, the null hypothesis was tested for each analysis to verify that “there is no underlying straight-line trend over the time span of the data”, i.e. the gradient of the underlying long-term trend in the regression model is
5
zero. The sampling distribution of the gradient of the underlying straight-line trend term is determined empirically using bootstrap resampling. If the 95% confidence interval associated with the gradient computed from this empirical distribution does not contain zero then, in a formal statistical sense, there is reason to doubt the null hypothesis.
3.3 Discussion of trend results
10
The trend results given in Table 3 can be summarized as follows:
1. The Zugspitze IWV shows a significant positive trend for all of the analyzed time intervals (1996–2008), (1996–2002), and (2003–2008).
2. The Zugspitze trend in the last 6 years (2003–2008) is significantly higher than in the 7 years before (1996–2002).
15
3. The Jungfraujoch time series does not show a significant trend for any of the an-alyzed time intervals (1988–2008), (1996–2008), (1996–2002), or (2003–2008).
We would like to discuss two possible explanations for the significantly different
trends above the Zugspitze and Jungfraujoch where either one or both contribute to
the observed difference to a certain degree. One interpretation could be that the
dif-20
ference in the altitudes of the Zugspitze (2.96 km a.s.l.) and the Jungfraujoch (3.58 km
a.s.l.) is the cause of the observed trend difference. If this were the dominant reason
it would mean that the positive Zugspitze trend in IWV originates from a positive trend below 3.58 km altitude. There is some evidence for this hypothesis from the weakly
sig-nificant positive trend (0.6±0.5 mm/decade) from radiosonde measurements at
Pay-25
Jungfrau-ACPD
9, 13199–13233, 2009Trends in integrated water vapor from ground-based FTIR
R. Sussmann et al.
Title Page
Abstract Introduction
Conclusions References
Tables Figures
◭ ◮
◭ ◮
Back Close
Full Screen / Esc
Printer-friendly Version
Interactive Discussion
joch. The Payerne trend is confirmed by the TROWARA microwave measurements
(0.6±1.5 mm/decade) at Bern (Morland et al., 2006). Together with the finding by Ross
and Elliot (2001) that there were no significant lower-tropospheric trends over Europe in the period (1973–1995) this would indicate that the amount of lower tropospheric water vapor has increased after 1995 over Europe.
5
Another interpretation of the trend difference between the Jungfraujoch and
Zugspitze would be that trend measurements of IWV at a certain site are only
represen-tative on the regional scale and IWV trends can be significantly different on relatively
small spatial scales such as the distance of∼250 km between the Jungfraujoch and the
Zugspitze. This interpretation is confirmed by analysis of satellite data which show that
10
globabally in decadal IWV trends, even on this small spatial scale, significant changes of sign of the trends are the rule rather than the exception above land where the corre-lation to near-surface temperature is less distinct than above the oceans (Vonder Haar et al., 2005; Wanger et al., 2006; Mieruch et al., 2008).
Finally, we want to put our (differing) Zugspitze and Jungfraujoch trend results into
15
a Eurasian to global context which confirms the complexity of the trend picture over the past decades. The main region where positive trends were not evident in the earlier analysis of Ross and Elliott (2001) using data for 1973 through 1995 was over Eurasia and this also appears to be the case from 1988 to 2001 based on ERA-40 data in spite of large, positive trends over the North Atlantic in both SSM/I and ERA-40 data. This
20
is also in spite of generally increasing trends in precipitation in Europe and other mid-latitude regions (Trenberth et al., 2005). However, Philipona et al. (2004) inferred rapid increases in surface water vapor over central Europe during the period from 1995 to 2003. Subsequent analyses (Philipona et al., 2005) confirmed that changes in IWV for this region are strongly coupled to the surface temperature. For central Europe, Auer
25
ACPD
9, 13199–13233, 2009Trends in integrated water vapor from ground-based FTIR
R. Sussmann et al.
Title Page
Abstract Introduction
Conclusions References
Tables Figures
◭ ◮
◭ ◮
Back Close
Full Screen / Esc
Printer-friendly Version
Interactive Discussion
in the north-west (Mieruch et al., 2008). However, the IWV increase is continuing along the West Coast (in ERA-40 and NCEP) and has picked up in much of Canada (Trenberth et al., 2005). More intense rains have been observed in the USA (Groisman et al., 2004).
4 Conclusions
5
We have set up a new optimized retrieval of IWV from ground-based, mid-infrared solar FTIR spectrometry based upon a Tikhonov approach constraining the derivative (with respect to height) of the retrieved water profiles given in units of per cent differences rel-ative to an a priori profile. With this method it has been possible to demonstrate, for the first time, a correlation of FTIR retrieved IWV with respect to radiosondes with an ideal
10
slope of 1.00(3); such correlations are the result of an iterative retrieval matching
pro-cedure. All other correlation parameters (intercept=0.02(12) mm, bias=0.02(5) mm,
stdv=0.27 mm,R=0.99) of our FTIR-sonde intercomparison were found to be
compa-rable to or better than example results reported in the literature for sonde intercom-parisons of the best among other ground-based IWV sounding techniques (microwave,
15
Raman lidar).
A FTIR-FTIR side-by-side intercomparison reveals a strong exponential increase in
thestdv of the coincident IWV differences as a function of increasing temporal
mis-match starting at∆t∼1 min. From this we learn that it is difficult, if not impossible, to
derive the IWV precision of a ground-based remote sounder from a sonde
intercompar-20
ison exercise even if the sondes are launched in the close vicinity of the ground-based
instrument. This is because it is impossible to reduce∆tbelow the>20–30 min ascent
time required to reasonably sample the total humidity column by sondes and there is already a significant impact of natural water vapor variability on this time scale. A best estimate for IWV precision is therefore derived from a side-by-side intercomparison of
25
two instruments of the same class because∆t can be reduced down to minutes. We
ACPD
9, 13199–13233, 2009Trends in integrated water vapor from ground-based FTIR
R. Sussmann et al.
Title Page
Abstract Introduction
Conclusions References
Tables Figures
◭ ◮
◭ ◮
Back Close
Full Screen / Esc
Printer-friendly Version
Interactive Discussion
to derive an upper limit for the precision of 0.05 mm (or 2.2% of the mean IWV). The bias found for the two FTIR instruments used in the side-by-side intercomparison is nearly negligible (0.02(1) mm). Finally, we have presented a harmonization concept so that the new and optimized FTIR retrieval can be implemented at other stations of the NDACC network.
5
The new IWV retrieval and inter-station harmonization concept was applied to a trend analysis of the two FTIR long term records of the Zugspitze and Jungfraujoch NDACC stations covering the time intervals (1996–2008) and (1988–2008), respec-tively. The trend analysis comprised an inter-annual model and bootstrap resampling
to derive trend significance. For the Zugspitze a significant trend of 0.79 mm/decade
10
was found for the full time period (1996–2008) with an uncertainty interval of (0.65,
0.92) mm/decade (95% confidence). There was a significantly increased trend of 1.41
(1.14, 1.69) mm/decade in the second part of the time series (2003–2008) compared
to 0.63 (0.20, 1.06) mm/decade in the first part (1996–2002). For the Jungfraujoch no
significant trend was found in any of the investigated periods, i.e. (1988–2008), (1996–
15
2008), (1996–2002), or (2003–2008). It is suggested that the reason why a trend was found at the Zugspitze and not at the Jungfraujoch may be due to the horizontal
dis-tance (∼250 km) and/or the altitude difference (3.58–2.96 km) of the two stations. This
would imply either an altitude dependency with a significantly higher (positive) trend below 3.58 km than above and/or rather strong regional variations of IWV trends on the
20
scale of 250 km. Our finding is in line with a widespread, complex trend picture over Eurasia during the last decades.
In conclusion we have developed and demonstrated a concept which makes it pos-sible to utilize the existing and ongoing long-term FTIR records of the Zugspitze and Jungfraujoch NDACC stations for IWV trend studies. It has been shown that IWV can
25
be retrieved at two different FTIR stations in a harmonized way and correlated with
radiosondes with a slope of 1.00. There are more than a dozen additional solar FTIR records covering more than a decade at stations around the globe operated by NDACC
ACPD
9, 13199–13233, 2009Trends in integrated water vapor from ground-based FTIR
R. Sussmann et al.
Title Page
Abstract Introduction
Conclusions References
Tables Figures
◭ ◮
◭ ◮
Back Close
Full Screen / Esc
Printer-friendly Version
Interactive Discussion
joint IWV trend studies by the FTIR network. These trend studies will complement ex-isting trend data sets on a global scale which up to now have been based primarily on radiosondes.
Acknowledgements. We would like to thank H. P. Schmid (IMK-IFU) for his continual inter-est in this work. Funding by EUMETSAT (contract EUM/CO/01/892/PS) and the EC within 5
the projects UFTIR (contract EVK2-CT-2002-00159), HYMN (contract 037048), and GEOMON (contract 036677) is gratefully acknowledged. This work is part of the EC-Network of Excel-lence ACCENT-TROPOSAT-2. The Belgian contribution to this study was supported by the GAW-CH Plus (“FTIR Jungfraujoch”) and by the Belgian Science Policy Office (BELSPO, Brus-sels) through the AGACC and SECPEA projects. The GIRPAS team further thanks the Interna-10
tional Foundation High Altitude Research Stations Jungfraujoch and Gornergrat (HFSJG, Bern) for supporting the facilities needed to perform the observations.
References
Auer, I., B ¨ohm, R., Jurkovic, A., Lipa, W., Orlik, A., Potzmann, R., Sch ¨oner, W., Ungersb ¨ock, M., Matulla, C., Briffa, K., Jones, P., Efthymiadis, D., Brunetti, M., Nanni, T., Maugeri, M., Mercalli, 15
L., Mestre, O., Moisselin, J.-M., Begert, M., M ¨uller-Westermeier, G., Kveton, V., Bochnicek, O., Stastny, P., Lapin, M., Szalai, S., Szentimrey, T., Cegnar, T., Dolinar, M., Gajic-Capka, M., Zaninovic, K., Majstorovic, Z., Nieplova, E.: HISTALP – historical instrumental climatological surface time series of the Greater Alpine Region, Int. J. Climatol., 27, 17–46, 2007.
Christy, J. R., Spencer, R. W., and Lobl, E. S.: Analysis of the merging procedure for the MSU 20
daily temperature time series, J. Climate, 11, 2016–2041, 1998.
Elliott, W. P., Ross, R. J., and Blackmore, W. H.: Recent changes in NWS upper-air observa-tions with emphasis on changes from VIZ to Vaisala radiosondes, B. Am. Meteorol. Soc., 83, 1003–1017, 2002.
Fiorucci, I., Muscari, G., Bianchi, C., Di Girolamo, P., Esposito, F., Grieco, G., Summa, D., Bian-25
ACPD
9, 13199–13233, 2009Trends in integrated water vapor from ground-based FTIR
R. Sussmann et al.
Title Page
Abstract Introduction
Conclusions References
Tables Figures
◭ ◮
◭ ◮
Back Close
Full Screen / Esc
Printer-friendly Version
Interactive Discussion Gardiner, T., Forbes, A., de Mazi `ere, M., Vigouroux, C., Mahieu, E., Demoulin, P., Velazco, V.,
Notholt, J., Blumenstock, T., Hase, F., Kramer, I., Sussmann, R., Stremme, W., Mellqvist, J., Strandberg, A., Ellingsen, K., and Gauss, M.: Trend analysis of greenhouse gases over Europe measured by a network of ground-based remote FTIR instruments, Atmos. Chem. Phys., 8, 6719–6727, 2008,
5
http://www.atmos-chem-phys.net/8/6719/2008/.
Groisman, P. Y., Knight, R. W., Karl, T. R., Easterling, D. R., Sun, B. M., and Lawrimore, J. H.: Contemporary changes of the hydrological cycle over the contiguous United States: trends derived from in situ observations, J. Hydrometeorol., 5, 64–85, 2004.
Hurrell, J. W. and Trenberth, K. E.: Spurious trends in satellite MSU temperatures from merging 10
different satellite records, Nature, 386, 164–167, 1997.
Hurrell, J. W. and Trenberth, K. E.: Difficulties in obtaining reliable temperature trends: recon-ciling the surface and satellite microwave sounding unit records, J. Climate, 11, 945–967, 1998.
Leiterer, U., Althausen, D., Franke, K., Katz, A., and Wegner, F.: Correction method for RS80-15
A Humicap humidity profiles and their validation by lidar backscattering profiles in tropical cirrus clouds, J. Atmos. Ocean. Tech., 22, 18–29, 2005.
Mahieu, E., Duchatelet, P., Demoulin, P., Walker, K. A., Dupuy, E., Froidevaux, L., Randall, C., Catoire, V., Strong, K., Boone, C. D., Bernath, P. F., Blavier, J.-F., Blumenstock, T., Coffey, M., De Mazi `ere, M., Griffith, D., Hannigan, J., Hase, F., Jones, N., Jucks, K. W., Kagawa, A., 20
Kasai, Y., Mebarki, Y., Mikuteit, S., Nassar, R., Notholt, J., Rinsland, C. P., Robert, C., Schrems, O., Senten, C., Smale, D., Taylor, J., T ´etard, C., Toon, G. C., Warneke, T., Wood, S. W., Zander, R., and Servais, C.: Validation of ACE-FTS v2.2 measurements of HCl, HF, CCl3F and CCl2F2using space-, balloon- and ground-based instrument observa-tions, Atmos. Chem. Phys., 8, 6199–6221, 2008,
25
http://www.atmos-chem-phys.net/8/6199/2008/.
Mieruch, S., No ¨el, S., Bovensmann, H., and Burrows, J. P.: Analysis of global water vapour trends from satellite measurements in the visible spectral range, Atmos. Chem. Phys., 8, 491–504, 2008,
http://www.atmos-chem-phys.net/8/491/2008/. 30
ACPD
9, 13199–13233, 2009Trends in integrated water vapor from ground-based FTIR
R. Sussmann et al.
Title Page
Abstract Introduction
Conclusions References
Tables Figures
◭ ◮
◭ ◮
Back Close
Full Screen / Esc
Printer-friendly Version
Interactive Discussion Miloshevich, L. M., Paukkunen, A., V ¨omel, H., and Oltmans, S. J.: Development and validation
of a time lag correction for Vaisala radiosonde humidity measurements, J. Atmos. Ocean. Tech., 21, 1305–1327, 2004.
Miloshevich, L. M., V ¨omel, H., Whiteman, D. N., Lesht, B. M., Schmidlin, F. J., and Russo, F.: Absolute accuracy of water vapour measurements from six operational radiosonde types 5
launched during AWEX-G and implications for AIRS validation, J. Geophys. Res., 111, D09S10, doi:10.1029/2005JD006083, 2006.
Morland, J., Deuber, B., Feist, D. G., Martin, L., Nyeki, S., K ¨ampfer, N., M ¨atzler, C., Jeannet, P., and Vuilleumier, L.: The STARTWAVE atmospheric water database, Atmos. Chem. Phys., 6, 2039–2056, 2006,
10
http://www.atmos-chem-phys.net/6/2039/2006/.
Palm, M., Melsheimer, C., No ¨el, S., Notholt, J., Burrows, J., and Schrems, O.: Integrated water vapor above Ny lesund, Spitsbergen: a multisensor intercomparison, Atmos. Chem. Phys. Discuss., 8, 21171–21199, 2008,
http://www.atmos-chem-phys-discuss.net/8/21171/2008/. 15
Philipona, R., D ¨urr, B., Marty, C., Ohmura, A., and Wild, M.: Radiative forcing – measured at Earth’s surface – corroborate the increasing greenhouse effect, Geophys. Res. Lett., 31, L03202, doi:10.1029/2003GL018765, 2004.
Philipona, R., D ¨urr, B., Ohmura, A., and Ruckstuhl, C.: Anthropogenic greenhouse forcing and strong water vapor feedback increase temperature in Europe, Geophys. Res. Lett., 32, 20
L19809, doi:10.1029/2005GL023624, 2005.
Pougatchev, N. S., Connor, B. J., and Rinsland, C. P.: Infrared measurements of the ozone vertical distribution above Kitt Peak, J. Geophys. Res., 100, 16689–16697, 1995.
Rinsland, C. P., Boughner, R. E., Larsen, J. C., Stokes, G. M., and Brault, J. W.: Diurnal vari-ations of atmospheric nitric oxide: ground-based infrared spectroscopic measurements and 25
their interpretation with time dependent photochemical model calculations, J. Geophys. Res., 89, 9613–9622, 1984.
Randel, D. L., Vonder Haar, T. H., Ringerud, M. A., Stephens, G. L., Greenwald, T. J., and Combs, C. L.: A new global water vapor dataset, B. Am. Meteorl. Soc., 77, 1233–1246, 1996.
30
Ross, R. J. and Elliott, W. P.: Radiosonde-based Northern Hemisphere tropospheric water vapor trends, J. Climate, 14, 1602–1612, 2001.
ACPD
9, 13199–13233, 2009Trends in integrated water vapor from ground-based FTIR
R. Sussmann et al.
Title Page
Abstract Introduction
Conclusions References
Tables Figures
◭ ◮
◭ ◮
Back Close
Full Screen / Esc
Printer-friendly Version
Interactive Discussion Chance, K., Clerbaux, C., Dana, V., Devi, V. M., Fayt, A., Flaud, J. M., Gamache, R. R.,
Goldman, A., Jacquemart, D., Jucks, K. W., Lafferty, W. J., Mandin, J. Y., Massie, S. T., Nemtchinov, V., Newnham, D. A., Perrin, A., Rinsland, C. P., Schroeder, J., Smith, K. M., Smith, M. A. H., Tang, K., Toth, R. A., Vander Auwera, J., Varanasi, P., and Yoshino, K.: The HITRAN molecular spectroscopic database: edition of 2000 including updates through 2001, 5
J. Quant. Spectrosc. Ra., 82, 5–44, 2003.
Schneider, M., Hase, F., and Blumenstock, T.: Water vapour profiles by ground-based FTIR spectroscopy: study for an optimised retrieval and its validation, Atmos. Chem. Phys., 6, 811–830, 2006,
http://www.atmos-chem-phys.net/6/811/2006/. 10
Suortti, T. M., Kats, A., Kivi, R., K ¨ampfer, N., Leiterer, U., Miloshevich, M. L., Neuber, R., Paukkunen, A., Ruppert, P., V ¨omel, H., and Yushkov, V.: Tropospheric comparisons of Vaisala radiosondes and balloon-borne frost-point and Lyman-α hygrometers during the LAUTLOS-WAVVAP experiment, J. Atmos. Ocean. Tech., 25, 149–166, 2008.
Sussmann, R. and Sch ¨afer, K: Infrared spectroscopy of tropospheric trace gases: combined 15
analysis of horizontal and vertical column abundances, Appl. Opt., 36, 735–741, 1997. Sussmann, R. and Camy-Peyret, C.: Ground-Truthing Center Zugspitze, Germany for
AIRS/IASI validation, phase I report, EUMETSAT, 18 pp., http://www.imk-ifu.kit.edu/ downloads/AIRSVAL Phase I Report.pdf, 2002.
Sussmann, R. and Camy-Peyret, C.: Ground-Truthing Center Zugspitze, Germany for 20
AIRS/IASI validation, phase II report, EUMETSAT, 15 pp, http://www.imk-ifu.kit.edu/ downloads/AIRSVAL Phase II Report.pdf, 2003.
Sussmann, R. and Buchwitz, M.: Initial validation of ENVISAT/SCIAMACHY columnar CO by FTIR profile retrievals at the Ground-Truthing Station Zugspitze, Atmos. Chem. Phys., 5, 1497–1503, 2005,
25
http://www.atmos-chem-phys.net/5/1497/2005/.
Sussmann, R., Stremme, W., Buchwitz, M., and de Beek, R.: Validation of EN-VISAT/SCIAMACHY columnar methane by solar FTIR spectrometry at the Ground-Truthing Station Zugspitze, Atmos. Chem. Phys., 5, 2419–2429, 2005,
http://www.atmos-chem-phys.net/5/2419/2005/. 30
Facil-ACPD
9, 13199–13233, 2009Trends in integrated water vapor from ground-based FTIR
R. Sussmann et al.
Title Page
Abstract Introduction
Conclusions References
Tables Figures
◭ ◮
◭ ◮
Back Close
Full Screen / Esc
Printer-friendly Version
Interactive Discussion ity Zugspitze/Garmisch, Atmos. Chem. Phys., 5, 2657–2677, 2005,
http://www.atmos-chem-phys.net/5/2657/2005/.
Sussmann, R. and Borsdorff, T.: Technical Note: Interference errors in infrared remote sounding of the atmosphere, Atmos. Chem. Phys., 7, 3537–3557, 2007,
http://www.atmos-chem-phys.net/7/3537/2007/. 5
Tikhonov, A.: On the solution of incorrectly stated problems and a method of regularization, Dokl. Acad. Nauk SSSR, 151, 501–504, 1963.
Tobin, D. C., Revercomb, H. E., Knuteson, R. O., Lesht, B. M, Strow, L. L., Hannon, S. E.: Feltz, W. F., Moy, L. A., Fetzer, E. J., and Cress, T. S.: Atmospheric radiation measurement site atmospheric state best estimates for atmospheric infrared sounder temperature and wa-10
ter vapor retrieval validation, J. Geophys. Res., 111, D09S14, doi:10.1029/2005JD006103, 2006.
Trenberth, K. E., Fasullo, J., and Smith, L.: Trends and variability in column-integrated atmo-spheric water vapor, Clim. Dynam., 24, 741–758, doi:10.1007/s00382-005-0017-4, 2005. Trenberth, K. E., Jones, P. D., Ambenje, P., Bojariu, R., Easterling, D., Klein Tank, A., Parker, D., 15
Rahimzadeh, F., Renwick, J. A., Rusticucci, M., Soden, B., and Zhai, P.: Observations: sur-face and atmospheric climate change, in: Climate Change 2007: The Physical Science Basis. Contribution of Working Group I to the Fourth Assessment Report of the Intergov-ernmental Panel on Climate Change, edited by: Solomon, S., Qin, D., Manning, M., et al., Cambridge University Press, Cambridge, UK and New York, NY, USA, 2007.
20
Vonder Haar, T. H., Forsythe, J. M., McKague, D., Randel, D. L., Ruston. B. C., and Woo, S.: Continuation of the NVAP global water vapor data sets for Pathfinder science analysis, Sci-ence and Technology Corporation Technical Report 3333, 44 pp, http://eosweb.larc.nasa. gov/PRODOCS/nvap/sci tech report 3333.pdf, 2003.
Vonder Haar, T. H., Forsythe, J. M., Juo, J., Randel, D. L., and Woo, S.: Water vapor trends 25
and variability from the global NVAP dataset, 16th Symposium on Global Change and Cli-mate Variations, 9–13 January 2005, San Diego, California, American Meteorological Soci-ety, P5.16, 2005.
Wagner, T., Beirle, S., Grzegorski, M., and Platt, U.: Global trends (1996–2003) of total column precipitable water observed by Global Ozone Monitoring Experiment (GOME) on 30
ERS-2 and their relation to near-surface temperature, J. Geophys. Res., 111, D12102, doi:10.1029/2005JD006523, 2006.
ACPD
9, 13199–13233, 2009Trends in integrated water vapor from ground-based FTIR
R. Sussmann et al.
Title Page
Abstract Introduction
Conclusions References
Tables Figures
◭ ◮
◭ ◮
Back Close
Full Screen / Esc
Printer-friendly Version
Interactive Discussion Corrections of humidity measurement errors from the Vaisala RS80 radiosonde – application
to TOGA COARE data, J. Atmos. Ocean. Tech., 19, 981–1002, 2002.
Wentz, F. J. and Schabel, M.: Effects of satellite orbital decay on MSU lower tropospheric temperature trends, Nature, 394, 661–664, 1998.
Wentz, F. J. and Schabel, M.: Precise climate monitoring using complementary satellite data 5
sets, Nature, 403, 414–416, 2000.
Zander, R., Mahieu, E., Demoulin, P., Duchatelet, P., Roland, G., Servais, C., De Mazi `ere, M., Reimann, S., and Rinsland, C. P.: Our changing atmosphere: evidence based on long-term infrared solar observations at the Jungfraujoch since 1950, Sci. Total Environ., 391, 184–195, 2008.
ACPD
9, 13199–13233, 2009Trends in integrated water vapor from ground-based FTIR
R. Sussmann et al.
Title Page
Abstract Introduction
Conclusions References
Tables Figures
◭ ◮
◭ ◮
Back Close
Full Screen / Esc
Printer-friendly Version
Interactive Discussion
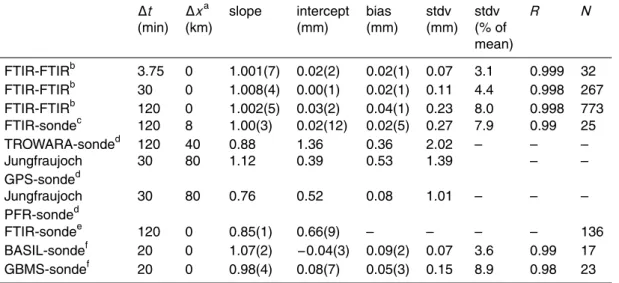
Table 1.IWV correlation parameters from a FTIR side-by-side intercomparison and examples for comparisons of all different ground-based remote techniques versus radiosondes: FTIR, microwave (TROWARA, GBMS), GPS, sun photometer (PFR), and Raman lidar (BASIL). Errors are for 1 sigma confidence,N is the number of coincidences.
∆t ∆xa slope intercept bias stdv stdv R N
(min) (km) (mm) (mm) (mm) (% of
mean)
FTIR-FTIRb 3.75 0 1.001(7) 0.02(2) 0.02(1) 0.07 3.1 0.999 32
FTIR-FTIRb 30 0 1.008(4) 0.00(1) 0.02(1) 0.11 4.4 0.998 267
FTIR-FTIRb 120 0 1.002(5) 0.03(2) 0.04(1) 0.23 8.0 0.998 773
FTIR-sondec 120 8 1.00(3) 0.02(12) 0.02(5) 0.27 7.9 0.99 25
TROWARA-sonded 120 40 0.88 1.36 0.36 2.02 – – –
Jungfraujoch 30 80 1.12 0.39 0.53 1.39 – –
GPS-sonded
Jungfraujoch 30 80 0.76 0.52 0.08 1.01 – – –
PFR-sonded
FTIR-sondee 120 0 0.85(1) 0.66(9) – – – – 136
BASIL-sondef 20 0 1.07(2) −0.04(3) 0.09(2) 0.07 3.6 0.99 17
GBMS-sondef 20 0 0.98(4) 0.08(7) 0.05(3) 0.15 8.9 0.98 23
a
Distance between ground-based sounder and radiosonde launch site
b
This work (individual measurements of 2 Jungfraujoch FTIRs)
c
This work (2 hr-Zugspitze FTIR versus Tobin radiosondes, see Fig. 3c)
d
Taken from Figs. 9 and 10 in Morland et al. (2006)
e
Taken from Palm et al. (2008), retrieval different than that in our work
f
ACPD
9, 13199–13233, 2009Trends in integrated water vapor from ground-based FTIR
R. Sussmann et al.
Title Page
Abstract Introduction
Conclusions References
Tables Figures
◭ ◮
◭ ◮
Back Close
Full Screen / Esc
Printer-friendly Version
Interactive Discussion
Table 2.Precision (1 sigma) and bias of optimized FTIR IWV retrievals derived from a side-by-side intercomparison of two FTIR instruments at the Jungfraujoch.
precision precision bias bias
(mm) (% of mean IWV) (mm) (% of mean IWV)
ACPD
9, 13199–13233, 2009Trends in integrated water vapor from ground-based FTIR
R. Sussmann et al.
Title Page
Abstract Introduction
Conclusions References
Tables Figures
◭ ◮
◭ ◮
Back Close
Full Screen / Esc
Printer-friendly Version
Interactive Discussion
Table 3. Existence and significance of IWV trends derived from harmonized FTIR measure-ments at the Zugspitze and Jungfraujoch.
trend uncertainty interval significant (mm/decade) (2.5th percentile, non-zero trend?
97.5th percentile)a (95% confidence) (mm/decade)
Zugspitze (1996–2008) 0.79 (0.65, 0.92) yes
Zugspitze (1996–2002) 0.63 (0.20, 1.06) yes
Zugspitze (2003–2008) 1.41 (1.14, 1.69) yes
Jungfraujoch (1996–2008) 0.08 (−0.01, 0.17) no
Jungfraujoch (1996–2002) −0.04 (−0.27, 0.19) no
Jungfraujoch (2003–2008) 0.05 (−0.18, 0.28) no
Jungfraujoch (1988–2008) 0.04 (−0.01, 0.10) no
a
ACPD
9, 13199–13233, 2009Trends in integrated water vapor from ground-based FTIR
R. Sussmann et al.
Title Page
Abstract Introduction
Conclusions References
Tables Figures
◭ ◮
◭ ◮
Back Close
Full Screen / Esc
Printer-friendly Version
Interactive Discussion
849.0 849.2 849.4 849.6 849.8 850.0 850.2
0.2 0.4 0.6 0.8 1.0 -0.05 0.00 0.05
852.0 852.2 852.4 852.6 852.8 853.0
0.0 0.2 0.4 0.6 0.8 1.0 -0.05 0.00 0.05
839.6 839.8 840.0 840.2 840.4
0.4 0.6 0.8 1.0
-0.050.00
0.05
(b)
r
e
lativ
e
in
ten
s
ity
wave number (cm-1)
measured spectrum calculated spectrum
residual
relativ
e
intensity
wave number (cm-1)
measured spectrum calculated spectrum
(c)
residual
(a)
relativ
e
intensity
wave number (cm-1)
measured spectrum calculated spectrum
residual
ACPD
9, 13199–13233, 2009Trends in integrated water vapor from ground-based FTIR
R. Sussmann et al.
Title Page
Abstract Introduction
Conclusions References
Tables Figures
◭ ◮
◭ ◮
Back Close
Full Screen / Esc
Printer-friendly Version
Interactive Discussion 0
2 4 6 8 10 12 14
0.000 0.005 0.010 0.015 0.020
Tobin radiosondes mean of sondes FTIR a priori
H2O volume mixing ratio
altit
ude (k
m
)