www.atmos-chem-phys.net/16/1987/2016/ doi:10.5194/acp-16-1987-2016
© Author(s) 2016. CC Attribution 3.0 License.
Utilization of O
4
slant column density to derive aerosol layer height
from a space-borne UV–visible hyperspectral sensor:
sensitivity and case study
Sang Seo Park1,a, Jhoon Kim1, Hanlim Lee1,2, Omar Torres3, Kwang-Mog Lee4, and Sang Deok Lee5 1Department of Atmospheric Sciences, Yonsei University, Seoul, South Korea
2Department of Spatial Information Engineering, Pukyong National University, Busan, South Korea 3NASA Goddard Space Flight Center, Greenbelt, Maryland, USA
4Department of Astronomy and Atmospheric Sciences, Kyungpook National University, Daegu, South Korea 5National Institute of Environment Research, Ministry of Environment, Incheon, South Korea
anow at: Research Institute for Applied Mechanics, Kyushu University, Fukuoka, Japan
Correspondence to:Jhoon Kim ([email protected])
Received: 24 October 2014 – Published in Atmos. Chem. Phys. Discuss.: 17 March 2015 Revised: 12 January 2016 – Accepted: 20 January 2016 – Published: 23 February 2016
Abstract. The sensitivities of oxygen-dimer (O4)slant
col-umn densities (SCDs) to changes in aerosol layer height are investigated using the simulated radiances by a radia-tive transfer model, the linearized pseudo-spherical vector discrete ordinate radiative transfer (VLIDORT), and the dif-ferential optical absorption spectroscopy (DOAS) technique. The sensitivities of the O4 index (O4I), which is defined as dividing O4 SCD by 1040molecules2cm−5, to aerosol types and optical properties are also evaluated and com-pared. Among the O4 absorption bands at 340, 360, 380, and 477 nm, the O4 absorption band at 477 nm is found to be the most suitable to retrieve the aerosol effective height. However, the O4I at 477 nm is significantly influenced not only by the aerosol layer effective height but also by aerosol vertical profiles, optical properties including single scatter-ing albedo (SSA), aerosol optical depth (AOD), particle size, and surface albedo. Overall, the error of the retrieved aerosol effective height is estimated to be 1276, 846, and 739 m for dust, non-absorbing, and absorbing aerosol, respectively, as-suming knowledge on the aerosol vertical distribution shape. Using radiance data from the Ozone Monitoring Instrument (OMI), a new algorithm is developed to derive the aerosol effective height over East Asia after the determination of the aerosol type and AOD from the MODerate resolution Imag-ing Spectroradiometer (MODIS). About 80 % of retrieved aerosol effective heights are within the error range of 1 km
compared to those obtained from the Cloud-Aerosol Lidar with Orthogonal Polarization (CALIOP) measurements on thick aerosol layer cases.
1 Introduction
2005; Chou et al., 2002), to understand the mechanism of the changes to the cloud formation (Twomey et al., 1984; Al-brecht, 1989; Jones et al., 1994), and to monitor air quality (e.g., Wang and Christopher, 2003; Hutchison et al., 2005).
Vertical profiles of atmospheric aerosols are affected by processes of formation, transport, and deposition and vary for different aerosol types over East Asia (Shimizu et al., 2004). Labonne et al. (2007) also reported that the layer top height of biomass burning aerosol ranged from 1.5 to 7 km in the wild fire regions. The information on the aerosol layer height is important, because the variation of the aerosol vertical dis-tribution affects radiative processes in the atmosphere near the surface and trace gas retrieval for air mass factor calcula-tion. Uncertainty in aerosol layer height also affects the accu-racy of AOD and SSA retrieval algorithms that use near-UV observations (Torres et al., 1998, 2007; Jethva et al., 2014) and complicates the interpretation of the Aerosol Index (AI), a qualitative parameter commonly used to detect absorbing aerosols (Herman et al., 1997; Torres et al., 1998). In ad-dition, there have been difficulties to estimate surface con-centration of aerosol from AODs, because the information on aerosol vertical distribution is not readily available and even hard to predict from the state-of-the-art models due to its large variability. Although the Cloud-Aerosol Lidar with Orthogonal Polarization (CALIOP) has been successful and provided vertical profiles of aerosols, its spatial coverage was very limited with its measurement characteristics (Omar et al., 2009). Liu et al. (2005) showed that the particulate mat-ter (PM) concentration estimated by the AOD from satellite observation accounted for only 48 % of the measured surface PM, although their study reflected variations of the aerosol types and its hygroscopic growth in the algorithms. One of the essential factors to consider in estimating PM from AOD is the vertical structure of aerosols (e.g., Chu, 2006; Seo et al., 2015). Therefore, conventional aerosol products would benefit significantly with the development of robust algo-rithm to retrieve aerosol height using satellite data.
The differential optical absorption spectroscopy (DOAS) technique has been used widely to retrieve trace gas con-centration both from ground-based (e.g., Platt, 1994; Platt and Stutz, 2008) and space-borne (e.g., Wagner et al., 2007, 2010) measurements. After the work of Platt (1994) to re-trieve trace gas concentration by using DOAS, Wagner et al. (2004) suggested deriving atmospheric aerosol informa-tion from O4 measurement by using multi-axis differen-tial optical absorption spectroscopy (MAX-DOAS). Friess et al. (2006) analyzed the model studies to calculate the achiev-able precision of the aerosol optical depth and vertical pro-file. In addition, several studies (e.g., Irie et al., 2009, 2011; Lee et al., 2009, 2011; Clémer et al., 2010; Li et al., 2010) provided aerosol profiles from ground-based hyperspectral measurements in UV and visible wavelength ranges on sev-eral ground sites. Wagner et al. (2010) investigated the sensi-tivity of various factors to the aerosol layer height using the data obtained from the SCanning Imaging Absorption
spec-troMeter for Atmospheric CHartographY (SCIAMACHY) on Envisat. The sensitivity of the Ring effect and the ab-sorption by oxygen molecules (O2)and its dimer (O4)
cal-culated by the DOAS method were examined to estimate aerosol properties including the layer height. Kokhanovsky and Rozanov (2010) estimated dust altitudes using the O2 A band between 760 and 765 nm after the determination of the dust optical depth. In addition, several previous studies also investigated estimation methods for aerosol height in-formation by using hyperspectral measurement in the visible spectrum (e.g., Dubuisson et al., 2009; Koppers and Murtagh, 1997; Sanders and de Haan, 2013; Sanghavi et al., 2012; Wang et al., 2012). Because the surface signal is signifi-cantly smaller than the aerosol signal in the near-UV spec-trum, these wavelength regions are useful to derive aerosol height information from space-borne measurements.
For Ozone Monitoring Instrument (OMI) measurement, the O4band at 477 nm has been widely applied to estimate cloud information (e.g., Accarreta et al., 2004; Sneep et al., 2008). In particular, the cloud information retrieved by the O4 band at 477 nm was used to analyze the air mass fac-tor with the consideration of aerosol optical effects for the NO2column retrieval (e.g., Castellanos et al., 2015; Chimot et al., 2015; Lin et al., 2014, 2015). Although the O4 ab-sorption band around 477 nm varies due to cloud existence, it can also be used for the aerosol optical parameter estimation. Veihelmann et al. (2007) posited that the 477 nm channel, a major O4band, significantly adds to the degree of freedom for aerosol retrieval by using principal component analysis, and Dirksen et al. (2009) adopts the pressure information ob-tained from the OMI O4band to identify a plume height for aerosol transport cases.
In this study, the sensitivities of the O4bands at 340, 360, 380, and 477 nm to changes in aerosol layer height and its op-tical properties are estimated using simulated hyperspectral radiances, differently from the previous studies using the O2 A band observation (e.g., Kokhanovsky and Rozanov, 2010). We proposed an improved DOAS algorithm for the O4 ab-sorption bands to retrieve aerosol height information from the O4slant column densities (SCDs) based on the sensitiv-ity studies. This new algorithm is applied to the O4SCD from the OMI to retrieve the aerosol effective height (AEH) for a real case over East Asia, including error estimates.
2 Methods
de-pendence. Therefore, radiative transfer calculations are car-ried out to estimate the sensitivity of the O4SCD with respect to the change of atmospheric conditions. Details of the radia-tive transfer model (RTM) and input parameters to simulate radiance are discussed in Sect. 2.1. Analytical method of the DOAS to estimate the O4is described in Sect. 2.2.
2.1 Simulation of hyperspectral radiance
Figure 1 shows the flowchart of the method to estimate the O4 SCD from the simulated radiance. Because the magni-tude of the O4 SCD values is too large to express the sen-sitivity results, this paper defines the O4index (O4I) which divides O4SCD by 1040molecules2cm−5. In order to inves-tigate the sensitivities of the O4I at several bands in UV and visible wavelengths with respect to various aerosol proper-ties, including AEHs, aerosol amounts, and aerosol types, the hyperspectral radiance is simulated using the linearized pseudo-spherical vector discrete ordinate radiative transfer (VLIDORT) model (Spurr, 2006). The VLIDORT model is based on the linearized discrete ordinate radiative transfer model (LIDORT) (Spurr et al., 2001; Spurr, 2002). This RTM is suitable for the off-nadir satellite viewing geometry of pas-sive sensors since this model adopts the spherically curved atmosphere to reflect the pseudo-spherical direct-beam at-tenuation effect (Spurr et al., 2001). The model calculates the monochromatic radiance ranging from 300 to 500 nm with a spectral resolution of 0.1 nm. The radiance spectrum is calculated with a 0.2 nm sampling resolution, applying a slit response function (SRF) given by a normalized Gaus-sian distribution with 0.6 nm as the full-width half maximum (FWHM).
2.1.1 Aerosol properties
The aerosol input parameters for the RTM are important in simulating the radiance spectra because aerosol optical properties determine scattering and absorption characteris-tics. The data from the Optical Properties of Aerosol and Cloud (OPAC) package (Hess et al., 1998) are used as aerosol parameters, which includes the spectral complex refractive indices and size distribution of aerosols to calculate SSA and phase function through the Mie calculations. The infor-mation of the aerosol parameters is not available at the UV wavelengths, since the AERONET observation provides the information of those aerosol parameters in the visible wave-length.
In terms of the aerosol types, water-soluble (WASO), min-eral dust (MITR), and continental polluted (COPO) mod-els are selected to simulate non-absorbing aerosol, mineral dust, and absorbing anthropogenic aerosol, respectively. The COPO is a combined type that includes both soot and WASO, which represents the pure black carbon and non-absorbing aerosols, respectively. The mixture of these two types ade-quately describes the fine-mode aerosol from anthropogenic
pollution. The SSA is the largest for WASO and the smallest for COPO. In order to account for hygroscopic growth, the default relative humidity is assumed to be 80 % (cf., Holzer-Popp and Schroedter-Homscheidt, 2004).
2.1.2 Aerosol vertical distribution
In this present study, “aerosol height” refers to aerosol ef-fective height (AEH), defined as the peak height in Gaussian distribution. According to Hayasaka et al. (2007), however, the aerosol extinction coefficient was found to exponentially decrease with altitude over East Asia based on the ground-based lidar observation data during the Atmospheric Brown Clouds East Asia Regional Experiment 2005 (ABC-EAREX 2005) campaign. Previous studies used the exponentially de-creasing pattern with altitude to represent the aerosol ver-tical profiles (e.g., Hayasaka et al., 2007; Li et al., 2010), and they reported that aerosol is present within 5 km in al-titude for most of the cases (e.g., Sasano, 1996; Chiang et al., 2007). On the other hand, the aerosol vertical distribution does not always follow an exponential profile. For the long-range transported aerosol such as dust cases, the aerosol layer profile is quite different than the exponential profile and oc-casionally transported to well above the boundary layer (e.g., Reid et al., 2002; Johnson et al., 2008). The peak height of the aerosol extinction profile in long-range transport cases was reported to be located between 1 and 3 km during the Dust and Biomass-burning Experiment (DABEX) campaign (Johnson et al., 2008). From these previous studies, a stan-dard aerosol vertical profile is difficult to determine. For algorithm development, previous studies assumed that the vertical distribution is a Gaussian function defined by peak height and half width as representative parameters (Torres et al., 1998, 2005). To supplement the simplicity of assumption for aerosol vertical distribution, the aerosol vertical tion is assumed to be a quasi-Gaussian generalized distribu-tion funcdistribu-tion (GDF), which is a Gaussian distribudistribu-tion with dependence on aerosol peak height, width, and layer top and bottom height. Details of the GDF can be found in Spurr and Christi (2014) and Yang et al. (2010). In this study, AEH ranges from 1 to 5 km with 1 km width as 1σ for the RTM
simulation.
2.1.3 Atmospheric gases
The vertical distribution of the O4 number density, which is used to calculate its SCD from the RTM, is assumed to be the square of the O2 number density in each layer (Her-mans et al., 2003). Thus, the total number of the O4column density from surface to the top of the atmosphere (TOA) is 1.38×1043molecule2cm−5, where 93 and 73 % of the total
Figure 1.Flowchart of the simulated O4SCD estimation.
are taken from the US Standard Atmosphere 1976 (United States Committee on Extension to the Standard Atmosphere, 1976). The vertical distribution of trace gases and aerosol in the troposphere is interpolated in the 0.1 km resolution from the sea level to 5 km.
2.2 DOAS analysis for O4I estimation
Table 1 summarizes the absorption cross sections of trace gases used as inputs for the radiance simulations and the DOAS spectral analysis. At wavelengths of 340, 360, 380, and 477 nm, the O4absorption cross section from Hermans et al. (1999) is used in this study. O3 absorption cross sec-tions at three different temperatures (223, 243, and 273 K) and NO2absorption cross sections at two different tempera-tures (220 and 294 K) are used to account for the amounts in the stratosphere and the troposphere. The radiance informa-tion obtained from the RTM simulainforma-tion is analyzed to derive the O4SCDs using WinDOAS software (van Roozendael and Fayt, 2001) before O4I estimation. To analyze the simulated radiances, the spectrum calculated without all atmospheric gases and aerosol is used as the Fraunhofer reference spec-trum (FRS). The simulated spectra are fitted simultaneously with the absorption cross sections of all trace gases listed in Table 1 and FRS in the respective wavelength range of 335– 350, 350–370, 370–390, and 460–486 nm, using a nonlinear least squares method (Platt and Stutz, 2008).
The O4I from OMI standard product of cloud (OM-CLDO2) (e.g., Accarreta et al., 2004; Sneep et al., 2008) is used to adopt the AEH retrieval for case study. The OMCLDO2 basically used the cross section database from
Table 1.The database of cross sections used for DOAS fitting anal-ysis.
Species Temperature (K) Reference
O3 223, 243, and 273 Bogumil et al. (2001) NO2 220 and 294 Vandaele et al. (1998) O4 298 Hermans et al. (1999)
Figure 2.Comparison of O4SCD directly retrieved from OMI ra-diance with the OMI standard product on 31 March 2007.
less than 1 % are used for the comparison. From this figure, a systematic difference between the two different fitting results is less than 1 %, although the cross section databases for fit-ting are different. From this result, the effect of cross section database difference is negligible when the same observation data were used. Furthermore, the DOAS analysis for LUT calculation can be used to compare the O4SCD from OM-CLDO2.
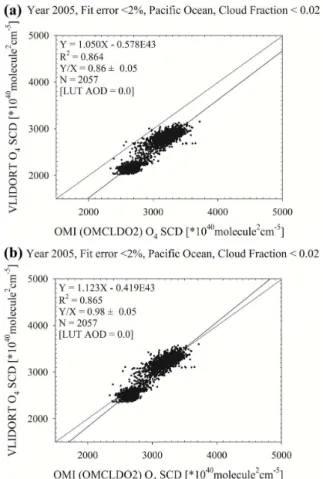
Figure 3 shows the comparison of the O4SCD at 477 nm from LUT with the dimension as in Table 2 against OM-CLDO2 for aerosol and cloud free pixels in year 2005. The LUT of O4 SCD is estimated by the DOAS analysis using simulated radiance from VLIDORT with various geometries as shown in Table 2. The clear-sky region is selected for the Pacific Ocean with cloud fraction less than 0.02 from OMI observation. The surface albedo is assumed to be 0.05, which is similar to the minimum Lambertian equivalent reflectance (LER) over clear ocean surface (e.g., Kleipool et al., 2008). Because the standard product of the O4 SCD is only esti-mated at the 477 nm band, the results can be compared only at this band. To minimize the DOAS fitting error, the ob-served data from OMI are selected by the fitting precision less than 2 % and the quality flags for spectral fitting are also considered. As shown in Fig. 3a, the coefficient of determi-nation (R2)is 0.864 with a slope of 1.050, and the LUT
ex-hibits a ratio of 0.86±0.05 to the values obtained from OMI
standard values. Despite the statistically significant R2and
slope values between the two values, there is a negative bias of about 14 %.
The bias between the values retrieved from LUT and es-timated from the standard product can be attributed to the differences in the O4cross section data and the lack of their temperature and pressure dependence as noted from the pre-vious works by Wagner et al. (2009); Clémer et al. (2010), and Irie et al. (2015). For this reason, ground-based mea-surements adopted the correction factors in the cross section database. However, the bias effect for the cross section
differ-Table 2.Dimensions of LUT for the clear-sky comparison.
Variable name No. of entries Entries
SZA 7 0, 10, 20, 30, 40, 50, 60◦ VZA 7 0, 10, 20, 30, 40, 50, 60◦ RAA 10 0, 20, 40, 60, 80, 100,
120, 140, 160, 180◦
SZA is the solar zenith angle; VZA is the viewing zenith angle; RAA is the relative azimuth angle.
Figure 3.Comparison of the O4SCD at 477 nm between the OMI standard product and the calculated value from LUT(a)before and (b)after correction of LER.
for ocean surface albedo at midlatitudes (e.g., Payne, 1972). The corrected result is shown in Fig. 3b, with theR2of 0.865
similar to that before the correction, while the negative bias is removed to 0.98±0.05 and the regression line slope is 1.123.
Although the comparison result is not perfect, the calcula-tion by the VLIDORT simulates the satellite observacalcula-tion and can be used for sensitivity tests and case studies to retrieve aerosol height.
3 Sensitivity test
3.1 Sensitivity of the O4Is to the AEH
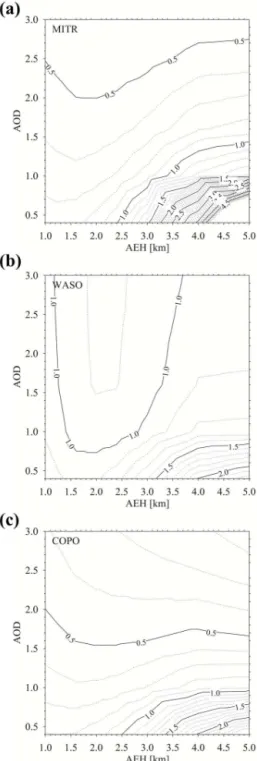
The sensitivity of the O4I to the AEH is investigated for its absorption bands at 340, 360, 380, and 477 nm. Figure 4 shows the O4I as a function of the AEH and the three differ-ent aerosol types of MITR, WASO, and COPO at 360, 380, and 477 nm, respectively. The vertical error bar represents the fitting error estimated by the residual spectra from the DOAS fitting (e.g., Stutz and Platt, 1996). For the calculation shown in the figures, the following geometries are assumed: solar zenith angle (SZA) of 30◦, viewing zenith angle (VZA) of 30◦, and relative azimuth angle (RAA) of 100◦. Note that an insignificant SCD value was estimated at 340 nm due to the large spectra fitting error. In these three figures, the O4Is show the AEHs ranging from 1.0 to 5.0 km for the AODs of 1.0 and 2.5 at 500 nm, which could be due to the existence of thick aerosol layers. For the sensitivity result, the decrease rate of the O4I value in the 1 km interval of AEH (−dO4/dZ)
is defined as equivalent O4I difference converted from the O4I difference between the neighboring AEHs in the same AOD condition.
The O4Is are estimated at 360 and 380 nm bands as shown in Fig. 4a–f. The O4I is significantly decreased with increas-ing AEH at 360 and 380 nm for all aerosol types. However, negative O4Is are occasionally estimated at 360 nm. Further-more, the fitting errors are too large to estimate the AEH, which range from 160 to 410 at 360 nm and from 350 to 1060 at 380 nm. From large fitting errors with small O4I, the fitting results are insignificant at these two absorption bands.
Nonetheless, the sensitivity of the O4I at 477 nm is a significant variable to estimate AEH. The mean value of
−dO4/dZis estimated to be 87, 290, and 190 for the MITR,
WASO, and COPO respectively when the AOD is 1.0. The mean value of−dO4/dZon the AOD of 2.5 is estimated to be
94, 362, and 213 for the MITR, WASO, and COPO, respec-tively. The calculated −dO4/dZ is significantly larger than
the mean O4I fitting error of 58, which implies that the O4I at 477 nm is useful in estimating the AEH. The small fitting errors at 477 nm are due to the larger O4absorption and less interference by other trace gases in this spectral window.
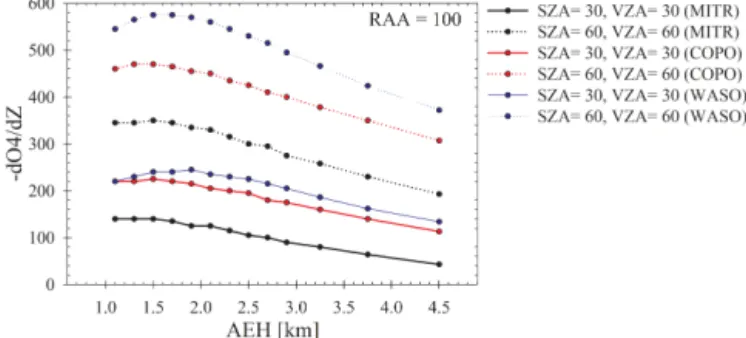
Figure 5 shows −dO4/dZ as changing viewing
geome-tries. As geometrical path length for viewing geometry is enlarged, −dO4/dZ also increases because the path length
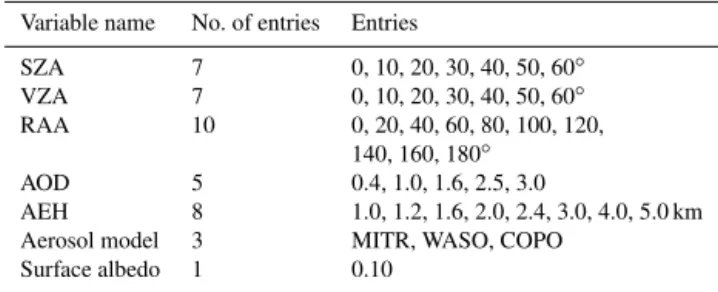
Table 3.Dimensions of simulation cases for the error analysis of the AEH retrieval.
Variable name No. of entries Entries
SZA 7 0, 10, 20, 30, 40, 50, 60◦ VZA 7 0, 10, 20, 30, 40, 50, 60◦ RAA 10 0, 20, 40, 60, 80, 100, 120,
140, 160, 180◦
AOD 5 0.4, 1.0, 1.6, 2.5, 3.0
AEH 8 1.0, 1.2, 1.6, 2.0, 2.4, 3.0, 4.0, 5.0 km Aerosol model 3 MITR, WASO, COPO
Surface albedo 1 0.10
AOD is the aerosol optical depth; AEH is the aerosol effective height.
through the aerosol layer is also increased. The mean value of
−dO4/dZincluding all cases of AEH is estimated to be 90 to
326 at SZA of 30.0◦and VZA of 30.0◦, while it is estimated to be 265 to 485 at SZA of 60.0◦and VZA of 60.0◦. Although the aerosol scattering angle is changed by SZA and VZA, the O4I sensitivity to AEH is generally increased with increasing optical path length to the viewing geometries. From this re-sult, the accuracy for the AEH retrieval is potentially better for large zenith angle cases than for low zenith angle cases.
3.2 Error analysis
Errors are also estimated in terms of key variables in the es-timation of the O4I at 477 nm, with the variables and their dimensions as summarized in Table 3. For the error analysis of AEH retrieval, characteristics for all of extinction proper-ties are essential to consider. In this study, errors are analyzed in terms of AOD, aerosol vertical distribution, particle size, and SSA for aerosol amount and properties. Surface albedo variation is also considered to represent surface condition. To estimate the error amount, the AEH error is converted from the half of O4I difference between adding and deducting per-turbation of variables as shown in Eq. (1).
ε (Z)=
O4I(x+δx, Z)−O4I(x−δx, Z)
2.0×dO4/dZ(x, Z)
, (1)
whereε (Z)is the AEH error amount due to variable of
er-ror source,x, in AEH ofZ, andδx is perturbation of AEH
retrieval error source. Theε (Z)value also depends on
view-ing geometries. Therefore ε (Z) is represented for specific
geometries together with averaging over all geometries.
3.2.1 AOD
Figure 4.The O4I at 360 nm band for(a)MITR,(b)WASO, and(c)COPO;(d)at 380 nm band for MITR,(e)WASO, and(f)COPO; and (g)at 477 nm band for MITR,(h)WASO, and(i)COPO as a function of AEH.
Figure 5.The AEH sensitivity to O4I (−dO4/dZ) with changing
observation geometries at 477 nm.
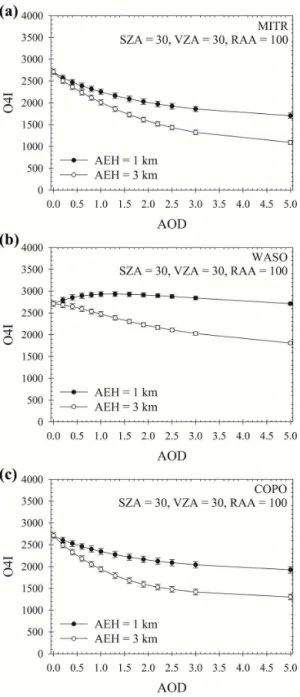
the larger of 0.1 or 20 % for non-absorbing aerosol (Torres et al., 1998, 2002). For this reason, the uncertainty of AOD is assumed to be 0.1 in this study, although uncertainty of AOD would be larger than the assumed value for large AOD. The decreasing rate of the O4I (−dO4/dτa), which defines O4I reduction with an AOD increase by 0.1, is found to be
larger for the AEH at 3.0 km than for that at 1.0 km. Among the three aerosol types, the−dO4/dτais found to be the least for the WASO, which has stronger scattering characteristics than other two aerosol types. In addition, the sensitivity for WASO showed negative −dO4/dτa for small AOD at low AEH, which has a small shielding effect with a large en-hancement effect due to the large SSA of WASO. The mean
−dO4/dτavalues are estimated to be 1.2, 0.9, and−0.1 % for the AEH of 1.0 km as the AOD changes by 0.1 for the MITR, COPO, and WASO, respectively, whereas they are estimated to be 2.3, 2.1, and 1.0 % for the AEH of 3.0 km with respect to the same AOD changes for the three different types, re-spectively.
Figure 6.The O4I of(a)MITR,(b)WASO, and(c)COPO types as a function of AOD.
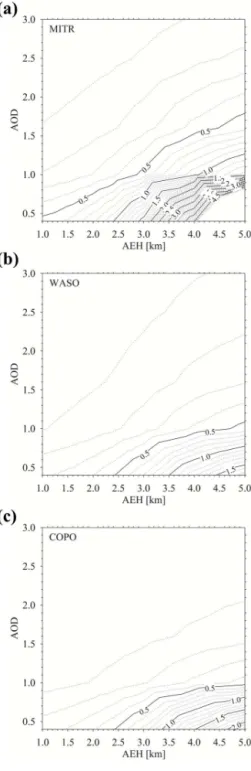
AOD cases for all aerosol types. The maximum retrieval er-ror is 2.0, 0.7, and 4.4 km for COPO, WASO, and MITR for the case at AEH of 4.0 km and AOD of 0.4, which is the least sensitive case for AEH. For an AOD of 0.4, however, the re-trieval error due to AOD uncertainty is 0.3, 0.2, and 0.4 km for COPO, WASO, and MITR for the case at AEH of 1.0 km. Except for AEH lower than 4 km and an AOD larger than 0.4, the retrieval error of AEH is less than 1.0 km for all viewing geometries and all aerosol types.
Furthermore, the AEH error for AOD uncertainty is also dependent on viewing geometries. From previous studies, the error for cloud height information depends on the
observa-Figure 7.AEH error of(a)MITR,(b)WASO, and(c)COPO for the AOD difference of 0.1 as a function of reference AEH and AOD.
Figure 8.AEH error of(a)MITR,(b)WASO, and(c)COPO for the AOD difference of 0.1 as changing viewing geometries.
enhanced. In general, the AEH error decreases with increas-ing viewincreas-ing geometries. For WASO case, however, the AEH error is smaller for the short path length than the long path length in the low AEH case. For the thin aerosol layer situ-ation, the radiance is enhanced by scattering aerosols, which results in increasing optical path length. In the small SZA and VZA, aerosol layer effectively causes enhancement ef-fect. With increasing SZA and VZA, however, the shield-ing effect due to the aerosol layer enhances because radiance has to pass through the long path through the aerosol layer. For this reason, the smallest error case is the inflection point
Figure 9.Same as Fig. 7 except for SSA difference of 10 %.
of AOD sensitivity, which corresponds to a turnaround point with a larger shielding effect than enhancement effect.
3.2.2 SSA
Figure 10. Same as Fig. 7 except for particle size difference of 20 %.
widely for different aerosol types. Therefore, the sensitivity of O4I to the SSA variation is estimated for the same geome-tries used in the previous tests. To estimate O4I sensitivity to the SSA variation, the imaginary part of the refractive index value corresponding to 10 % variability for SSA is changed after fixing the real part of the refractive index. The mean O4I changes by 106, 282, and 205 for MITR, WASO, and COPO, respectively, with respect to its SSA deviation by 10 %. To
Figure 11.Same as Fig. 7 except for surface albedo difference of 0.02.
compare the difference for WASO and COPO, it is propor-tional to the absolute values of the SSA for all simulated cases. In addition, the difference for MITR is smaller than that for COPO, because less fraction of back scattering in coarse-mode particles makes it less sensitive to O4I change.
Figure 12.Flowchart of the retrieval algorithm for AEH from OMI observation.
than 1 km for COPO aerosol type. For an AOD of 1.0, the AEH error due to SSA variation is estimated to be 610 to 900 m for the COPO type. Furthermore, the error is calcu-lated to range from 270 to 1220 m and from 930 to 1400 m for COPO and WASO types, respectively, if AEH is 3 km, the frequently assumed reference altitude in the aerosol retrieval algorithm (e.g., Torres et al., 1998). For MITR, a dust-like type of aerosol, the AEH error, which ranges from 410 to 1430 m for an AOD of 1.0, is generally the largest compared to AEH errors of other aerosol types. In general, uncertainty of aerosol optical properties is large for the thin aerosol layer case and thus the uncertainty of the AEH is as well.
3.2.3 Particle size
Aerosol particle size has noticeable effects on the phase func-tion and thus also the direcfunc-tional scattered intensity. How-ever, most aerosol retrieval algorithms assume aerosol parti-cle size depending on its type as an input parameter to RTM calculation. Although aerosol type is categorized, physical properties of aerosol can be changed according to the source type and transport characteristics. In the OMI aerosol algo-rithm, size distribution is one of the error sources for the AOD (Torres et al., 2002).
Figure 10 shows the AEH error due to particle size change. For error estimation, the mode radius difference for num-ber size distribution is assumed to be±20 %, which
corre-sponds to a range that is 4 times larger than that from the er-ror budget study for the OMI standard product (Torres et al., 2002). Overall, the O4I difference is within the order of 100.
The coarse-mode aerosol, MITR in this study, results in the largest O4I difference for all cases; thus the largest AEH ror for MITR is estimated to range from 0.2 to 2.7 km. The er-ror ranges from 0.03 to 0.5 and from 0.2 to 1.9 km for WASO and COPO, respectively. The largest AEH errors for the three aerosol types are estimated for the case with an AOD of 0.4 and AEH at 5.0 km.
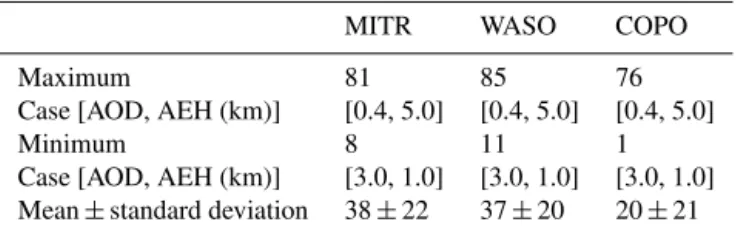
3.2.4 Surface albedo
As the surface albedo affects the−dO4/dZ, the sensitivity
Table 4.Absolute difference of O4I for changing surface albedo by 0.02.
MITR WASO COPO
Maximum 81 85 76
Case [AOD, AEH (km)] [0.4, 5.0] [0.4, 5.0] [0.4, 5.0]
Minimum 8 11 1
Case [AOD, AEH (km)] [3.0, 1.0] [3.0, 1.0] [3.0, 1.0] Mean±standard deviation 38±22 37±20 20±21
albedo is reduced by the high concentration of aerosol near the surface for the low AEH case.
Figure 11 shows the expected retrieval error of AEH due to surface albedo difference as changing AEH with respect to AOD and its types. As mentioned in the previous section, the −dO4/dZ is small in high AEH and low AOD cases.
Furthermore, the albedo sensitivity increases as AEH in-creases and AOD dein-creases. As a result, the AEH error is frequently larger than 1 km for high AEH with small AOD, especially when the AOD is less than 0.4. Because reflected radiance from surface is dominant for the thin aerosol case, the AEH error in high AEH with low AOD shows the largest value as compared to previous error analysis. However, the AEH error sharply decreases as AOD increases and AEH de-creases, when aerosol signal becomes dominant. Especially for MITR, four simulation cases, when AOD=0.4 with AEH
> 3.0 km and AOD=1.0 with AEH=5.0 km, show the AEH
error larger than 1 km. Because −dO4/dZ is too small in
these cases, AEH retrievals in the four simulation cases show limitation as a reliable result. For COPO and WASO, how-ever, all the cases in AEH < 3.0 km, which directly influence surface concentration, show errors lower than 750 m, even for the assumed AOD of 0.4. In addition, errors less than 500 m are found for AOD > 1.0 with AEH < 3.0 km.
3.2.5 Vertical distribution
Aerosol vertical distribution varies largely by distance from the source, atmospheric dynamics during aerosol transport, and sink mechanism in reality. To estimate the AEH error due to variation of aerosol vertical distribution, the half width of GDF distribution was doubled for comparison. Although it is not possible here to consider all kinds of aerosol vertical distributions due to the large variability of aerosol in profile, aerosol vertical distribution by changing the half width of GDF distribution can reflect large-scale changes in its verti-cal profile.
Table 5 shows the mean AEH errors between the two ver-tical profiles of aerosol as AOD changes. As the aerosol vertical profile is changed with an increase in its widths, the difference of O4I ranges from 100 to 430. Because the aerosol vertical profile simultaneously affects aerosol con-centration and layer thickness, the O4I difference shows a large value as the vertical distribution changes. For this
rea-son, the AEH error is larger than 2.5 km for all aerosol types with an AOD of 0.4. The estimated errors caused solely by the change between the two aerosol vertical pro-files, range 1477±602, 722±190, and 671±265 m for the
MITR, COPO, and WASO, respectively, for an AOD greater than 1.0.
3.3 Error budget
Table 6 shows the summary of the total error budget for the AEH estimation with a list of the major error sources and their values, assuming errors in each variable in OMI stan-dard products. To convert the O4I difference to the AEH er-ror, the difference of O4I due to the respective error source is divided by that from the change of the AEH in each bin of the AOD and AEH as shown in Sect. 3.2, with the sim-ulation cases over 58 800 runs listed in Table 3 to calculate mean and standard deviation of errors. Because of weak sig-nal sensitivity to AEH for AOD of 0.4 and AEH at 5.0 km as shown in the previous section, this simulation case is omitted in calculating statistical values for error budget. In summary, the total number of aerosol simulations for the combination of AOD and AEH includes 39 cases.
The mean errors from 10 % variation in the SSA for all of the variable conditions in Table 3 correspond to 726, 576, and 1047 m for the MITR, COPO, and WASO, respectively. For the total error budget calculations, however, SSA change by 5 % was used according to Torres et al. (2007), which re-ported the variation of the SSA less than 0.03 for the given aerosol type. The error from the vertical distribution is esti-mated to be 720, 1480, and 690 m for the COPO, MITR, and WASO, respectively.
The errors from SSA and aerosol profile shape are the two important error sources in estimating the AEH, followed by the errors related to AOD and surface albedo. From these re-sults, the errors of the AEH due to the error from OMI AOD of 0.1 and the surface albedo of 0.02 are less than 300 m for WASO and COPO, and about 400 m for MITR. However, the AEH error from surface albedo is important for cases with low AOD at high AEH, which is the surface reflectance dom-inant case.
Table 5.The error for AEH due to the change in aerosol vertical distribution.
Reference shape MITR WASO COPO (Width=1 km) (Width=2 km) (Width=2 km) (Width=2 km)
Error for AEH (m) 1477±602 671±265 722±190
Table 6.Summary of error sources and total error budget for the AEH retrieval.
Error source MITR WASO COPO
AOD (1AOD=0.2) 387±740 m 105±131 m 218±358 m
SSA (10 % change) 726±537 m 1047±194 m1 576±332 m
Surface albedo (1α=0.02) 438±762 m 199±241 m 154±274 m
Particle size (20 % change) 352±174 m 72±56 m 315±213 m
Atmospheric gases < 5 m Atmospheric pressure2(1P=3 %) 3.4±0.1 % (O4SCD)
Instrument (shift: 0.02 nm) < 10 m
Total error 1276 m 846 m 739 m
1Calculation results for the SSA decrease by 10 %.2For the clear-sky calculation.
ocean is 1010.9±29.6 (3σ) hPa, seen from NCEP
Reanaly-sis 2 data since 2004. In the clear-sky case, the difference of O4I due to the±3 % for pressure variation is 3.4±0.1 % in
all geometries.
Furthermore, the AEH error in terms of inaccurate spectral wavelength calibration is estimated based on the assumed er-rors of±0.02 nm, which corresponds to 0.1 pixels for OMI.
Although it is well known that the accuracy in the spectral wavelength calibration before the DOAS fitting affects the trace gas SCD retrieval, the errors in the O4I associated with the wavelength shift of the sub-pixel scale are estimated to be negligible due to the broad O4absorption band width around 477 nm.
Finally, the total error budget in the AEH retrieval is es-timated based on the error analysis with respect to error sources. Note that the result of error analysis explains about 50 % error for SSA and 25 % error for the size parameter in calculating the total error budget. Overall, the total error budget in the AEH retrieval is estimated to be 739, 1276, and 846 m for the COPO, MITR, and WASO, respectively, with the exception of the contribution of the errors in the aerosol vertical profiles. Therefore, accurate assumption for optical properties of aerosol is essential to develop the retrieval al-gorithm of aerosol height.
4 Case study
To demonstrate the feasibility of real measurements, the AEHs are derived using hyperspectral data from OMI. OMI channels are composed of UV-1 (270–314 nm), UV-2 (306– 380 nm), and a visible wavelength range (365–500 nm) with a spectral resolution (FWHM) of 0.63, 0.42, and 0.63 nm, respectively (Levelt et al., 2006). The spatial resolution is
13 km×24 km at nadir in “global mode”. In the present
study, the OMI spectral data over the visible wavelength range are used to derive the O4I at 477 nm and the AEH in-formation.
Figure 13. (a)MODIS RGB,(b)AOD, and(c)FMF; and(d)AEH distribution from OMI over East Asia;(e)backscattering intensity at 532 nm from CALIOP observations over the Yellow Sea on 31 March 2007.
representative aerosol optical properties for the LUT calcu-lation.
Figure 13 shows the results of the retrieved AEH during the Asian dust event on 31 March 2007. MODIS products of AOD and FMF on this date show a thick dust layer with an AOD up to 1.0 from China to the Yellow Sea (Fig. 13b) and the FMF ranging from 0.2 to 0.4, indicating the domi-nance of coarse-mode particles (Fig. 13c). Using the basis of
the current algorithm with the predetermined AOD and type, the mean retrieved AEH is 2.3±1.3 km over 647 pixels in
Figure 14. (a)MODIS RGB,(b)AOD, and(c)FMF; and(d)AEH distribution from OMI over East Asia;(e)backscattering intensity at 532 nm from CALIOP observations over the coastal region of China on 21 February 2008.
the AEH from OMI is 1.5±1.1 km over 166 pixels, which is
within 1 km difference from the CALIOP. From the retrieved result, the retrieved AEH is successfully retrieved within the expected error, and the current algorithm quantitatively esti-mates the AEH over East Asia.
Figure 14 shows another case study of the retrieved AEH on 21 February 2008. MODIS products of AOD and FMF on this date show thick anthropogenic aerosol transported, with
the AOD ranging from 0.6 to 1.0 (Fig. 14b) and the FMF ranging from 0.8 to 1.0 (Fig. 14c) all over the Yellow Sea. The mean retrieved AEH is 1.4±1.2 km over 1480 pixels in
Table 7.Dimensions of LUT for the AEH algorithm using OMI.
Variable name No. of entries Entries
SZA 7 0, 10, 20, 30, 40, 50, 60◦ VZA 7 0, 10, 20, 30, 40, 50, 60◦
RAA 10 0, 20, 40, 60, 80, 100, 120, 140, 160, 180◦
AOD 13 0.0, 0.2, 0.4, 0.6, 0.8, 1.0, 1.3, 1.6, 1.9, 2.2, 2.5, 3.0, 5.0
AEH 16 0.0, 1.0, 1.2, 1.4, 1.6, 1.8, 2.0, 2.2, 2.4, 2.6, 2.8, 3.0, 3.5, 4.0, 5.0, 10.0 km Aerosol model 3 Dust, carbonaceous, non-absorbing (climatology over East Asia AERONET site)
Figure 15. Comparison of AEH from OMI with CALIOP with (a)AOD > 0.5 and(b)AOD > 1.0 for aerosol transport cases in 2007 and 2008 over East Asia.
120–125◦E. Contrary to large spatial variation of the AEH from CALIOP, the AEH from OMI shows spatially stable values on this date.
Figure 15 shows the scatter plot of AEH between CALIOP and OMI on the dates in Table 8, which lists aerosol transport cases over East Asia with simultaneous observations by OMI and CALIOP in 2007 and 2008. The AEH from CALIOP is estimated by the data from vertical profiles of aerosol ex-tinction coefficient at 532 nm. Because the O4I sensitivity for AEH is not large at AEHs higher than 4 km, the com-parison test was limited to cases with AEH less than 4.5 km from OMI. For data collocation, the latitude and longitude
Table 8.List of aerosol transport cases and their periods for com-parison.
Case Period
1 28 Mar–2 Apr 2007 2 5–10 May 2007 3 25–26 May 2007 4 19–21 Feb 2008 5 3–5 Apr 2008 6 28–31 May 2008 7 4–7 Dec 2008
difference between two sensors is within 0.25◦. Figure 15a shows the comparison of AEH from OMI and CALIOP with MODIS AOD larger than 0.5. It is assumed that the reference expected error (EE) is 1 km (Fishman et al., 2012). Almost 60 % of retrieved pixels show the AEH result within the EE. Because of the large AEH error for low AOD, the accuracy of AEH result from OMI is poor. Furthermore, this case study assumes constant surface albedo value over ocean. However, ocean surface albedo is also changed by turbidity due to sed-iments and ocean surface due to wind. For this reason, the AEH error is exaggerated for low AOD cases. If the AOD for the comparison is set lower than 1.0, the proportion of pixel within EE improves up to 80 % as shown in Fig. 15b. Fur-thermore, the correlation of the AEH between the two sen-sors is improved with the regression line slope of 0.62 and the correlation coefficient (R) of 0.65 for thick aerosol layer
cases. Therefore, the AEH algorithm from OMI provides rea-sonable information about the parameter of aerosol vertical distribution if an accurate aerosol model is provided for the forward radiative transfer model calculation.
5 Summary and discussion
477 nm, while the spectral calibration and cross section of the atmospheric gases have negligible effects on the O4I. The major error source for the AEH retrieval is found to be the uncertainty in SSA, which leads to an AEH error ranging from 270 to 1400 m with an SSA perturbation of 10 %. In addition, the profile shape is also a major error source for the AEH estimation. According to the error estimations, the to-tal errors are 739, 1276, and 846 m for absorbing, dust, and non-absorbing aerosol, respectively, due to combined uncer-tainties of the variation from AOD, SSA, particle size, and surface albedo.
In addition to the sensitivity analysis, an algorithm for the AEH derivation is developed for the first time based on a LUT that consists of the O4I in terms of the AEH, AOD, aerosol types, surface albedo, and measurement geometries. After the determination of AOD and aerosol types from the MODIS, the AEH value is derived over East Asia by the cur-rent algorithm using OMI measurement data. Considering the accuracy of AOD and aerosol types, the result is shown over ocean surface. From several cases for the long-range transport of aerosol over East Asia, the derived AEH shows reasonable value as compared to aerosol layer height from CALIOP with the correlation coefficient of 0.62 for an AOD larger than 1.0. In addition, 80 % of estimated AEH from OMI showed an error of less than 1 km in AEH.
There is much work to be done in improving the newly in-troduced algorithm as it requires the products from MODIS to determine the AOD and aerosol types prior to the AEH re-trieval. The vertical distribution and the optical properties of the aerosol need to be quantified using a combination of ob-servation databases, such as MPLNET and AERONET. Fur-thermore, the spatial variation of the AOD, surface pressure, and the contamination by the cloud on the sub-pixel scale need to be investigated as they are also thought to affect the retrieved results. If the surface reflectance can be character-ized with sufficient accuracy, the retrieval of the AEH can be extended to over land. In addition, the O4I method in this study can be applied to the surface pressure estimation in clear regions.
Acknowledgements. This work was supported by the Eco Innova-tion Program of KEITI (grant no. 2012000160002), South Korea, and by the Brain Korea PLUS program.
Edited by: M. Van Roozendael
References
Accarreta, J. R., de Haan, J. F., and Stammes, P.: Cloud pressure retrieval using the O2-O2absorption band at 477 nm, J. Geophys. Res., 109, D05204, doi:10.1029/2003JD003915, 2004
Ahn, C., Torres, O., and Jethva, H.: Assessment of OMI near-UV aerosol optical depth over land, J. Geophys. Res., 119, 2457– 2473, doi:10.1002/2013JD020188, 2014.
Albrecht, B. A.: Aerosols, cloud microphysics, and fractional cloudiness, Science, 245, 1227–1230, 1989.
Bogumil, K., Orphal, J., Burrows, J. P., and Flaud, J. M.: Vibra-tional progressions in the visible and near-ultraviolet absorption spectrum of ozone, Chem. Phys. Lett., 349, 241–248, 2001. Castellanos, P., Boersma, K. F., Torres, O., and de Haan, J. F.: OMI
tropospheric NO2air mass factors over South America: effects of biomass burning aerosols, Atmos. Meas. Tech., 8, 3831–3849, doi:10.5194/amt-8-3831-2015, 2015.
Chiang, C.-W, Chen, W.-N., Liang, W.-A., Das, S. K., and Nee, J.-B.: Optical properties of tropospheric aerosols based on measure-ments of lidar, sun-photometer and visibility at Chung-Li (25◦N, 121◦E), Atmos. Environ., 41, 4128–4137, 2007.
Chimot, J., Vlemmix, T., Veefkind, J. P., de Haan, J. F., and Lev-elt, P. F.: Impact of aerosols on the OMI tropospheric NO2 re-trievals over industrialized regions: how accurate is the aerosol correction of cloud-free scenes via a simple cloud model?, At-mos. Meas. Tech. Discuss., 8, 8385–8437, doi:10.5194/amtd-8-8385-2015, 2015.
Chou, M.-D, Chan, P.-K., and Wang, M.: Aerosol radiative forc-ing derived from SeaWiFS-Retrieved aerosol optical properties, J. Atmos. Sci., 59, 748–757, 2002.
Christopher, S. A., Zhang, J., Kaufman, Y. J., and Remer, L. A.: Satellite-based assessment of top of atmosphere anthropogenic aerosol radiative forcing over cloud-free oceans, Geophys. Res. Lett, 33, L15816, doi:10.1029/2005GL025535, 2006.
Chu, D. A.: Analysis of the relationship between MODIS aerosol optical depth and PM, P. SPIE, 6299, 629903–629909, doi:10.1117/12.678841, 2006.
Chung, E. C., Ramanathan, V., Kim, D., and Podgorny. I. A.: Global anthropogenic aerosol direct forcing derived from satellite and ground-based observations, J. Geophys. Res., 110, D24207, doi:10.1029/2005JD006356, 2005.
Clémer, K., Van Roozendael, M., Fayt, C., Hendrick, F., Hermans, C., Pinardi, G., Spurr, R., Wang, P., and De Mazière, M.: Mul-tiple wavelength retrieval of tropospheric aerosol optical proper-ties from MAXDOAS measurements in Beijing, Atmos. Meas. Tech., 3, 863–878, doi:10.5194/amt-3-863-2010, 2010. Curier, R. L., Veefkind, J. P., Braak, R., Veihelmann, B., Torres,
O., and de Leeuw, G.: Retrieval of aerosol optical properties from OMI radiances using a multiwavelength algorithm: Ap-plication to western Europe, J. Geophys. Res., 113, D17S90, doi:10.1029/2007JD008738, 2008.
Dirksen, R. J., Boersma, K. F., de Laat, J., Stammes, P., van der Werf, G. R., Martin, M. V., and Kelder, H. M., An aerosol boomerang: Rapid around-the-world transport of smoke from the December 2006 Australian forest fires observed from space, J. Geophys. Res., 114, D21201, doi:10.1029/2009JD012360, 2009. Dubovik, O., Holben, B., Eck, T. F., Smirnov, A., Kaufman, Y. J., King, M. D., Tanre, D., and Slutsker, I.: Variability of absorption and optical properties of key aerosol types observed in world-wide locations, J. Atmos. Sci., 59, 590–608, 2002.
Fish, D. J. and Jones, R. L.: Rotational Raman scattering and the ring effect in zenith-sky spectra, Geophys. Res. Lett., 22, 811– 814, 1995.
Fishman, J., Iraci, L. T., Al-Saadi, J., Chance, K., Chavez, F., Chin, M., Coble, P., Davis, C., DiGiacomo, P. M., Edwards, D., Elder-ing, A., Goes, J., Herman, J., Hu, C., Jacob, D. J., Jordan, C., Kawa, S. R., Key, R., Liu, X., Lohrenz, S., Mannino, A., Natraj, V., Neil, D., Neu, J., Newchurch, M., Pickering, K., Salisbury, J., Sosik, H., Subramaniam, A., Tzortziou, M., Wang, J., and Wang, M.: The United States’ Next Generation of Atmospheric Com-position and Coastal Ecosystem Measurements: NASA’s Geosta-tionary Coastal and Air Pollution Events (GEO-CAPE) Mission, B. Am. Meteorol. Soc., 93, 1547–1566, 2012.
Friess, U., Monk, P. S., Remedios, J. J., Rozanov, A., Sinre-ich, R., Wagner, T., and Platt, U.: MAX-DOAS O4 measure-ments: A new technique to derive information on atmospheric aerosols: 2. Modeling studies, J. Geophys. Res., 111, D14203, doi:10.1029/2005JD006618, 2006.
Hayasaka, T., Satake, S., Shimizu, A., Sugimoto, N., Matsui, I., Aoki, K., and Muraji, Y.: Vertical distribution and optical prop-erties of aerosols observed over Japan during the Atmospheric Brown Clouds-East Asia Regional Experiment 2005, J. Geophys. Res., 112, D22S35, doi:10.1029/2006JD008086, 2007. Haywood, J. M. and Shine, K. P.: The effect of anthropogenic
sul-fate and soot aerosol on the clear sky planetary radiation budget, Geophys. Res. Lett., 22, 603–606, 1995.
Herman, J. R., Bhartia, P. K., Torres, O., Hsu, C., Seftor, C., and Celarier, E.: Global distribution of UV-absorbing aerosols from Nimbus-7/TOMS data, J. Geophys. Res., 102, 16911–16922, 1997.
Hermans, C., Vandaele, A. C., Carleer, M., Fally, S., Colin, R., Je-nouvrier, A., Coquart, B., and Merienne, M.: Absorption Cross-sections of atmospheric constituents: NO2, O2, and H2O, Envi-ron. Sci. Pollut. Res., 6, 151–158, 1999.
Hermans, C., Vandaele, A. C., Fally, S., Carleer, M., Colin, R., Co-quart, B., Jenouvrier, A., and Merienne, M. F.: Absorption cross-section of the collision-induced bands of oxygen from the UV to the NIR. In Weakly interacting molecular pairs: unconventional absorbers of radiation in the atmosphere, Springer, the Nether-lands, 193–202, 2003.
Hess, M., Koepke, P., and Schult, I.: Optical properties of aerosols and clouds: The software package OPAC, B. Am. Meteorol. Soc., 79, 831–844, 1998.
Higurashi, A. and Nakajima, T.: Detection of aerosol types over the East China Sea near Japan from four-channel satellite data, Geo-phys. Res. Lett., 29, 1836, doi:10.1029/2002GL015357, 2002. Holzer-Popp, T. and Schroedter-Homscheidt, M.: Synergetic
aerosol retrieval from ENVISAT, Proc. ERS/ENVISAT Sympo-sium, Salzburg, Vol. 6, No. 10.9, 2004.
Hutchison, K. D., Smith, S., and Faruqui, S. J.: Correlating MODIS aerosol optical thickness data with ground-based PM2.5 obser-vations across Texas for use in a real-time air quality prediction system, Atmos. Environ., 39, 7190–7203, 2005.
Irie, H., Kanaya, Y., Akimoto, H., Iwabuchi, H., Shimizu, A., and Aoki, K.: Dual-wavelength aerosol vertical profile measurements by MAX-DOAS at Tsukuba, Japan, Atmos. Chem. Phys., 9, 2741–2749, doi:10.5194/acp-9-2741-2009, 2009.
Irie, H., Takashima, H., Kanaya, Y., Boersma, K. F., Gast, L., Wit-trock, F., Brunner, D., Zhou, Y., and Van Roozendael, M.:
Eight-component retrievals from ground-based MAX-DOAS observa-tions, Atmos. Meas. Tech., 4, 1027–1044, doi:10.5194/amt-4-1027-2011, 2011.
Irie, H., Nakayama, T., Shimizu, A., Yamazaki, A., Nagai, T., Uchiyama, A., Zaizen, Y., Kagamitani, S., and Matsumi, Y.: Evaluation of MAX-DOAS aerosol retrievals by coincident ob-servations using CRDS, lidar, and sky radiometer inTsukuba, Japan, Atmos. Meas. Tech., 8, 2775–2788, doi:10.5194/amt-8-2775-2015, 2015.
Jeong, M.-J., and Hsu, N. C.: Retrievals of aerosol single-scattering albedo and effective aerosol layer height for biomass-burning smoke: Synergy derived from “A-Train” sensors, Geophys. Res. Lett., 35, L24801, doi:10.1029/2008GL036279, 2008.
Jethva, H., Torres, O., and Ahn, C.: Global assessment of OMI aerosol single-scattering albedo using ground-based AERONET inversion, J. Geophys. Res., 119, 9020–9040, doi:10.1002/2014JD021672, 2014.
Johnson, B. T., Heese, B., McFarlane, S. A., Chazette, P., Jones, A., and Bellouin, N.: Vertical distribution and radia-tive effects of mineral dust and biomass burning aerosol over West Africa during DABEX, J. Geophys. Res., 113, D00C12, doi:10.1029/2008JD009848, 2008.
Jones, A., Roberts, D. L., and Slingo, A.: A climate model study of indirect radiative forcing by anthropogenic sulphate aerosols, Nature, 370, 450–453, 1994.
Jones, T. A. and Christopher, S. A.: MODIS derived fine mode frac-tion characteristics of marine, dust, and anthropogenic aerosols over the ocean, constrained by GOCART, MOPITT, and TOMS, J. Geophys. Res., 112, D22204, doi:10.1029/2007JD008974, 2007.
Kaufman, Y. J., Tanre, D., and Boucher, O.: A satellite view of aerosols in the climate system, Nature, 419, 215–223, 2002. Kim, J., Lee, J., Lee, H. C., Higurashi, A., Takemura, T., and Song,
C. H.: Consistency of the aerosol type classification from satellite remote sensing during the Atmospheric Brown Cloud – East Asia Regional Experiment campaign, J. Geophys. Res., 112, D22S33, doi:10.1029/2006JD008201, 2007.
Kleipool, Q. L., Dobber, M. R., de Haan, J. F., and Levelt, P. F.: Earth surface reflectance climatology from 3 years of OMI data, J. Geophys. Res., 113, D18308, doi:10.1029/2008JD010290, 2008.
Koelemeijer, R. B. A., de Haan, J. F., and Stammes, P.: A database of spectral surface reflectivity in the range 335–772 nm derived from 5.5 years of GOME observations, J. Geophys. Res., 108, 4070, doi:10.1029/2002JD002429, 2003.
Kokhanovsky, A. A. and Rozanov, V. V.: The determination of dust cloud altitudes from a satellite using hyperspectral measurements in the gaseous absorption band, Int. J. Remote. Sens., 31, 2729– 2744, 2010.
Koppers, G. A. A. and Murtagh, D. P.: Retrieval of height resolved aerosol optical thickness in the atmospheric band (Chapter 5), in: Radiative transfer in the absorption bands of oxygen: Studies of their significance in ozone chemistry and potential for aerosol remote sensing, edited by: Koppers, G. A. A., Stockholm Uni-versity, Stockholm, Sweden, 1997.
Lee, H., Irie, H., Kim, Y. J., Noh, Y., Lee, C., Kim, Y., and Chun, K. J.: Retrieval of aerosol extinction in the lower troposphere based on UV MAX-DOAS measurements, Aerosol Sci. Tech., 43, 502– 509, 2009.
Lee, H., Irie, H., Gu, M., Kim, J., and Hwang, J.: Remote sens-ing of tropospheric aerosol ussens-ing UV MAX-DOAS dursens-ing hazy conditions in winter: Utilization of O4absorption bands at wave-length intervals of 338–368 and 367–393 nm, Atmos. Environ., 45, 5760–5769, doi:10.1016/j.atmosenv.2011.07.019, 2011 Lee, J., Kim, J., Lee, H. C., and Takemura, T.: Classification of
aerosol type from MODIS and OMI over East Asia, Asia-Pac. J. Atmos. Sci., 43, 343–357, 2007.
Lee, J., Kim, J., Song, C. H., Ryu, J.-H., Ahn, Y.-H., and Song, C. K.: Algorithm for retrieval of aerosol optical properties over the ocean from the Geostationary Ocean Color Imager, Remote Sens. Environ., 114, 1077–1088, 2010.
Levelt, P. F., van den Oord, G. H. J., Dobber, M. R., Maelkki, A., Visser, H., de Vries, J., Stammes, P., Lundell, J. O. V., and Saari, H.: The Ozone Monitoring Instrument, IEEE T. Geosci. Remote., 44, 1093–1101, 2006.
Levy, R. C., Remer, L. A., Mattoo, S., Vermote, E. F., and Kauf-man, Y. J.: Second-generation operational algorithm : Retrieval of aerosol properties over land from inversion of Moderate Res-olution Imaging Spectroradiometer spectral reflectance, J. Geo-phys. Res., 112, D13211, doi:10.1029/2006JD007811, 2007. Li, X., Brauers, T., Shao, M., Garland, R. M., Wagner, T.,
Deutschmann, T., and Wahner, A.: MAX-DOAS measurements in southern China: retrieval of aerosol extinctions and validation using ground-based in-situ data, Atmos. Chem. Phys., 10, 2079– 2089, doi:10.5194/acp-10-2079-2010, 2010.
Lin, J.-T., Martin, R. V., Boersma, K. F., Sneep, M., Stammes, P., Spurr, R., Wang, P., Van Roozendael, M., Clémer, K., and Irie, H.: Retrieving tropospheric nitrogen dioxide from the Ozone Monitoring Instrument: effects of aerosols, surface reflectance anisotropy, and vertical profile of nitrogen dioxide, Atmos. Chem. Phys., 14, 1441–1461, doi:10.5194/acp-14-1441-2014, 2014.
Lin, J.-T., Liu, M.-Y., Xin, J.-Y., Boersma, K. F., Spurr, R., Martin, R., and Zhang, Q.: Influence of aerosols and surface reflectance on satellite NO2retrieval: seasonal and spatial characteristics and implications for NOxemission constraints, Atmos. Chem. Phys., 15, 11217-11241, doi:10.5194/acp-15-11217-2015, 2015. Liu, Y., Sarnat, J. A., Kilaru, V., Jacob, D. J., and Koutrakis, P.:
Es-timating ground-level PM2.5in the Eastern United States using satellite remote sensing, Environ. Sci. Technol., 39, 3269–3278, 2005.
Nakajima, T. and Higurashi, A.: A use of two-channel radiances for and aerosol characterization from space, Geophys. Res. Lett., 25, 3815–3818, 1998.
Newnham, D. A. and Ballard, J.: Visible absorption cross sections and integrated absorption intensities of molecular oxygen (O2 and O4), J. Geophys. Res., 103, 28801–28816, 1998.
Omar, A. H., Winker, D. M., Kittaka, C., Vaughan, M. A., Liu, Z., Hu, Y., Trepte, C. R., Rogers, R. R., Ferrare, R. A., Lee, K.-P., Kuehn, R. E., and Hostetler, C. A.: The CALIPSO automated aerosol classification and lidar ratio selection algorithm, J. At-mos. Ocean. Tech., 26, 1994–2014, 2009.
Payne, R. E.: Albedo of the Sea Surface, J. Atmos. Sci., 29, 959– 970, 1972.
Platt, U.: Differential optical absorption spectroscopy (DOAS), Air Monitoring by Spectroscopic Technique, 127, 27–84, 1994. Platt, U. and Stutz, J.: Differential absorption spectroscopy,
Springer, Berlin, Heidelberg, 2008.
Prospero, J. M.: Long-term measurements of the transport of African mineral dust to the southeastern United States: Impli-cations for regional air quality, J. Geophys. Res., 104, 15917– 15927, 1999.
Reid, J. S., Westphal, D. L., Livingston, J. M., Savoie, D. L., Mar-ing, H. B., Jonsson, H. H., Eleuterio, D. P., Kinney, J. E., and Reid, E. A.: Dust vertical distribution in the Caribbean during the Puerto Rico Dust Experiment, Geophys. Res. Lett., 29, 1151, doi:10.1029/2001GL014092, 2002.
Remer, L. A., Kleidman, R. G., Levy, R. C., Kaufman, Y. J., Tanre, D., Mattoo, S., Martins, J. V., Ichoku, C., Koren, I., Yu, H., and Holben, B. N.: Global aerosol climatology from the MODIS satellite sensors, J. Geophys. Res., 113, D14S07, doi:10.1029/2007JD009661, 2008.
Sanders, A. F. J. and de Haan, J. F.: Retrieval of aerosol parameters from the oxygen A band in the presence of chlorophyll fluores-cence, Atmos. Meas. Tech., 6, 2725–2740, doi:10.5194/amt-6-2725-2013, 2013.
Sanders, A. F. J., de Haan, J. F., Sneep, M., Apituley, A., Stammes, P., Vieitez, M. O., Tilstra, L. G., Tuinder, O. N. E., Koning, C. E., and Veefkind, J. P.: Evaluation of the operational Aerosol Layer Height retrieval algorithm for Sentinel-5 Precursor: application to O2 A band observations from GOME-2A, Atmos. Meas. Tech., 8, 4947–4977, doi:10.5194/amt-8-4947-2015, 2015. Sanghavi, S., Martonchik, J. V., Landgraf, J., and Platt, U.: Retrieval
of the optical depth and vertical distribution of particulate scat-terers in the atmosphere using O2A- and B-band SCIAMACHY observations over Kanpur: a case study, Atmos. Meas. Tech., 5, 1099–1119, doi:10.5194/amt-5-1099-2012, 2012.
Sasano, Y.: Tropospheric aerosol extinction coefficient profiles de-rived from scanning lidar measurements over Tsukuba, Japan, from 1990 to 1993, Appl. Opt., 35, 4941–4952, 1996.
Seo, S., Kim, J., Lee, H., Jeong, U., Kim, W., Holben, B. N., Kim, S.-W., Song, C. H., and Lim, J. H.: Estimation of PM10concentrations over Seoul using multiple empirical mod-els with AERONET and MODIS data collected during the DRAGON-Asia campaign, Atmos. Chem. Phys., 15, 319–334, doi:10.5194/acp-15-319-2015, 2015.
Shimizu, A., Sugimoto, N., Matsui, I., Arao, K., Uno, I., Murayama, T., Kagawa, N., Aoki, K., Uchiyama, A., and Yamazaki, A.: Con-tinuous observation of Asian dust and other aerosols by polar-ization lidars in China and Japan during ACE-Asia, J. Geophys. Res., 109, D19S17, doi:10.1029/2002JD003253, 2004. Sneep, M., de Haan, J. F., Stammes, P., Wang, P., Vanbauce, C.,
Joiner, J., Vasilkov, A. P., and Levelt, P. F.: Three-way compar-ison between OMI and PARASOL cloud pressure products, J. Geophys. Res., 113, D15S23, doi:10.1029/2007JD008694, 2008. Spurr, R. and Christi, M.: On the generation of atmospheric prop-erty Jacobians from the (V)LIDORT linearized radiative transfer models, J. Quant. Spectrosc. Ra., 142, 109–115, 2014.
Spurr, R. J. D.: VLIDORT: A linearized pseudo-spherical vector discrete ordinate radiative transfer code for forward model and retrieval studies in multilayer multiple scattering media, J. Quant. Spectrosc. Ra., 102, 316–342, 2006.
Spurr, R. J. D., Kurosu, T. P., and Chance, K. V.: A linearized dis-crete ordinate radiative transfer model for atmospheric remote-sensing retrieval, J. Quant. Spectro. Rad. Trans., 68, 689-735, 2001.
Stutz, J. and Platt, U.: Numerical analysis and estimation of the statistical error of differential optical absorption spectroscopy measurements with least-squares methods, Appl. Optics, 35, 30, 6041–6053, 1996.
Torres, O., Bhartia, P. K., Herman, J. R., Ahmad, Z., and Gleason, J.: Derivation of aerosol properties from satellite measurements of backscattered ultraviolet radiation: Theoretical basis, J. Geophys. Res., 103, 17099–17110, 1998.
Torres, O., Decae, R., Veefkind, P., and de Leeuw, G.: OMI Aerosol Retrieval Algorithm, OMI Algorithm Theoretical Basis Docu-ment, Vol. III, Clouds, Aerosols and Surface UV Irradiance, NASA-KNMI ATBD-OMI-03, 47–71, 2002.
Torres, O., Bhartia, P. K., Sinyuk, A., Welton, E. J., and Hol-ben, B. N.: Total Ozone Mapping Spectrometer measurements of aerosol absorption from space: Comparison to SAFARI 2000 ground-based observations, J. Geophys. Res., 110, D10S18, doi:10.1029/2004JD004611, 2005.
Torres, O., Tanskanen, A., Veihelmann, B., Ahn, C., Braak, R., Bhartia, P. K., Veefkind, P., and Levelt, P.: Aerosols and surface UV products from Ozone Monitoring Instrument ob-servations: An overview, J. Geophys. Res., 112, D24S47, doi:10.1029/2007JD008809, 2007.
Twomey, S. A., Piepgrass, M., and Wolfe, T. L.: An assessment of the impact of pollution on the global albedo, Tellus, 36, 356–366, 1984.
United States Committee on Extension to the Standard Atmosphere: US Standard Atmosphere 1976, National Oceanic and Atmo-spheric Administration, NASA, United States Air Force, Wash-ington D.C., USA, 1976.
Vandaele, A. C., Hermans, C., Simon, P. C., Carleer, M., Colin, R., Fally, S., Merienne, M. F., Jenouvrier, A., and Coquart, B.: Measurements of the NO2absorption cross-section from 42000 cm−1 to 10000 cm−1 (238–1000 nm) at 220 K and 294 K, J. Quant. Spectrosc. Ra., 59, 171–184, 1998.
van Roozendael, M. and Fayt, C.: WinDOAS 2.1 Software user manual, Uccle, IASB/BIRA, 2001.
Veefkind, J. P., de Leeuw, G., Durkee, P. A., Russell, P. B., Hobbs, P. V., and Livingston, J. M.: Aerosol optical depth retrieval using ATSR-2 and AVHRR data during TARFOX, J. Geophys. Res., 104, 2253–2260, 1999.
Veihelmann, B., Levelt, P. F., Stammes, P., and Veefkind, J. P.: Sim-ulation study of the aerosol information content in OMI spectral reflectance measurements, Atmos. Chem. Phys., 7, 3115–3127, doi:10.5194/acp-7-3115-2007, 2007.
Wagner, T., Dix, B., Friedeburg, C. V., Friess, U., Sanghavi, S., Sin-reich, R., and Platt, U.: MAX-DOAS O4measurements: A new technique to derive information on atmospheric aerosols- Prin-ciples and information content, J. Geophys. Res., 109, D22205, doi:10.1029/2004JD004904, 2004.
Wagner, T., Beirle, S., Deutschmann, T., Grzegorski, M., and Platt, U.: Satellite monitoring of different vegetation types by differ-ential optical absorption spectroscopy (DOAS) in the red spec-tral range, Atmos. Chem. Phys., 7, 69–79, doi:10.5194/acp-7-69-2007, 2007.
Wagner, T., Deutschmann, T., and Platt, U.: Determination of aerosol properties from MAX-DOAS observations of the Ring effect, Atmos. Meas. Tech., 2, 495–512, doi:10.5194/amt-2-495-2009, 2009.
Wagner, T., Beirle, S., Deutschmann, T., and Penning de Vries, M.: A sensitivity analysis of Ring effect to aerosol properties and comparison to satellite observations, Atmos. Meas. Tech., 3, 1723–1751, doi:10.5194/amt-3-1723-2010, 2010.
Wang, J. and Christopher, S. A.: Intercomparison between satellite-derived aerosol optical thickness and PM2.5 mass: Implica-tions for air quality studies, Geophys. Res. Lett., 30, 2095, doi:10.1029/2003GL018174, 2003.
Wang, P., Tuinder, O. N. E., Tilstra, L. G., de Graaf, M., and Stammes, P.: Interpretation of FRESCO cloud retrievals in case of absorbing aerosol events, Atmos. Chem. Phys., 12, 9057– 9077, doi:10.5194/acp-12-9057-2012, 2012.
Watson, J. G., Chow, J. C., Lu, Z., Fujita, E. M., Lowenthal, D. H., Lawson, D. R., and Ashbaugh, L. L.: Chemical mass balance source apportionment of PM10 during the Southern California air quality study, Aerosol Sci. Tech., 21, 1–36, 1994.
Yang, K., Liu, X., Bhartia, P. K., Krotkov, N. A., Carn, S. A., Hughes, E. J., Krueger, A. J., Spurr, R. J. D., and Trahan, S. G.: Direct retrieval of sulfur dioxide amount and altitude from space-borne hyperspectral UV measurements: Theory and application, J. Geophys. Res., 115, D00L09, doi:10.1029/2010JD013982, 2010.