Structural studies of a new electroceramic composite:
Pb(Fe
0.5Nb
0.5)O
3(PFN)-Cr
0.75Fe
1.25O
3(CRFO)
F. N. A. FreireÆH. H. B. RochaÆM. R. P. SantosÆ
P. B. A. FechineÆF. M. M. PereiraÆ R. S. T. M. SohnÆ
I. F. VasconcelosÆ A. S. B. Sombra
Received: 11 April 2007 / Accepted: 9 August 2007 / Published online: 26 September 2007
ÓSpringer Science+Business Media, LLC 2007
Abstract A study of the structural characteristics of the composites [Pb(Fe0.5Nb0.5)O3(PFN)]x-[Cr0.75Fe1.25O3
(CRFO)]100–x (x= 0 (CRFO100), 10, 50, 90, 100) was
performed in this work. The compounds PFN100 and CRFO100 were prepared by conventional solid-state method and investigated by X-Ray Diffraction (XRD), Scanning Electron Microscopy (SEM), and57Fe Mo¨ssbauer Spectroscopy techniques. The X-ray analysis shows that PFN100 is tetragonal and the CRFO100 phase has a trigonal symmetry. The refinement of all the composites was also performed and discussed in this paper. The Mo¨ssbauer spectrum for the composite samples shows a paramagnetic
doublet and a sextet probably assigned to a magnetic phase associated to Fe+3. For the sample PFN100, only a magnetic field of 49.5 T (isomer shift (d) = 0.21 mm/s) was detected. For the composite sample, thedandDare typical of Fe ions at sites of octahedral coordination.
Introduction
The demands for miniaturization in the microwave com-munication technologies require continuing discovery and development of new materials [1]. Fabrication of micro-wave ceramics with high relative dielectric permittivity (or dielectric constant) (er) and good thermostability together with small dielectrics losses in wide temperature and fre-quency ranges is an actual problem since the application of such materials in the microwave technology ensures reduction of mass and overall dimensions of microwave [2]. A combined study of both the crystal structure and the electro-physical properties of new compounds and solid solutions is necessary for the development of new ceramic material [2]. Physical properties of a material depend upon the microstructures and therefore by controlling the microstructure, materials can be designed (or optimal selected instead, in agreement with [3], according to desirable properties [4]. Effective synthesis techniques providing reproducibility in commercial production of high electro-physical parameters of ceramic materials and of microwave elements based on them have to be developed. Pb(Fe1/2Nb1/2)O3 (PFN), a lead-based complex
perov-skite, is regarded as a good candidate as a multilayer ceramic capacitor owing to its high dielectric constant and low sintering temperature [5].
Multilayer ceramic capacitors, because of their large capacitance, highly compact design, and reliability, have F. N. A. FreireP. B. A. FechineF. M. M. Pereira
Departamento de Quı´mica Orgaˆnica e Inorgaˆnica, Universidade Federal do Ceara´, Fortaleza, Ceara CEP 60455-760, Brazil
H. H. B. Rocha
Departamento de Engenharia de Teleinforma´tica, Universidade Federal do Ceara´, Fortaleza, Ceara CEP 60455-970, Brazil
F. N. A. FreireH. H. B. RochaM. R. P. Santos P. B. A. FechineF. M. M. PereiraR. S. T. M. SohnA. S. B. Sombra (&)
Laborato´rio de Telecomunicac¸o˜es e Cieˆncia e Engenharia dos Materiais (LOCEM), Departamento de Fı´sica, Universidade Federal do Ceara´, Caixa Postal 6030, Fortaleza, Ceara CEP 60455-760, Brazil
e-mail: [email protected] URL: www.locem.ufc.br
I. F. Vasconcelos
Departamento de Engenharia Metalu´rgica e de Materiais, Universidade Federal do Ceara´, Fortaleza, Ceara CEP 60455-760, Brazil
F. N. A. Freire
Faculdade de Educac¸a˜o, Cieˆncias e Letras do Serta˜o Central– Curso de Quı´mica, Universidade Estadual do Ceara´, Quixada´, Ceara CEP 63900-000, Brazil
become promising candidates for electronic devices. Alkaline earth titanate barium titanate for example BaTiO3
and its solid solutions have been traditionally used for this application for almost five decades [6].
The polycrystalline ceramic Cr0.75Fe1.25O3(CRFO) [7]
is a member of hematite (a-Fe2O3) and eskolaite (Cr2O3) system (CrYFe2–YO3, Y= 0.75). Hematite and eskolaite
were classified as anti-ferromagnetic insulators [8] and as high resistivity similar to that of Cu2O [9]. They present a
continuous solid solution in the entire concentration range [10,11], that is characteristic of corundum oxides [8]. Both the end members of the series are anti-ferromagnetically ordered at room temperature (a-Fe2O3 below Ne´el tem-peratureTN= 682°C, Cr2O3TN= 27°C), however the spin
ordering in these oxides has different symmetry and is markedly weaker in Cr2O3[8]. Results on the Mo¨ssbauer
spectra was measured in the range ofY= 0 toY= 2 [8].
The single-phase ceramic of PFN [Pb(Fe0.5Nb0.5)O3] has
been reported difficult to produce because of the appear-ance of stable pyrochlore phases (i.e., Pb3Nb4O13 and
Pb2Nb2O7 after calcinations). To avoid the formation of
pyrochlore in PMN, Swartz and Shrout [12,13] proposed a two-stage calcinations route. It consists of two calcinations steps; coulumbite precursor is formed first followed by formation of perovskite. The amount of pyrochlore phase is greatly reduced. In the work of Lejeune and Boilot [14], pure PFN powder is obtained after the mixture of 4PbO, Fe2O3, and Nb2O5is processed at 850°C for 16 h. Shrout
et al. [13] prepared PFN powders by first mixing and reacting Fe2O3 and Nb2O5 at 1,000°C for 4 h to form
FeNbO4. Then, FeNbO4 reacts with PbO at temperature
ranging from 750°C to 800°C for 4 h.
Perovskite lead-based solid solutions were reported to be sintered at temperature range of 850–1100°C [14, 15].
Stoichiometric Pb(Fe0.5Nb0.5)O3(PFN) perovskite ceramics
produced by reaction-sintering process were investigated [16]. Lead iron niobate is one of the family of lead-based complex perovskites, which is of interest as a component in commercial electronic ceramic materials because of its high relative permittivity and low sintering temperature [17]. Many investigations have been carried out on the microwave dielectric properties of modified lead iron niobates per-ovskites by A-site or B-site substitution [18,19]. CaTiO3
modified Pb(Fe0.5Nb0.5)O3 dielectrics were prepared by
solid-state process and the structure analysis was performed together with the dielectric characterization [20].
In this work is reported the preparation of the PFN100 and CRFO100 ceramics through the solid state route and uses these materials to prepare the composite samples. The samples were studied through X-ray diffraction, Scanning Electron Microscopy (SEM), and Mo¨ssbauer Spectroscopy techniques. The production and study of the properties of the composite PFN-CRFO is important in view of possible
applications in microwave and RF devices based in high dielectric constant materials.
Experimental methods
In the CRFO phase, detailed in [7], study we choose to follow the ytrium iron garnet stoichiometry (Y3Fe5O12) and
for phase PFN, we choose to follow perovskite stoichi-ometry PbTiO3.
Y3Fe5O12 Cr3Fe5O12
¼Cr0:75Fe1:25O3!CrYFe2YO3
ðCRFO;Y¼0:75Þ
ð1Þ
PbTiO3¼PbðFe0:5Nb0:5ÞO3!PbðFexNbxÞO3
ðPFN; X¼0:5Þ
ð2Þ
Polycrystalline samples of PFN and CRFO, whose chemical composition is given by the formulae Cr0.75Fe1.25O3 and Pb(Fe0.5Nb0.5)O3, respectively, were
synthesized by conventional solid-state reaction methods. Reagents oxides were accurately weighed in stoichiometric amounts of Fe2O3 (Aldrich, 99+%) and Cr2O3 (Reagen,
99.8%) for CRFO, and Fe2O3 (Aldrich, 99+%), Nb2O5
(Aldrich 99+%) and PbO (Aldrich, 99.9+%) for PFN. The starting materials were hand-ground in an agate mortar. Prior to the first heat treatment, high-energy ball milling of the homogeneous powder mixture hand-grounded was conducted in a planetary ball mill (Fritsch Pulverisette 6). The rotation speed of the disks carrying the sealed vials was 400 rpm. Milling of powder samples was done at room temperature in stainless steel vial (volume * 110 mL) using 20 stainless steel balls (4 g and 10 mm diameter). The time of the mechanical milling operation was 60 min. This operation was merely used to give an improved homogeneity to the powder. Subsequently, the mixtures of oxide were calcined in conventional controlled furnaces (Rapid Temp Furnace/Eurotherm 2404 and EDG 1800/ EDGCON3P) at 1,570 K for 5 h to synthesize CRFO100 in atmospheric air. A solid-state reaction process with the columbite precursor method [14], where the raw powder had high purity (more than 99%), was used to synthesize PFN. The FeNbO4phase was first synthesized at 1,370 K
for 3 h in atmospheric air, then the Pb(Fe0.5Nb0.5)O3
powder was synthesized by a mixture of FeNbO4and PbO,
CRFO)) PFN50 (X = 50(50%PFN + 50%CRFO)), PFN10 (X = 10 (10%PFN + 90%CRFO)), and CRFO100(X = 0 (0%PFN + 100%CRFO)). They were uniaxially pressed
(270 MPa) into pellets in a steel die. The pellets, whose typical dimensions were 4.4 mm in diameter and 2 mm in thickness, were sintered at 1,120 K for 3 h in atmospheric air.
X-ray diffraction
The X-ray powder diffraction profiles of the prepared samples were recorded using a powder X-ray diffractom-eter system Rigaku D/max-B, composed of X-ray generator, X-ray optics and goniometer, X-ray detector and counting system, and recorder for data recording or storing [20]. Powder samples were fixed on a silicon plate with silicon paste. Patterns were collected at laboratory tem-perature (about 294 K) using Cu Karadiation at 40 kV and 25 mA in the geometry of Bragg-Brentano, in steps of 0.02°2hat 2 s/ step, ranging from 20°to 60°(2h).
In the present study, the Rietveld’s powder structure refinement analysis [21–23] of X-ray powder diffraction data is adopted to obtain the refined structural parameters, such as atomic coordinates, lattice parameters, thermal parameters, etc. The Rietveld’s software DBWS-9807a [24] is specially designed to refine the structural parameters through a least-squares method. The peak shape was assumed to be pseudo-Voigt (pV) function with asymme-try. The background of each pattern was fitted by a polynomial function of degree 5. Refinements were con-ducted without refining the anisotropic atomic thermal parameters or occupancies.
The least-square procedures were adopted for minimi-zation of the difference between the observed and simulated powder diffraction pattern. The minimization was carried out by using the reliability index parameters RWP (weighted residual error) and Durbin-Watson
d-sta-tistic dDW. The refinement continues till convergence is
reached with the value of the quality factor Goodness of fit (SGoF) very close to 1 (varies between 1.23 and 1.37),
which confirms the goodness of refinement.
Scanning Electron Microscopy
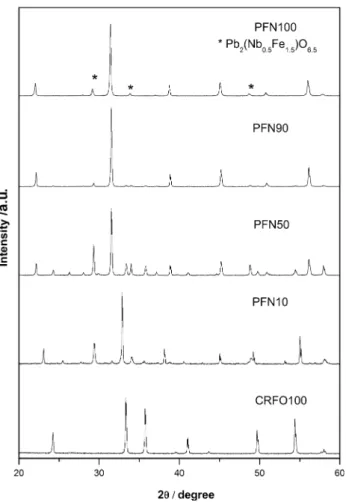
The scanning electron microscopy combined with energy dispersive analysis used in the study of ceramics is Fig. 1 XRD patterns of composite samples PFN100, PFN90, PFN50,
PFN10, CRFO100. [*(Pb2(Nb0.5Fe1.5)O6.5)]
Table 1 CRFO100: atomic positions (X, Y, Z), refined isotropic thermal parameters (B) and site occupancies (S0)
A´ tom Wyckoff position
X Y Z B S0
Fe1 12c 0.000000 0.000000 0.353012 3.3467 0.625 Cr1 12c 0.000000 0.000000 0.353012 0.0000 0.375 O1 18e 0.695898 0.000000 0.250000 1.9626 1.000
Table 2 PFN100: atomic positions (X, Y, Z), refined isotropic thermal parameters (B) and site occupancies (S0)
A´ tom Wyckoff Position
X Y Z B S0
Pb 1a 0.000000 0.000000 0.004000 0.0000 1.000 Nb 1b 0.500000 0.500000 0.500000 0.0000 0.500 Fe1 1b 0.500000 0.500000 0.500000 0.0000 0.500 O1 1b 0.500000 0.500000 0.030000 0.0000 1.000 O2 1c 0.500000 0.000000 0.492000 0.5000 1.000
Table 3 Numerical criteria of fit and density
Sample RP(%) RWP(%) RB(%) SGof dDW Density (g/cm3)
generally of morphological interest. By scanning an elec-tron probe across a specimen, high-resolution images of the specimen with very high magnifications was obtained. Compositional analysis of a material also was obtained by monitoring secondary X-rays produced by electron-speci-men interaction. The microstructure observation and compositional analysis of the sintered surface of the cylindrical specimens, covered with a thin layer of carbon, was performed by scanning electron microscopy, on a scanning electron microscope, Phillips XL-30, equipped with an EDS detector EDAX-CDU Leap Detector.
57
Fe Mo¨ssbauer Spectroscopy
The Mo¨ssbauer spectra were obtained in standard trans-mission geometry, using a constant acceleration spectrometer with a radioactive source of 37Co in Rh matrix. Measurements were carried out at room tempera-ture on powder samples. The spectra were evaluated using the Normos fitting routine which makes use of a set of Lorentzian, and computes the contribution of each curve to the total absorption spectrum, by least square procedure. All the isomer shifts (d) quoted are relative to metallic iron (a-Fe).
Results and discussion
Rietveld analysis
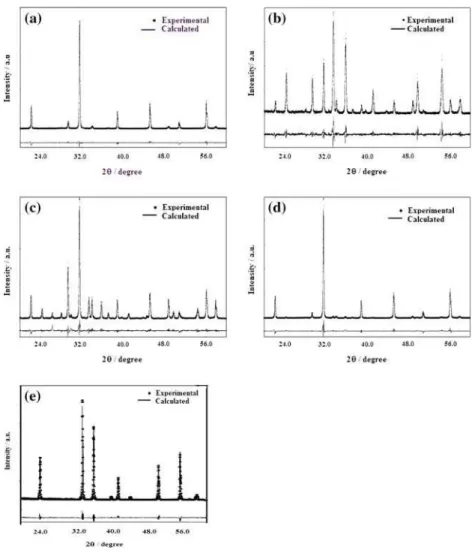
The XRD patterns of PFN100, PFN90, PFN50, PFN10, CRFO100 composite samples are shown in Fig.1. In the Rietveld procedure, a model based on iron oxide [25] and chromium oxide [26] was used for CRFO100, is Fig. 2 The diffraction pattern
of sample (a) PFN100 (b) PFN10 (c) PFN50 (d) PFN90 (e) CRFO100 The dotted line is the experimental pattern and the straight line is the calculated pattern. The differences are shown below them
Table 4 Comparison between the nominal percentage used in the sample preparation and the data obtained from the Quantitative Phase Analysis (QPA), without internal standard
Sample PFN100 CRFO100
Nominal AQF Nominal AQF
% %
PFN90 90 92.70 10 7.30
PFN50 50 55.02 50 44.98
summarized in Table1. The structural and thermal parameters for the PFN100 are summarized in Table2. In Table3 the data obtained from the Rietveld procedure associated to PFN and CRFO compounds are collected.
The CRFO presents at room temperature, a trigonal structure belonging to group R3c (#167), with six mole-cules in the unity cell (Z = 6). In the structure, the iron and
chromium are localized in the Wyckoff Positions 12c, where the oxygen ion occupies the site 18e (Table1). The refinement is illustrated in Fig.2e.
In Fig.2a, we have the refinement of PFN100. To a first approximation, this major phase has a tetragonal perovskite type structure, space group P4mm (JCPDS file #88-356) with cell parameter a= b= 4.0116 A˚ , c= 4.007 A˚ . The additional reflection (marked by *) is correlated with a pyrochlore phase of lead niobium oxide, Pb2(Nb0.5Fe1.5)O6.5(JCPDS file # 39-888). This phase has
a cubic structure with cell parametera= 10.5486 A˚ . In Fig.2b–d we have the numerical and experimental diffraction of the samples PFN10, PFN50, and PFN90,
respectively. The major numerical criteria of fit for this analyze were Rwp, RB, SGof, and dDW(see Table 3).
In Table4, we have the Quantitative Phase Analysis (QPA) without internal standard, of the samples obtained from the refinement procedure. One can observe that the QPA is in good agreement for the composites phase in the sample of PFN10, PFN50, and PFN90. The Rietveld’s method was useful for determination of quantitative phase abundances of the composite materials. In this procedure, only the phases PFN100 and CRFO100 were considered. The existence of pyrochlore phase [Pb2(Nb0.5Fe1.5)O6.5] is
probably the responsible for observed variance of the results.
Scanning electron microscopy
The grain morphology of the samples was investigated by Scanning Electron Microscopy (SEM). In Fig.3, we present micrography of samples (a) CRFO100, (b) PFN10, Fig. 3 SEM micrographs of the
(c) PFN50, (d) PFN90, and (e) PFN100. For CRFO100 sample, one can notice a large variety of morphologies like aggregates and polygonal shapes. For the PFN50 sample, polygonal shapes for the grains are observed. We observe diversity in the grain size distribution, with long cylindrical grains, for example. In the case of the PFN100, microscopy showed larger grain sizes with polygonal shapes.
57
Fe Mo¨ssbauer spectroscopy
Room temperature Mo¨ssbauer spectra for the CRFO100 sample show one well resolved sextet from the iron atoms in the octahedral coordination (Fig.4), and one well resolved doublet from iron in tetragonal coordination for PFN100 sample. The prepared composites contain both contributions: one sextet and one doublet. It shows
that the distribution of particles size is not uniform. Besides, the relative spectral areas of these sextets and doublets were found to be satisfactorily fitted, being proportional to the amounts of the Fe ion-probe in these compounds. This could support the hypothesis that a meaningful solid state reaction could not have occurred between CRFO100 and PFN100 phases, during the synthesis treatment.
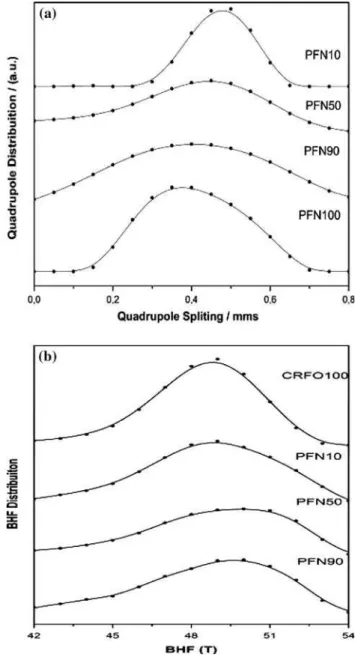
The quadrupolar distribution curves showed in Fig.5a, indicates that the Fe ion-probe in the paramagnetic phase is in the Fe3+ oxidation state and octahedral configuration, over the entire final mixture for all samples. This suggests that the composites preserve the electrical and magnetic properties of both components. The average value of the Fig. 4 Mo¨ssbauer spectra of the composite samples CRFO100;
PFN10; PFN50, PFN90, and PFN100 at room temperature
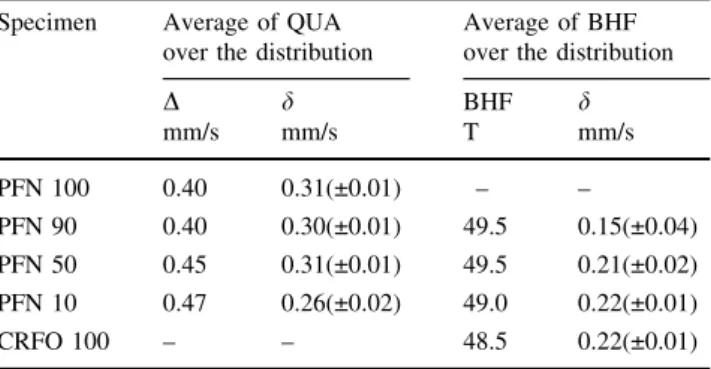
quadrupole distribution presents for PFN100 every broad, with a peak value around D= 0.40 mm/s (see Table5). The study of isomer shift (d) gives information on valence state and chemical bonding of the sample. The isomer shift value isd = 0.31 mm/s which is characteristic of an octa-hedral coordination (see Table5and Fig.5a). For the Fe3+ state, thed is typically in the range 0.20–0.32 mm/s [27]. The hyperfine field (BHF) for the CRFO100 sample (Fig.5b) indicates the most probable value BHF = 48,5 T, and a symmetrical and regular distribution over the 45–53 T interval. For the others samples (in Fig.5b) we observe the same shape, with the most probable value BHF = 49.5 T, over the ±4 T interval. This suggests that the magnetic order is similar for these samples, and that the phases have preserved their magnetic properties, after the synthesis treatment described previously. We have attrib-uted the 49–48 T decreasing in the most probable value, to a larger distance between the magnetic domains for the mixture.
The areas of the fitted curves relative to magnetic phases (see Table6) are showing that the experimental and nominal values are very close.
Conclusions
In this article we did a study of the structural charac-teristics of the composites [Pb(Fe0.5Nb0.5)O3z(PFN)]z
-[Cr0.75Fe1.25O3(CRFO)]100–x. The compounds were
pre-pared by the conventional solid-state method and they were studied using X-Ray Diffraction (XRD), Scanning Electron Microscopy (SEM), and57Fe Mo¨ssbauer Spectroscopy.
The PFN phase is a Tetragonal perovskite in the spatial group P4mm (JCPDS file #88-356), but we observed the formation of a pyrochlore phase (lead niobium oxide, Pb2(Nb0.5Fe1.5)O6.5). The CRFO phase belongs to a
trigo-nal structure in the space group R3c (#167).
The refinement analysis of all the composites Z= 10,
50, and 90 were performed and discussed. The Quantitative Phase Analysis (QPA) of the samples, obtained from the refinement procedure, was obtained and we can observe a good agreement for the composition of each composite phase. The existence of pyrochlore phase (Pb2(Nb0.5Fe1.5)
O6.5) is probably responsible for observed variance of the
results.
The SEM analysis shows that for the CRFO100 sample a large variety of morphologies like aggregates and polygonal shape is observed. For the PFN50 sample, polygonal shapes for the grains are observed. We also observe that the grain size distribution is broader with long cylindrical grains. In the case of the PFN100, microscopy showed larger grain sizes with polygonal shapes.
The Mo¨ssbauer spectra show the superposition of a wide sextet and a doublet for the composite samples. For the CRFO100, the experimental spectrum has a magnetic sextet and for PFN100 a doublet. The Mo¨ssbauer spectra for the individual spectra is proportional to the amounts of the Fe ion-probe in these compounds.
Acknowledgements This work was partly sponsored by CAPES, FUNCAP and CNPq (Brazilian agencies) and the US Air Force Office of Scientific Research (AFOSR) (FA9550-06-1-0543).
References
1. Su WF, Lin SC (2003) J Eur ceram Soc 23:2593
2. Nenasheva EA, Kartenko NF (2001) J Eur ceram Soc 21:2697 3. Jansen M, Scho¨n JC (2004) Nat Mater 3:838
4. Bid S, Pradhan SK (2004) Mater Chem Phys 84:291 5. Anata S, Thomas NW (1999) J Eur Ceram Soc 19:1873 6. Herbert JM (1995) Ceramic Dieletric and Capacitors,
Eletro-component Science Monographs, vol 6. Gordon and Breach, NY 7. Rocha HHB, Freire FNA, Silva RR, Gouveia DX, de Paiva JAC, Sasaki JM, Santos MRP, Go´es JC, Sombra ASB, Structural Studies of the magneto-dieletric composite: Cr0.75Fe1.25O3 (CRFO)-Fe0.5Cu0.75Ti0.75O3(FCTO) submitted
8. Grygar T, Bezdic P, Dedecek JD, Pretovsky´ E, Schneeweiss O (2003) Ceramic-Silika´ty 47(1):32
9. Onari S, Arai T, Kudo K (1977) Physic Rev B 16(4):1717 10. Grygar T, Bezdicka P, Gaspary EG (1999) J Eletrochem Soc
146:3234
11. Steinwehr HHV (1967) Kristalogr 125:377
12. Swartz SL, Shrout TR (1982) Mater Res Bull 17:1245
13. Shrout TR, Swartz SL, Haum MJ (1984) Am Ceram Soc Bull 63(6):808
Table 5 Mo¨ssbauer parameters
Specimen Average of QUA over the distribution
Average of BHF over the distribution
D d BHF d
mm/s mm/s T mm/s
PFN 100 0.40 0.31(±0.01) – –
PFN 90 0.40 0.30(±0.01) 49.5 0.15(±0.04) PFN 50 0.45 0.31(±0.01) 49.5 0.21(±0.02) PFN 10 0.47 0.26(±0.02) 49.0 0.22(±0.01)
CRFO 100 – – 48.5 0.22(±0.01)
Table 6 Areas of the fitted curves relative to magnetic phases
Sample Nominal Experimental
(Mo¨ssbauer) % Magnetic phase (CRFO100) Paramagnetic phase (PFN100) Magnetic phase (CRFO100) Paramagnetic phase (PFN100)
PFN90 92.5% 7.5% 92.4% 7.7%
PFN50 83.2% 16.8% 83.5% 16.5%
14. Lejeune M, Boilot JP (1982) Ceram Int 8(3):99
15. Mohan D, Prasad R, Bannerjee S (1996) J Mater Sci Lett 15:2149 16. Kagata H, Kato J, Nishimoto K, Inoue T (1993) Jpn J Appl Phys
32:4332
17. Kucheiko S, Choi J-W, Kim H-J, Yoon S-J, Jung H-J (1997) J Am Ceram Soc 80(11):2937
18. Zhao H, Zhou J, Bai Y, Gui Z, Li L (2004) J Magn Magn Mater 208:280
19. Pardavi-Horvarth M (2000) J Magn Magn Mater 215–216:174 20. The New Standard of X-ray Diffractometer. MultiFlex (2000)
The Rigaku J 17(2):10
21. Rietveld HM (1967) Acta crystallogr 2:65 22. Rietveld HM (1969) J Appl Crystallogr 2:65
23. Young RA (1996) The Rietveld Method. Oxford University Press/IUCr, Oxford, pp 1–38
24. Young RA, Sakthivel A, Moss TS, Paiva-Santos CO (1995) J Appl Cryst 28:366