Efects of the zinc and zinc-nickel alloys electroplating
on the corrodibility of reinforced concrete rebars
Efeito da eletrodeposição de zinco e da liga zinco-níquel
na corrosibilidade das armaduras de concreto armado
a Universidade Federal da Bahia, Departamento de Ciência e Tecnologia dos Materiais, Escola Politécnica, Salvador, BA, Brasil.
Received: 23 Set 2015 • Accepted: 10 Mar 2016 • Available Online: 12 Jul 2016
F. A. CEDRIM a
[email protected] V. L. S. ALMEIDA a [email protected] C. A. C. SOUZA a [email protected] M. D. JESUS a [email protected] D. V. RIBEIRO a [email protected]
Abstract
Resumo
This paper shows the analysis performed on the corrosion parameters of three groups of reinforcing steel bars, two of these coated by electroplat-ing process with Zinc (Zn) and Zinc-Nickel (Zn-Ni), and the other without any coatelectroplat-ing. It was used reinforced concrete specimens, which ones
were grouped and then subjected to two diferent corrosion accelerating methods: aging wetting/drying cycles and salt spray exposure. Corrosion
potential was measured to qualitative monitoring of the process and, after the end of the tests, corrosion rate was estimated by measuring the mass loss, to quantitative analyses. As it was expected, coated bars presented a better performance than the average bars regarding the corrosion resistance in chloride ions containing environments. It was also observed that the drying/ NaCl solution wetting cycles seems to be more severe than salt spray fog apparatus with respect to the acceleration of corrosion process.
Keywords: electroplating, zinc, reinforced concrete, corrosion.
O presente trabalho avaliou os parâmetros de corrosão das barras de aço revestidas com Zinco (Zn) e com a liga Zinco-Níquel (Zn-Ni), por ele-trodeposição, comparando-as com as tradicionalmente utilizadas, sem revestimento. Para isso, utilizaram-se amostras de concreto armado que foram submetidas a ensaios acelerados de corrosão por ação de cloretos (câmara de névoa salina – “salt spray” e ciclos de imersão e secagem).
O potencial de corrosão das armaduras foi medido para monitoramento qualitativo do processo e, após o im dos ensaios, estimaram-se as taxas
de corrosão das barras, através da perda de massa, para análise quantitativa. As barras revestidas com Zn e Zn-Ni se mostraram mais resisten-tes à corrosão, quando comparadas com as barras convencionais, em ambienresisten-tes com forte ação de cloretos e o envelhecimento por ciclos se
mostrou muito mais eiciente na aceleração do processo de corrosão.
1. Introduction
Corrosive processes in reinforced concrete structures put at risk the integrity of their users and have become usual in Brazil, main-ly in coastal constructions since most of Brazil’s population lives along the coast [1]. It is estimated that around 5% of a nation’s GDP (Gross Domestic Product) are spent solving corrosion
relat-ed problems. In Brazil speciically, this costs excerelat-eds 10 billion of
reais per year [2].
Frequently, the durability of the reinforced concrete structures is overlooked, but this matter is extremely important and should be paid more attention. Yeomans [3] says that good practices, such as the correct positioning of the reinforcing bars in the moulds and the assuring of a right pouring, compaction and curing of the concrete structures would be enough to ease the corrosion problems.
How-ever, due to the perceivable deiciencies in Brazilian construction
processes, it is still frequent the appeal for techniques that improve the concrete/reinforcement bars interface.
Among the most used techniques, the application of galvanic coat-ings with metals more noble than steel in the reinforcing bars has a special place. The zinc (Zn) is the metal more frequently used in these coatings [3], mainly because of its ability to create a dense and
adherent protective ilm on the bar surface, causing the corrosion
rates to become lower than the ones observed in ferrous materials. It is also common to add other components to the Zinc coating, such as cobalt (Co), iron (Fe) and nickel (Ni), forming the alloys Zn-Co, Zn-Fe and Zn-Ni, which present better properties when com-pared to the pure Zinc coatings. In this context, the compounds based in Zn-Ni are drawing more interest regarding the protection against corrosion due to the presenting of superior chemical and mechanical properties [4].
There are two main methods to make the Zinc protective layer:
hot dip galvanizing and electroplating. In the irst one, the steel
bar is immersed in molten Zinc, while in the second one ions of a more noble metal are deposited on the substrate due to the application of an electric current. This last method is a quite com-mon process in the industry, producing a layer that is extremely thin and relatively free of pores, avoiding material waste [5-7].
The thickness of the coating is inluenced by some factors, for
instance the current density, the salt concentration, the bath tem-perature, the presence of additives and the nature of the base metal [8]. Furthermore, the electroplating method does not gener-ate intermetallic alloys like the hot dip galvanizing method,
pro-viding a more homogenous and thin coating that will not afect
mechanic properties of its substrate [9].
There are various techniques to evaluate and assess the corro-sion, and among the most used ones we have the electrochemical
techniques, which can be used both in ield and inside a laboratory. More speciically, the assessment of the potential of corrosion is
one of the electrochemical techniques that allows us to record the changes in the electrochemical process of corrosion (due to the considerable variation in the potential), what ends up being a very interesting way to monitor reinforced concrete structures. Howev-er, the values measured by this method indicate only the balance
between the anodic and cathodic reactions, not ofering any infor -mation regarding the real velocity of the bars corrosion [10]. Nevertheless, the assessment of the corrosion potential enables the mapping of the regions of the reinforced concrete structure where the corrosion process has begun. Due to this, its applica-tion is becoming more and more frequent [4]. Based on reference values provided by the United States standard ASTM C-876/91 (“Standard Test Method for Half-Cell Potentials of Uncoated Re-inforcing Steel in Concrete”), it is possible to have an idea of the corrosion process situation.
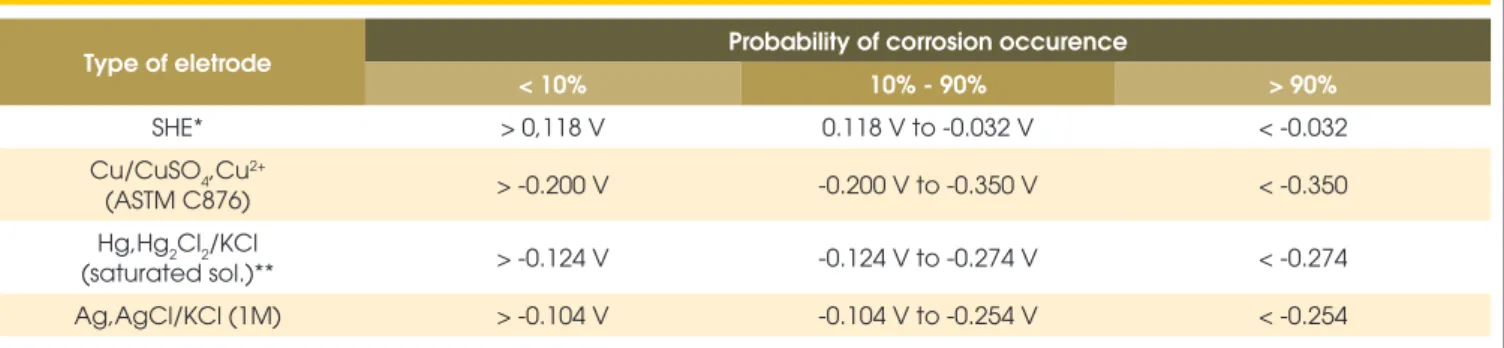
The mentioned standard informs the potential reference ranges re-garding the type of electrodes used to gather the values. According to the table 1, for the calomel electrode, which was used in this re-search, it is given the range of values where there is a probability of less than 10% of occurrence of corrosion, thus indicating a passive state (Ecorr > -0.124 V), an unsureness of corrosion state (-0.124 > Ecorr > -0.247 V), and a probability higher than 90% of corrosion occurrence (Ecorr < -0.247 V).
It is important to remember that the standard provides guidelines for the analysis of reinforcing bars made of steel only, without any type of coating. Since the interpretation of the results from the
electrochemical procedures will be inluenced by the change in the
potentials of Zinc, Zinc-Nickel and steel, it is fundamental to know how to interpret these Zinc and Zn-Ni values, because the stan-dard corrosion and passivation ranges do not suit them [4]. As it was observed before by Sherine et al. [11] and Panek et al.[12], when steel is electroplated with Zinc, its potential of corro-sion regarding the saturated calomel electrode gets lower values to indicate high probability of corrosion, that is below -1.043 V, and passivation state, which is above -0.650 V. Still according to Panek et al. [12], the potential of corrosion that indicates high probability of corrosion of the steel electroplated with a Zinc-Nickel alloy is
Table 1 – Probability of corrosion of the steel bars according to its potential for each electrode
Type of eletrode Probability of corrosion occurence
< 10% 10% - 90% > 90%
SHE* > 0,118 V 0.118 V to -0.032 V < -0.032
Cu/CuSO4,Cu2+
(ASTM C876) > -0.200 V -0.200 V to -0.350 V < -0.350
Hg,Hg2Cl2/KCl
(saturated sol.)** > -0.124 V -0.124 V to -0.274 V < -0.274
Ag,AgCl/KCl (1M) > -0.104 V -0.104 V to -0.254 V < -0.254
below -0.953 V, and its passivation potential would be -0.550 V. These values were adopted as parameters to interpret the read-ings of corrosion potential found in the bars galvanized with Zinc and Zinc-Nickel alloy, respectively, as it can be seen in the table 2.
This research aims to study the inluence of the Zinc and
Zinc-Nickel electroplating galvanization in the corrosibility of the rein-forcing bars embedded in the concrete. In order to make this slow process possible to be fully studied in a short time scale, the rein-forced concrete specimens were subjected to accelerated corro-sion test, being monitored by the electrochemical technique of the potential of corrosion and in the end they had the rate of corrosion of theirs reinforcing bars estimated by the loss of mass measured in each bar.
2. Materials and methods
2.1 Materials
In this research, it was used the Portland cement CP II Z-32, brand Poty. The crushed stone used is of basaltic origin, while the sand is commercialized in the metropolitan region of Salvador-BA. The steel bars used belong to the CA 50-A class (Brazilian Standard) and have a 6.3mm diameter.
2.2 Methods
2.2.1 Characterization of the raw materials and concrete dosage
The Portland cement characterization covered parameters such
as speciic surface area (SSA), which was estimated by BET using
a Micrometrics Gemini 2370 V1.02), density, using a Helium
Pyc-nometer Accupyc 1330 V2.01 from Micrometrics), and the particle-size distribution (PSD), using a laser sedigraph Masterparticle-sizer 2000. The sand and the crushed stone had their granulometry obtained fol-lowing the Brazilian standard NBR NM 248:2003, and so it was to
their ineness module and Maximum aggregate size as well. The sand
density was determined by following the Brazilian standard NBR NM 52:2009, while the crushed stone density followed instructions of the NBR NM 53:2009. The density of the cement used the Le Chatelier’s bottle method, according to the NBR NM 23:2001.
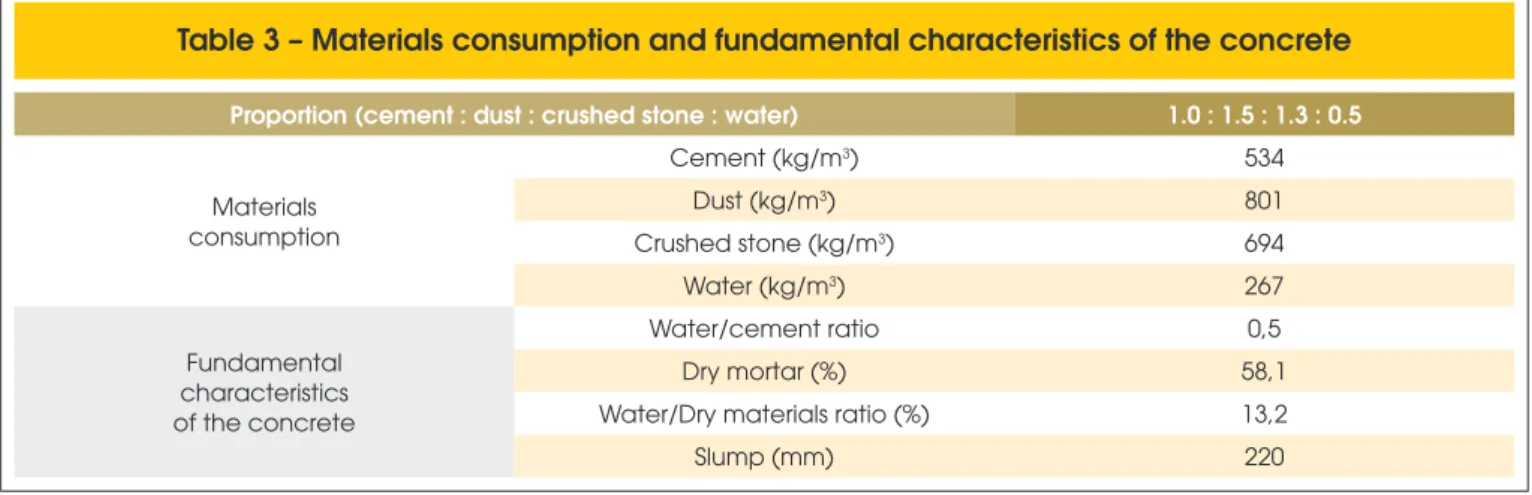
The concrete mixing ratio adopted in this research was 1.0:1.5:1.3:0.5 (cement, sand, crushed stone, water), based in RIBEIRO et al. [14] studies, that used the dosage method pro-posed by ACI (American Concrete Institute). The mortar content was of 70% and the cement consumption was of 534 kg/m3. After mixing, a vibrating table was used to ensure eicient compaction. Then, the concrete specimens with diferent types of embedded
bars (conventional and with Zinc and Zinc-Nickel coatings) were manufactured and subjected to the tests. The fundamental charac-teristics of the concrete, as well as their materials consumption per cubic meter are shown in Table 3.
For the potential of corrosion measurements, it was made prismatic specimens (50x70x90 mm3) in which were embedded the bars with the diameter of 6.3mm. These bars were ixed in the mould waiting
for the concrete to be poured. All specimens rested for 24 hours
and then were taken of the moulds to go to the curing process for
28 days. A minimum of four specimens were tested for each type of electrodeposited coatings, as well as reference specimens.
2.2.2 Concrete characterization
The concrete used for the preparation of the samples was
Table 2 – Potential of corrosion zones indicating the high probabilities of corrosion or passivation
according with the surface condition (using as reference the SCE)
Surface condition Potential that indicates passivation (V) Potential that indicates corrosion (V)
Conventional steel bar > -0.124 < -0.274
Electroplated with Zn > -0.650 < -1.043
Electroplated with Zn-Ni (5%) > -0.550 < -0.953
Table 3 – Materials consumption and fundamental characteristics of the concrete
Proportion (cement : dust : crushed stone : water) 1.0 : 1.5 : 1.3 : 0.5
Materials consumption
Cement (kg/m3) 534
Dust (kg/m3) 801
Crushed stone (kg/m3) 694
Water (kg/m3) 267
Fundamental characteristics of the concrete
Water/cement ratio 0,5
Dry mortar (%) 58,1
Water/Dry materials ratio (%) 13,2
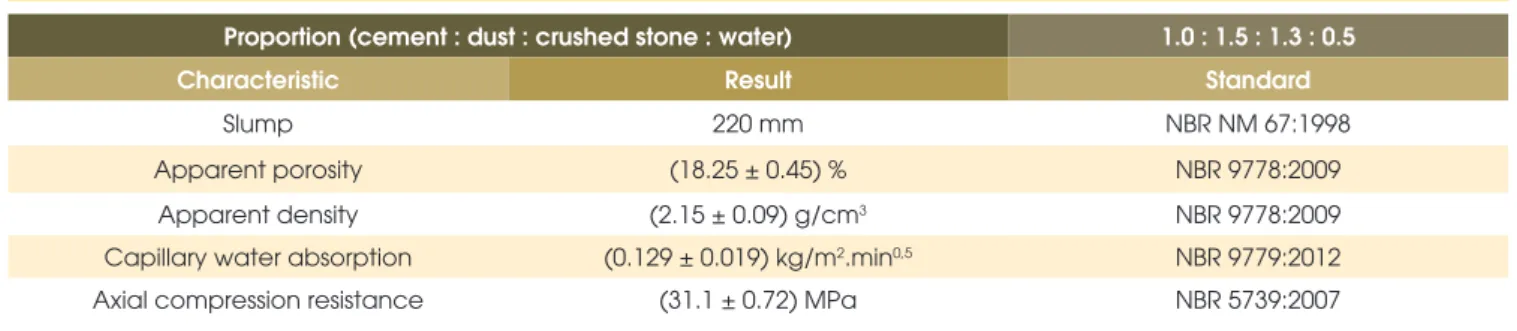
characterized as to its fundamental properties: workability (slump test), apparent porosity and density, capillary water absorption and resistance to axial compression.
The workability of the concrete was evaluated by the slump test method, according to Brazilian NBR NM 67: 1998 standard ABNT
NBR. The apparent porosity and density were veriied using the
technique based on the Archimedes principle. The samples were weighed while they were still dry (Ms). They were then left im-mersed in water for 24 h until they became fully saturated, after which the immersed mass (Mi) and the wet mass (Mu) were deter-mined. Thus, the apparent porosity (PA) and the apparent density (DA) were calculated according to equations (1) and (2)
(1)
Mi
Mu
Ms
Mu
P
A-=
100
.
%
(2)
Mi
Mu
Ms
D
A=
r
L.
-The ρL is the liquid density (in this case, the water, ρL = 1.0 g/cm 3 at 25ºC). The specimens used in the test, in a number total of ive,
all had 28 days of age.
Checking the water absorption by capillary of the mortar is very important because excessive absorption of water is an indicator
of a greater difusion of elements and solutions to the interior of
the material which, consequently, increases the chances of occur-rence of rebar corrosion.
The specimens used in the test, in a number total of 3, all had 28 days of age. The procedure was carried out according to the
NBR 9779 standard. The capillary absorption coeicient is thus es -timated, which represents the weight of water absorbed by square meter of mortar in contact with water according to the square root of time to reach this level of absorption. Numerically, this value corresponds to the slope of the plot straight from the “absorption (kg.m–2) x square root of time (minutes0.5)” graph until it reached the
point of saturation, according to equation 3.
(3)
t
S
A
=
.
Table 4 – Composition of the electrolyte
solution used for zinc electroplating
Zinc solution (g/L)
Potassium choride 208.0
Zinc chloride 19.6
Boric acid 20.0
Table 5 – Composition of the electrolyte solution
used for zinc-nickel alloy electroplating
Zinc-10% Nickel Solution (g/L)
Nickel chloride 34.5
Ammonium chloride 150.0
Zinc chloride 38.5
Boric acid 20.0
+
-MULTIMETER
POWER
SUPPLY
+
CARBON ELECTRODEZINC-NICKEL / ZINC SOLUTION
-BAR
The values of axial compression correspond to the average of three values obtained 28 days after molding, and were obtained with an Contenco HD-120T testing machine and a load of 1.5 mm/ min. The specimens that presented an error of more than 5% were excluded and replaced by others, following the procedure estab-lished by the Brazilian NBR 5739:2007 standard.
2.2.3 Zinc and zinc nickel electroplating
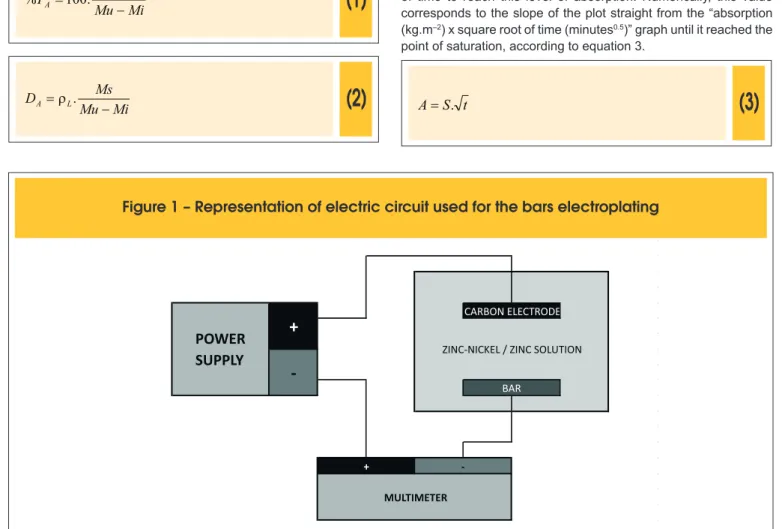
The galvanization process chosen in this research was the electro-plating one. It was assembled an electric circuit for the Zinc or Zinc Nickel electrolytes of the electrolyte solution to be deposited on the steel bar due to an electric current applied. The compositions of these two solutions, proposed by PEDROZA [18] studies, are presented in the tables 4 and 5.
Before the electroplating process, the bars were cleaned with an iron brush and then bathed with distilled water and ethylic alcohol in order to remove any speck that would stick onto its surface,
as-suring the eiciency of the deposition.
Besides the bars to be coated, the assembled circuit comprises a power supply and a carbon electrode, which was also immersed into the electrolyte solution to close the circuit. A multimeter was a component of the circuit as well so the current could be double
checked. The circuit can be seen in igure 1.
Unlike the hot dip galvanizing process, which deposits thicker lay-ers, above 80 µm [4, 19] and in accordance with ASTM A767-09:05 standard (Standard Speciication for Zinc-Coated (Galvanized)
Steel Bars for Concrete Reinforcement), a typical coating of zinc
obtained by electrodeposition does not exceed 20 micrometers. In
this study, a cover thickness of 5μm was used, in order to obtain comparative results and verify the efectiveness of coatings , even
with layers of small thickness .
Aiming to achieve a 5µm thickness coating, it was calculated the current value of 314.6 mA. The duration of the immersion was also calculated to be 9 and 8 minutes for the Zinc and Zinc-Nickel coat-ings respectively.
According to the microphotographs showed in Figure 2, the obtained coatings presented an uniform distribution of the
A
C
B
D
Figure 2 – Microphotographs of the bars surface after the Zinc (A and B)
electrodeposited ions, creating a homogeneous layer in each case,
but with diferent morphologies for each case. While the Zinc coat
-ing exhibited a surface formed by lat grains randomly scattered
and of various sizes, the Zinc-Nickel coating presented spherical same sized grains distributed all over the surface, as it was previ-ously observed in other researches [6,13].
2.2.4 Potential of corrosion measurement
The steel bars were weighted by an analytic scale with 0.01g of accuracy. Then, it was used a tape to mark the area that would be exposed to the attack of the aggressive agent (around 15.8 cm3), as it can be seen in Figures 3a and 3b. These bars were ixed in a
way that these areas would be at the centre of the concrete speci-mens, as showed in the Figure 3d.
The veriication of the corrosion potential happens along the test
of accelerated chloride induced corrosion. The electrochemical cell used in these tests was formed by two electrodes, one of them be-ing the steel bar embedded in the concrete specimen (coated or not) and the other one was the saturated calomel electrode, to be used as reference.
Before performing the measurements, the specimens had their reading side wetted by placing a wet sponge on it during 1 minute. This wet sponge was soaked with an electric conducting solution, which was made according to the United States standard ASTM C-876/91 (“Standard Test Method for Half-Cell Potentials of Un-coated Reinforcing Steel in Concrete”), having 5ml of a neutral
de-tergent for 1 litre of water and presenting a conductivity of 0.15 ± 0.02 mS/cm. Finally, the readings demand the SCE to be placed touching the sponge at the middle of the specimen side, as it is
shown in the igure 4.
The corrosion tests started after 63 days curing, when the speci-mens presented weight constant (which means that they all had a weight variation of less than 1.0g in 24 hours) and when the poten-tial of corrosion pointed to the formation of a passive layer on the surface of the steel bars (Ecorr > -0.124 V, for the conventional bars; Ecorr > -0.650 V, for zinc coated bars; and Ecorr > -0.550 V, for zinc-nickel coated bars). These values indicate that there is a probabil-ity of less than 10% for the corrosion to occur using the SCE and are based on the US standard ASTM C 876/91. They also indicate
the formation of this oxide passive ilm.
In other researches [14-16], it was considered necessary to deine a speciic age when to start the accelerated corrosion tests. These authors related this speciic age to the stabilization of the concrete hydration process, deining 63 days [14, 16] and 80 days [15] as
the amount of time needed for the concrete micro structure to pres-ent a good developmpres-ent and a satisfactory hydration level. After reaching the potential that indicates passivation, the speci-mens were divided in two groups and each one was subjected to an accelerated corrosion process: i) aging cycles of half-immersion and drying, ii) Salt spray exposure.
In the first process, the specimens were half immersed in a solu-tion containing 3% of sodium chloride (NaCl) for 2 days and then are moved to a laboratory oven at 50°C for 5 days. During the first
A
C
B
D
half-cycle, the solution level is kept at the middle of the bar exposed area inside de concrete specimen. In this condition, the chloride penetration happens firstly due to the capillary absorption, since the concrete samples are initially dry, and then due to diffusion when the pores are completely saturated, being accelerated by the water evaporation that takes place in the non-immersed area of the specimens. According to MC-CARTER apud SANTOS [11], there is a relation between the saturation level and the capillary suction forces in a porous material. Thus when there is a dry and exposed region, these suction forces will be greater, pulling faster the solution into the concrete specimen.
The 3% NaCl concentration was adopted because of its similarity with the sea water concentration. That was checked before starting the half-immersed part of the aging cycles and corrected if neces-sary. Besides, the NaCl solution was changed after 4 cycles. At the end of each part of the cycle, the potential of corrosion (Ecorr) was measured along with the weight of the specimens. The po-tential measurements were to probe what was the condition of the bars regarding its passivation/corrosion state, while the weighting was to verify its saturation level.
Through the analysis of the corrosion potential results, it was ob-served if the bar were in passive or active state of corrosion, using for this the values referred to the SCE. This test was ended when two consecutive cycles would give potential below the one that indicates high probability of corrosion.
For its turn, in the salt spray test the concrete specimens were place inside a salt spray chamber (Equilam SS600e) under conditions sta-blished by the ASTM B-117 (“Standard Practice for Operating Salt Spray (Fog) Apparatus”). As oriented by the standard, the saline so-lutions must have a NaCl concentration of 5%, its pH must stay be-tween 6.5 and 7.2 and the inner temperature to be kept at 35°C. Pe-riodical measurements of the potential of corrosion were performed in order to verify how the corrosion process was.
After the ending of both tests, the bars were extracted from the specimens, cleaned following the orientations of the ASTM G-1/03 and then weighted so the loss of mass could be found by compar-ing with the weight of them before embeddcompar-ing them in the speci-mens. Then, the corrosion rate (CR) was calculated following the equation 4.
D T A
W K CR
. ..
=
Where K = constant (for CR in mm/year, K=8.76 x 10⁷; for CR in g/
m2.year, K = 8.76 x 107.D); W = loss of mass (g); A = exposed area
(cm2); T = duration of exposure (h); D = density (for CA-50 steel, D
= 7.85 g/cm3). In this research, A = 15.83 cm2 e T = Time that the
tests lasted.
3. Results and discussion
3.1 Materials characterization
The Portland cement used in this research presented a speciic
surface area of 0.425 m2/g and its density was of 2.98 Kg/dm3. The sand density was of 2.63 Kg/dm3, and its ineness Modulus 1.52,
being classiied as ine sand. The crushed stone obtained a density of 2,79 Kg/dm3 and its maximum aggregate size was of 9.5 mm and classiied as “stone 0”. The granulometric distributions can be seen at the igure 5.
3.2 Concrete characterization
The concrete used for the preparation of the samples was charac-terized as to its fundamental properties: workability (slump test), apparent porosity and density, capillary water absorption and resis-tance to axial compression. The results are presented in Table 6.
3.3 Corrosion Potential
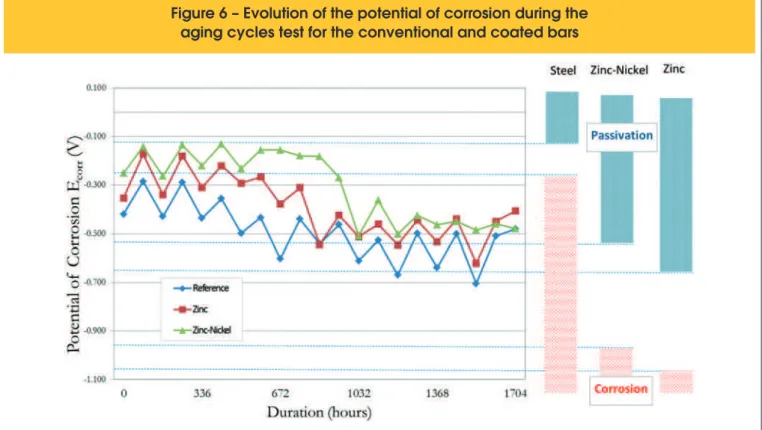
The corrosion potential of the bars subjected to the wetting-drying aging cycle was assessed in the end of each immersion and drying phase and can be seen in the Figure 6.
During the test, the observed potential values behaved as ex-pected and noted in previous related works [14], as the measures
taken in the wetting cycle were much lower than the measures of the drying cycle. This fact is explained by ROCHA [17] that shows that temperature, humidity and saturation level directly interfere in the electrochemical measures of the potential of corrosion, and that interference is boosted by the chloride contamination.
In the salt spray exposure test (SSET), the parameters cited before (temperature, humidity, saturation level) are kept constant, causing
a diferent behaviour in the potential of corrosion readings, as can be seen at the igure 7.
As suggested by GONZÁLEZ et al. [18], the measures of the po-tential are not conclusive by themselves due to the variety of factors
that afect it, giving only preliminary indicatives of the bars corrosion
situation. As it can be seen, the potential of corrosion of the coated bars stayed in the uncertainty range (Ecorr > -1,043 V, for bars coated with Zinc and Ecorr > -0,953 V, for bars coated with Zinc-Nickel), while the bars with no coating presented potentials in the high corrosion probability range (Ecorr < -0,274 V). Such behaviour indicates that
there is a protective efect over the reinforcing bars regarding their
despassivation when they are coated with Zinc or the Zinc-Nickel alloy by electroplating process, what is due the delay in the change from passive to active state of corrosion. However, as the corrosion potential is just a qualitative test, it does not allow the coatings to be
compared regarding their protection eiciency.
3.4 Corrosion rate
The loss of mass observed in the bars after the tests of accelerated corrosion allowed the average corrosion rates to be estimated for
each group of bars (coated with Zinc, Zinc-Nickel and uncoated), as
shown in igures 8 and 9. As expected, in both tests the galvanized
bars presented a lower corrosion rate than the uncoated ones. In the aging cycles test, the uncoated bars shower a corrosion
rate (250,40 μm/year) much higher than the galvanized with Zinc (167,49 µm/year) and Zinc-Nickel (166,15 μm/year). These results
mean a decrease of 33.1% and 33.6% respectively in the corro-sion rates when the average values of each group are compared, causing the galvanized bars to have a better durability. It was also possible to notice that the Zinc-Nickel coating presented the best results regarding the corrosion rate, with the lowest discrepancies, which is in agreement with the more uniform aspect of the Zinc-Nickel distribution on the surface of the steel bar.
It is important to highlight that the adopted thickness (5 μm) of both coatings may have inluenced in the high deviation of the results,
given that usual coating thicknesses are far greater (around 100
μm). It may also have contributed for a poor formation of the zinc
oxides layer that would delay the corrosion process. Besides, it
is possible that some local laws in the coatings would provoke corrosion type diferent from uniform corrosion, which is the one
assumed for the calculation of the corrosion rate.
The results obtained from the salt spray exposure tests (SSET)
(igure 6) showed much less variability, and a smaller order of mag -nitude, what indicates this test to be less aggressive than the
ag-ing cycles test. It was found a corrosion rate of 22.50 μm/year for uncoated bars, 15.58 μm/year for zinc coated bars, and 15.40 μm/
year for zinc-nickel coated bars. One more time it is indicated the increase of the life cycle of coated bars.
A
B
Figure 5 – Particle size distribution and classification limits of the (A) dust (inferior limit)
and (B) crushed stone (4,75-12,5 mm, stone 0), used to concrete production
Characteristic Result Standard
Slump 220 mm NBR NM 67:1998
Apparent porosity (18.25 ± 0.45) % NBR 9778:2009
Apparent density (2.15 ± 0.09) g/cm3 NBR 9778:2009
Capillary water absorption (0.129 ± 0.019) kg/m2.min0,5 NBR 9779:2012
Still, it was possible to compare the eiciency of the accelerated corrosion tests through the analysis of the corrosion rate. While
the uncoated bars presented a rate of 250.40 µm/year in the aging cycles test, in the salt spray chamber process the average rate was of 22.50 µm/year. The same occurs for the coated bars, where
to the irst test was found corrosion rates of 167.49 µm/year (Zinc)
and 166.40 µm/year, while in the salt spray test was found rates of 15.58 µm/year and 15.40 µm/year, respectively. That shows that
the test at which the corrosion is accelerated by the cycles of
wet-ting and drying is more eicient for the evaluation of corrosion in
reinforced concrete specimens.
Such diference may be explained by the scarcity of one of the in -dispensable components for the corrosion process: oxygen. Since the salt spray chamber is airtight sealed and the specimens are saturated most of the time, the oxygen entrance in the specimen
becomes less efective. Therefore, some alterations in the test that
Figure 8 – Corrosion rates for the conventional
and coated bars after the ACT
Figure 9 – Corrosion rates for the conventional
and coated bars after the SSET
would allow more oxygen to come in may cause it to better acceler-ate the corrosion in the reinforced concrete specimens.
4. Conclusions
From the results that were found, it was possible to conclude that: n The galvanization by electroplating is an eicient protective
method for the reinforcing steel bars in the civil construction; n The Zinc and Zinc-Nickel coatings proved themselves to be efec
-tive as to increase the life cycle of reinforcing bars, although the thickness adopted in this research might not have been enough to promote a substantial increasing in the life cycle, since this thick-ness might have interfered in the coatings performance;
n The accelerated corrosion test of wetting and drying cycles
proved to be more efective to evaluate the corrosion process
in the reinforced concrete specimens when compared with the salt spray exposure test (SSET);
n The utilization of more reined monitoring techniques is neces -sary to achieve a better understanding of how works the coat-ings of zinc and zinc-nickel alloy in the reinforced concrete, since the literature about it is rather scarce.
5. Acknowledgements
To the Pró-Reitoria de Ensino e Pós-Graduação (PROPG) and to the Pró-Reitoria de Pesquisa, Criação e Inovação (PROPCI) for the research scholarship. To all group from LEDMA, LAMET and CETA for the support.
6. References
[1] GENTIL, V. Corrosão, Rio de Janeiro: LTC, 5ed, 2007.
[2] CALLISTER, Jr., W.D. Ciência e engenharia de materiais:
Uma introdução, Rio de Janeiro: LTC, 7ed, 2008.
[3] YEOMANS, S. R. (Ed.) Galvanized Steel Reinforcement in Concrete. [Camberra]: Elsevier, 2004. cap. 6.
[4] BROOMFIELD, J. P. Galvanized Steel Reinforcement in Concrete: A Consultant’s Perspective In: YEOMANS, S. R. (Ed.) Galvanized Steel Reinforcement in Concrete. [Cam-berra]: Elsevier, 2004. cap. 9.
[5] GRAVILA, M.; MILLET, J.P.; MAZILLE, H.; MARCHANDISE, D.; CUNTZ, J.M. Corrosion behaviour of zinc-nickel coat-ings, electrodeposited on steel. Surface and Coatings Tech-nology v.123, 1999; p164-172.
[6] GHAZIOF, S.; GAO, W. Electrodeposition of single gamma
phased Zn-Ni alloy coatings from additive-free acidic bath. Applied Surface Science v.311, 2014; p635-642.
[7] WILCOX, G. D.; GABE, D. R. Electrodeposited zinc alloy
coatings, Corrosion Science 35 (5-8) (1993) 1251-1258. [8] PEDROZA, G. A. G. Efeito da Glicerina como aditivo na
Re-sistência à Corrosão de um Depósito da Liga Zn-Ni, obtido
através de Eletrodeposição, Salvador, 2009, Dissertação (mestrado), Escola Politécnica, Universidade Federal da Bahia, 112p.
[9] ZEMPULSKI, L. N.; ZEMPULSKI, M. F. S. Dossiê técnico:
galvanização eletrolítica. Instituto de Tecnologia do Paraná TECPAR, 2007, p.21.
[10] FREIRE, K. R. R. Avaliação do desempenho de inibidores
de corrosão em armaduras de concreto, Curitiba, 2005, Dis-sertação (mestrado), Universidade Federal do Paraná.
[11] SHERINE H. B.; RAJAKUMARI C. C.; RAJENDRAN S. Cor -rosion behaviour of stainless steel 304 electroplated with zinc followed by blue passivation. Portugaliae Electrochi-mica Acta, v.29, n.4, 2011; p.295-305.
[12] PANEK, J.; BIERSKA-PIECH, B.; KAROLUS, M. The corro -sion resistance of zinc-nickel composite coatings, Journal of Achievements in Materials and Manufacturing Engineering
Katowice, v.45, n.2, 2011; p.157-162.
[13] RAMANAUSKAS, R.; QUINTANA, P.; MALDONADO, L.;
[14] RIBEIRO D. V.; LABRINCHA J. A.; MORELLI M. R. Efect
of the addition of red mud on the corrosion parameters of reinforced concrete. Cement and Concrete Research, v. 42, 2012; p.124-133.
[15] SANTOS, L. Avaliação da resistividade elétrica do concreto como parâmetro para a previsão da iniciação da corrosão induzida por cloretos em estruturas de concreto, Brasília, 2006, Dissertação (mestrado), Universidade de Brasília, 161p.
[16] BAUER, E. Avaliação comparativa da inluência da adição
de escória de alto-forno na corrosão das armaduras através de técnicas eletroquímicas, São Paulo, 1995, Tese (douto-rado), Escola Politécnica, Universidade de São Paulo, 236p. [17] ROCHA, F. C. da. Leituras de potencial de corrosão em
es-truturas de concreto armado: inluência da relação água/
cimento, da temperatura, da contaminação por cloretos, da espessura de cobrimento e do teor de umidade do concreto, Curitiba, 2012, Dissertação (mestrado), Universidade Fed-eral da Paraná.
[18] GONZÁLEZ, J. A.; MIRANDA, J. M.; FELIU, S. Consider-ations on reproducibility of potential and corrosion rate mea-surements in reinforced concrete. Corrosion Science, v.46, p.2467-2485, 2004.
![Figure 4 – Measurement of the potential of corrosion being performed [14]](https://thumb-eu.123doks.com/thumbv2/123dok_br/18861184.417958/7.892.456.828.175.810/figure-measurement-potential-corrosion-performed.webp)