*e-mail: [email protected]
Bending Characteristics of Resin Concretes
Maria Cristina Santos Ribeiro, Cassilda Maria Lopes Tavares, Miguel Figueiredo,
António Joaquim Mendes Ferreira*, António Augusto Fernandes
Instituto de Engenharia Mecânica e Gestão Industrial Departamento de Engenharia Mecânica e Gestão Industrial
Faculdade de Engenharia da Universidade do Porto Rua Dr. Roberto Frias, 4200-465 Porto, Portugal
Received: August 28, 2002; Revised: February 16, 2003
In this research work the influence of composition and curing conditions in bending strength of polyester and epoxy concrete is analyzed. Various mixtures of resin and aggregates were con-sidered in view of an optimal combination. The Taguchi methodology was applied in order to reduce the number of tests, and in order to evaluate the influence of various parameters in concrete properties. This methodology is very useful for the planning of experiments. Test results, analyzed by this methodology, shown that the most significant factors affecting bending strength properties of resin concretes are the type of resin, resin content and charge content. An optimal formulation leading to a maximum bending strength was achieved in terms of material parameters.
Keywords:polymer concrete, mechanical characterization, mechanical behaviour
cal and corrosion properties of such concretes allow thin-ner cross-sections and lower cover depths in reinforced con-crete, reducing transport costs and handling risks.
As Portland cement concrete, resin concretes relatively have low tensile strength, when compared to compressive strength (around 100 MPa). Therefore, brittle cracks due to tensile stresses can occur, making it necessary in many cases to use steel or FRP rebars, increasing ultimate load, ductil-ity and toughness3-6.
The main objective of this work is to analyze the influ-ence of mixture and curing cycles in the bending behaviour of polyester and epoxy concretes.
The planning of various mixtures was achieved with a Taguchi methodology. This technique allows an analysis of the effect of several manufacturing factors7-11.
This technique also allows the identifying of interac-tions between factors, reduction of mixture combinainterac-tions through a library of pre-set orthogonal matrices, without loss of relevant information7-11. To perform all possible tests
with all possible mixture combinations would not be prac-tical, neither in time nor cost.
1. Introduction
Polymer concrete is a kind of concrete in which a ther-moset resin binds together natural aggregates, such as silica sand. Catalysts and accelerators are added up to resin be-fore mixing with inorganic aggregates, in order to initiate the polymeric curing.
In this type of concretes, water is completely absent, as it inhibits the curing of concrete1. Therefore, unlike cement
concretes, this is a water-free concrete.
Typical resins used in these concretes are polyester, epoxy and acrylic thermoset resins. Polyesters are the most used, mainly for economic reasons.
Resin concretes have good mechanical properties, such as high compression strength, and high durability in terms of fatigue and corrosion resistance. Its permeability to liq-uids is generally very low, and its curing times are quite fast.
mechani-2. Experimental Procedure
Planning of testing formulationsTo analyze the influence of various parameters in the concrete bending strength, the following material factors are considered:
• Resin type; • Resin content (%);
• Charge content in resin (%); • Sand type;
• Curing cycle.
The variation levels for each considered factor are speci-fied in Table 1.
The number of all combinations between these five fac-tors with two variation levels is 2-raised to five, or either thirty-two possible combinations. However, the proposed Taguchi method allows a reduction in the number of com-binations to test, by the use of pre-set orthogonal array with sixteen lines, which corresponded to the different formula-tions to test.
Using this array, not only the influence of each factor can be evaluated, but also the interactions between itself (it has fifteen degrees of freedom: five corresponding to fac-tors and ten corresponding to its interactions).
The 16 resultant formulations are presented in Table 2.
Materials characterization
A pre-accelerated orthophtalic polyester resin (NESTE-S226E) was used, with 2% (in weight) catalyst. Also
used, was a low viscosity epoxy resin (EPOSIL-551), with a
maximum bending strength of 70 MPa. This resin was mixed with a hardener on a 2/3 resin, 1/3 hardener ratio.
The charge incorporated in this resin was calcium car-bonate. The weight percentages are related to the total weight of resin.
The foundry sand used was a siliceous one, of rather uniform particles size, with an average diameter of 245 µm. Clean sand is a locally available river sand, previously washed and well graded (0.01/1.20 mm). The water con-tent of both sands is controlled to be less than 0.1%, before being mixed with the resin.
The mixture was performed mechanically, to achieve a more homogeneous material. For each formulation, nine specimens were manufactured according to RILEM stand-ards12. The metallic moulds are of standard type.
Experimental set-up
Specimens were tested in three-point bending, after cur-ing. An Instron universal testing machine, with a load cell of 100 kN, was used (Fig. 1). Tests were performed
accord-Table 1. Factors and levels.
Factors
Resin Type Charge content Resin content Sand type Curing cycle
Level 1 Polyester 0% 17% Clean 7 days/23 °C
Level 2 Epoxy 25% 20% Foundry 3 h/80 °C
Table 2. Formulations to be tested.
Concrete # Resin type Charge content (%) Resin content (%) Sand type Curing cycle
1 Polyester 0 17 Clean 7 days/ 23 °C
2 Polyester 0 17 Foundry 3 h/ 80 °C
3 Polyester 0 20 Clean 3 h/ 80 °C
4 Polyester 0 20 Foundry 7 days/ 23 °C
5 Polyester 25 17 Clean 3 h/ 80 °C
6 Polyester 25 17 Foundry 7 days/ 23 °C
7 Polyester 25 20 Clean 7 days/ 23 °C
8 Polyester 25 20 Foundry 3 h/ 80 °C
9 Epoxy 0 17 Clean 3 h/ 80 °C
10 Epoxy 0 17 Foundry 7 days/ 23 °C
11 Epoxy 0 20 Clean 7 days/ 23 °C
12 Epoxy 0 20 Foundry 3 h/ 80 °C
13 Epoxy 25 17 Clean 7 days/ 23 °C
14 Epoxy 25 17 Foundry 3 h/ 80 °C
15 Epoxy 25 20 Clean 3 h/ 80 °C
ing to RILEM standards13, at a rate of 1 mm/min.
Load-displacement curves and maximum load corresponding to the collapse bending moment, were recorded.
Testing set-up and sample geometry is defined in Fig. 2.
3. Experimental Results
Bending tests
Table 3 presents the average failure load and failure stress for each formulation. In Fig. 3, is presented the typical load-displacement curves obtained in the bending tests of con-crete specimens. These particular curves are referring to concrete formulation nº 4.
The load-displacement curves for each formulation are quite similar, and the maximum load values are also very close, which is a good indication of material behaviour pre-diction.
Variance analysis by the Taguchi method
In the application of the Taguchi method, the variance analysis - ANOVA - was used, in order to analyze data ob-tained by the chosen orthogonal matrix. ANOVA allows the testing of the significance of the effects relatively to the random error7-11. The analysis was performed for a
signifi-cance level of 5%, or for a confidence level of 95%. The variance analysis results, for bending strength response, are shown in Table 4.
The last column of Table 4 represents the contributions of each factor (or interaction) to the global variance. These contributions are function of the numeric values of the ef-fects and they indicate the level of influence in the global response, which is the bending resistance.
The numeric value of an effect (EA), or principal effect, is not more than the difference between the average values obtained on the two levels adopted for that factor. In the calculation of each these averages, all response values where
Figure 3. Load-displacement curves (formulation nº 4).
Table 3. Average failure loads and stresses.
Concrete Average failure Average failure nº load (kN) stress (MPa)
Polyester
1 10.04 23.5
2 8.76 20.5
3 10.19 23.9
4 14.02 32.8
5 7.05 16.5
6 2.15 5.0
7 11.25 24.4
8 8.32 19.5
Epoxy
9 12.79 30.0
10 15.30 35.9
11 12.73 29.8
12 16.52 38.7
13 12.82 30.0
14 12.45 29.2
15 14.77 34.6
16 14.91 34.9
Figure 1. Bending test of resin concrete.
that factor interacts with the level in question are consid-ered.
EA = A1 – A2 (1)
where Ai represents the average value corresponding to all responses involving factor A with level “i”.
The determination of the interaction effect value between two factors (IE(A*B)) is not so straightforward and it involves the calculus of four different average values:
IE(A*B) = ( A1B1 - A1B2 ) – ( A2B1 - A2B1 ) (2)
where AiBj represents the average value corresponding to responses involving factor A with level “i” and factor B with level “j”.
Response graphics
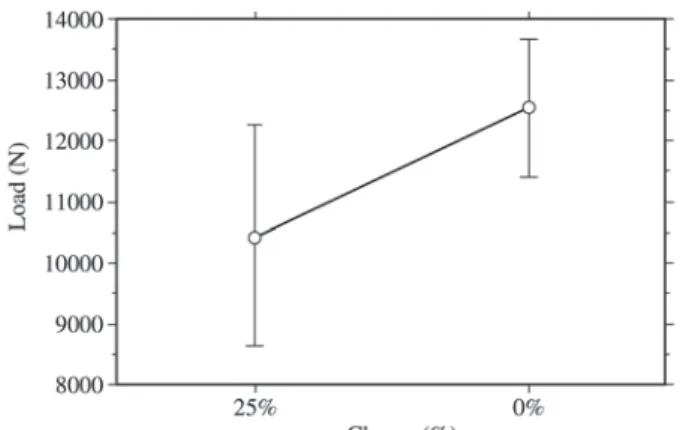
Response graphics allow the evaluation of the relative importance of each factor, or interaction, in a much easier way than the numeric values of effects.
For principal effects, the interpretation of graphics is straightforward. Figures 4 to 8 present the response graph-ics of the principal effects, with 95% confidence error bars. Each graphic point represents the average response for the factor, at a certain level. The numeric value of the effect is precisely the difference between the two points: the higher the difference, the higher the influence of the factor.
To analyze the response graphics of interaction effects, principal effects of factors must be ignored and attention must be focused in its interaction.
The interaction is graphically defined by the parallel-ism between two straight lines: the smaller the parallelparallel-ism, the bigger the interaction. The interaction effects response graphics are represented in Figs 9-18, with 95% confidence error bars.
4. Discussion of Results
Variance analysis results
From Table 4, it can be concluded that resin type is the most influencing factor, followed by resin content and charge content. The interaction between the latter and sand type also presents a significant contribution to global response.
• Resin type 49.66%
• Resin content 13.69%
• Charge content 8.33%
• Interaction Charge content * Sand type 8.43% The remaining factors and interactions have a very small influence in the total variation. In particular, sand type and curing conditions factors, and its interactions, have been rejected for a significance level of 5%.
Principal effects analysis
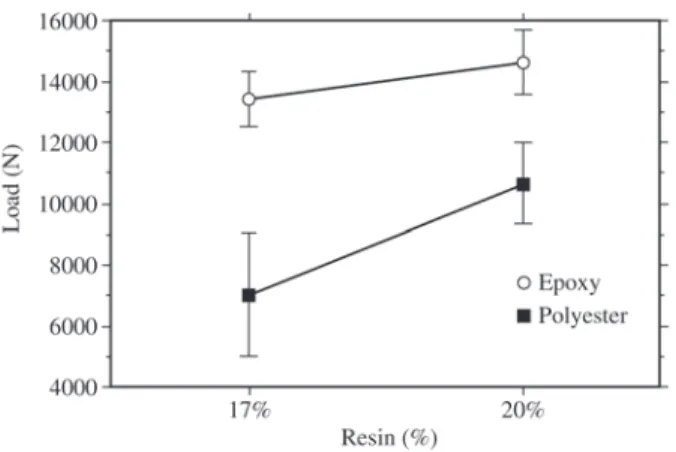
From the analysis of the response graphics it is evident that the use of epoxy resin strongly increases bending strength, when compared to polyester resin.
For epoxy resin values are not only higher, but also more reliable, due to more uniform results (Fig. 4).
Responses are also increased, at a lower level, with the use of 20% resin content, as expected and with 0% charge
Table 4. ANOVA variance analysis.
Factors and interactions DF Sum of Squares F-values Significance level Contribution %
Resin 1 308848754.324 919.133 0.0001 49.66
% de Charge 1 52092015.415 155.026 0.0001 8.33
% Resin 1 85382646.521 254.098 0.0001 13.69
Sand type 1 314706.548 0.937 0.3404 0.00
Post-cure 1 1186241.505 3.530 0.0694 0.14
Resin * % of Charge 1 27367979.979 81.447 0.0001 4.35
Resin * % Resin 1 20147315.134 59.958 0.0001 3.19
Resin * Sand type 1 24047207.405 71.564 0.0001 3.82
Resin * Curing temperature 1 2954330.259 8.792 0.0057 0.42
% of Charge * % Resin 1 12723477.521 37.865 0.0001 1.99
% of Charge * Sand type 1 52713912.209 156.876 0.0001 8.43
% of Charge * Curing temperature 1 5173855.167 15.397 0.0004 0.78
% Resin * Sand type 1 13817761.187 41.122 0.0001 2.17
% Resin * Curing temperature 1 2805697.222 8.350 0.0069 0.40
Sand type * Curing temperature 1 920905.128 2.741 0.1076 0.09
Residual 32 10752703.103 2.54
Figure 7. Effect of “Sand type”.
Figure 6. Effect of “Charge content”.
Figure 5. Effect of “Resin content”.
Figure 4. Effect of “Resin type”.
content (Fig. 5 and 6).
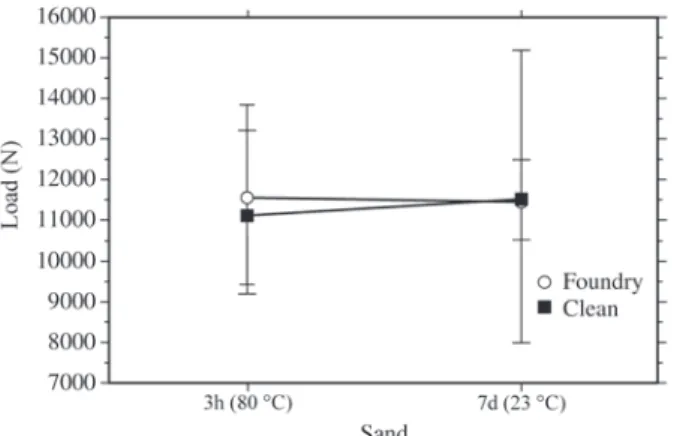
Sand type and curing treatment, when isolated, have al-most no influence in concrete bending strength, as one can observe from the small slope in corresponding graphics (Fig. 7 and 8).
Interactions effects analysis
Analyzing the interaction effects, according to Fig. 9-18, the following conclusions can be drawn by interaction, in descending order of importance:
• Interaction between Charge content and Sand type: (8.43%)
Foundry sand concretes are very sensitive to the incor-poration of charge in resin formulation. The best mechani-cal results are obtained for 0% charge content. Clean sand concretes are less sensitive, and can be considered as insen-sitive to variation of charge content (the two average points are coincident) (Fig. 9).
This difference in behaviour is explained by each sand particle’s size distribution. Foundry sand, with very fine
grain size, has a large specific surface and it reacts poorly to the incorporation of more fine particles. Clean sand, with a smaller specific surface, requires less binder, and there-fore, the concretes made with this kind of sand and with
Figure 14. Effect of interaction “Charge content * Resin content”.
Figure 11. Effect of interaction “Resin type * Sand type”.
Figure 9. Effect of interaction “Charge content * Sand type”.
Figure 10. Effect of interaction “Resin type * Charge content”.
Figure 12. Effect of interaction “Resin type * Resin content”.
charge, balance the lower effective resin content with a bet-ter filling of holes through the incorporation of calcium car-bonate.
• Interaction between Resin type and Charge content: (4.35%)
The incorporation of charge in polyester concretes has a rather negative influence in global response. This effect is not so pronounced in epoxy resins. An average reduction of 4% in bending strength for epoxy concrete and a 33% re-duction for polyester concrete (Fig. 10) exists. This phe-nomenon can perhaps be explained by the higher viscosity of polyester resin and the corresponding lower wetting abil-ity, being therefore more susceptible to the incorporation of fine particles.
• Interaction between Resin type and Sand type: (3.82%)
Epoxy resin concretes present better bending behaviour when manufactured with foundry sands. However, polyes-ter concretes present betpolyes-ter mechanical behaviour when
in-Figure 18. Effect of interaction “Sand type * Curing cycle”.
Figure 16. Effect of interaction “Charge content * Curing cycle”.
corporating clean sands (Fig. 11). This can be explained by the higher capacity of epoxy resin to wet aggregates, allow-ing finer sands, while polyester resin, with less wettallow-ing abil-ity, prefers aggregates with lower specific surface.
• Interaction Resin type and Resin content: (3.14%)
Polyester concretes are more susceptible to resin content than epoxy concretes. An increase of 17% to 20% in resin content increases response in about 56%, for polyester resin against an increase in 10% for epoxy resin (Fig. 12).
• Interaction Resin content and Sand type: (2.17%)
By incorporating higher resin content (20%) better results are obtained when foundry sands are used, while when smaller resin content (17%) is used, better response is obtained with clean sands (Fig. 13). Lower resin contents require sands with lower specific surfaces, so that it may be possible to involve all material. When there is an excess of resin, this resin tends to migrate to the surface, reducing homogeneity.
• Interaction Resin content and Charge content: (1.99%)
Global response values increase much more in samples with 25% charge than in those with 0% charge (Fig. 14). This reaction is due to the fact that charge incorporation corresponds to an increase in specific surface of the totality of particles.
The interaction of factors (resin content), (charge con-tent), (resin type) and (sand type) with factor (curing treat-ment) have no significant influence in the global response values. This can be observed in the almost perfect parallel-ism of the two straight lines in corresponding response graphics (Figs. 15-18).
5. Conclusions
The objective of this research was to analyze the influ-ence of compositions and curing treatment in bending strength of polyester and epoxy concretes towards an opti-mal formulation.
For that purpose, a number of concrete formulations with various curing treatments were manufactured and tested in bending. Load-displacement curves and failure loads were recorded.
Planning of tests and the evaluation of factor effects and its interaction effects was performed with the Taguchi method, in order to reduce the total number of formulations to be tested.
A variance analysis - ANOVA - was used for data analy-sis. The following conclusions can be drawn:
• The most decisive factor for bending strength is the resin type, followed by resin content and charge con-tent.
• Curing cycle does not influence the concrete final characteristics. Seven days cure, at room temperature, is equivalent to three hours cure, at 80 °C.
• The analysis of principal effects and its interactions allowed establishing the most interesting levels for each factor. The optimal combination, corresponding to the most resistant concrete was found. It is com-posed by:
Epoxy resin; 20% Resin content; 0% Charge content; Foundry sand;
This optimal combination was really tested. It corre-sponds to concrete nº 12, which has an average bending strength of 38 MPa. Therefore, there was no need to predict the bending strength of concrete corresponding to the opti-mal formulation by the Taguchi method, or to perform the confirmation test.
Obviously, this combination is not the most economical one, attending to higher cost of epoxy resin and also the resin content involved. The best relation between price and
per-formance was presented by combination nº 4. It is similar to nº 12, but with polyester resin instead of epoxy resin. This formulation is almost five times cheaper, and its bending strength is only 17% smaller than the optimal combination.
A compromise solution must be sought according to specific concrete application specifications.
Based on this research, a new study accounting for an intermediate level for resin content, is sought to be helpful in the choice of that solution.
Acknowledgements
The support of Fundação para a Ciência e Tecnologia, under project POCTI/35955/EME/2000, “Long term prop-erties of polymer concrete” is gratefully acknowledged.
References
1. ACI Committee 548, Guide for the use of polymers in concrete (ACI 548, IR-86), American Concrete Institute, Detroit, 1986.
2. Dikeou, J. Precast polymer concrete in the United States, Proceedings of the Fifth International congress of Poly-mers in Concrete, Brighton, England, 1986.
3. Rebeiz, K.S.; Fowler, D.W. Flexural strength of rein-forced polymer concretemade with recycled waste, ACI Structural Journal, 1993.
4. Rebeiz, K.S.; Shearl, S.P.; Fowler, D.W. Recommended design procedure inshear for steel-reinforced polymer concrete, ACI Structural Journal, 1993.
5. San José, J.T.; Ramirez, J.L. FRP bars in the bending behaviour of the polymer concrete, IRF International Conference, Porto, 1999.
6. San José, J.T.; Ramirez, J.L. Pure bending in polymer reinforced concrete – Design guidelines for polyester concrete, Proceedings of Arquimacom, 98, Bordeaux, France, 1998.
7. Camanho, P.P.; Guedes, R.M.; Ferreira, A.J.M.; Fernandes, A.A. Flexural behaviour of polymer concrete, IRF International Conference, Porto, 1999.
8. Taguchi, G. System of experimental design, Unipub / ASI, 1987.
9. Taguchi, G.; Konishi, S. Taguchi methods, orthogonal arrays and linear graphs, American Supplier Institute, 1987. 10. Figueiredo, M.; Fernandes, A.A. The Taguchi
method-ology in planning and analysis of welding procedures (in portuguese), Ingenium, 2ª serie, n. 11, p. 79-85, 1996. 11. Ross, P. Taguchi techniques for quality engineering func-tion, orthogonal experiences, parameter and tolerance design, McGraw-Hill, 1988.
12. PC-2, Method of making polymer concrete and mortar specimens-RILEM-, Technical Committee TC-113, 1995.