Abstract
Submitted: February 13, 2018 Modification: May 24, 2018 Accepted: June 4, 2018
Stanozolol promotes osteogenic gene
expression and apposition of bone
mineral
in vitro
Stanozolol (ST) is a synthetic androgen with high anabolic potential. Although it is known that androgens play a positive role in bone metabolism, ST action on bone cells has not been sufficiently tested to support its clinical use for bone augmentation procedures. Objective: This study aimed to assess the effects of ST on osteogenic activity and gene expression in SaOS-2 cells. Material and Methods: SaOS-2 deposition of mineralizing matrix in response to increasing doses of ST (0-1000 nM) was evaluated through Alizarin Red S and Calcein Green staining techniques at 6, 12 and 24 days. Gene expression of runt-related transcription factor 2 (RUNX2), vitamin D receptor (VDR), osteopontin (SPP1) and osteonectin (ON) was analyzed by RT-PCR. Results: ST significantly influenced SaOS-2 osteogenic activity: stainings showed the presence of rounded calcified nodules, which increased both in number and in size over time and depending on ST dose. RT-PCR highlighted ST modulation of genes related to osteogenic differentiation. Conclusions: This study provided encouraging results, showing ST promoted the osteogenic commitment of SaOS-2 cells. Further studies are required to validate these data in primary osteoblasts and to investigate ST molecular pathway of action.
Keywords: Osteogenesis. Bone matrix. Calcification. Gene expression. Androgens. Stanozolol.
Giulia GHIACCI1
Simone LUMETTI1
Edoardo MANFREDI1
Daniele MORI2
Guido Maria MACALUSO1,3
Roberto SALA2
1Università degli Studi di Parma, Dipartimento di Medicina e Chirurgia, Centro Universitario di
Odontoiatria, Parma. Italy. Università degli Studi di Parma, Dipartimento di Medicina e Chirurgia, Centro Universitario di Odontoiatria, Parma. Italy.
2Università degli Studi di Parma, Dipartimento di Medicina e Chirurgia, Unità di Patologia Generale,
Parma. Italy.
3Istituto dei Materiali per l'Elettronica ed il Magnetismo (IMEM) - CNR, Parma. Italy.
Introduction
The research for new strategies and materials to enhance bone repair and/or bone regeneration is a
major goal for the management of demanding clinical
cases in orthopedics and maxillofacial surgery.
Androgens (or androgenic hormones) can be defined
as any natural or synthetic steroid that stimulates or
controls the development and maintenance of primary
and secondary male characteristics in vertebrates by
binding to the androgen receptor AR.1 Androgens also provide anabolic functions, which result in growth
and differentiation of cells and increase in body size.2 Particularly, they play a significant role in regulating
skeletal morphogenesis and maintaining bone homeostasis throughout life.3,4 The most abundant
circulating androgen in men is testosterone, whose
effect in peripheral tissues not only depends on a
direct action, but also results from a local enzymatic
conversion in different metabolites. 5α-reductase and
aromatase are among the most important enzymes
responsible for testosterone transformation in bone
tissues. 5α-reductase activity reflects in the formation
of the potent androgen dihydrotestosterone, while
aromatase catalyzes androgen conversion into the
estrogen estradiol. Depending on its peripheral
conversion, systemically administered testosterone may bind either to the AR (testosterone itself or
dihydrotestosterone) or to the estrogen receptors
ERα/ERβ (testosterone converted to estradiol), which
results in androgenic or estrogenic effects.5-7
The anabolic potential of androgens leads to the
synthesis of molecules with a low androgenic and high
anabolic action, with prolonged activity compared with
endogenous androgens: these synthetic testosterone-derivative drugs are generally known as
anabolic-androgenic steroids (AAS). One of these agents is
stanozolol (ST), a non-aromatizable AAS derived from
dihydrotestosterone.
Systemic administration of AAS in animal models
provided some encouraging results, showing an overall
increase in bone formation and mineralization, as well
as improvements in bone density and biomechanical properties.8-10 Nevertheless, other investigations
reported qualitative alterations in the bone geometry
and low bone turnover in response to ST treatment.11 In brief, the overall efficacy and the long-term safety
of AAS administration for the osteoporosis therapy
and the prevention of fracture risk appears to be at
least questionable.12 Systemic administration, local
applications of ST and other AAS have been tested in animal models to improve bone healing. Such
approaches allow the use of relatively low doses of
steroid and imply short-term treatment protocols.
Intra-articular ST administration showed positive effects on the synovial membrane and cartilage
regeneration in osteoarthritis conditions13, and
ST-soaked deproteinized bone grafts enhanced new bone
formation in calvarial critical-size defects.14
Although some evidence has been provided in
human and animal studies, only a limited number
of studies investigating ST effects on bone cells
are currently available. SaOS-2 (literally “Sarcoma OSteogenic”) cell line represents a validated option
for the study of osteoblastic differentiation and
responsiveness to exogenous stimuli. In 1987,
Rodan, et al. first conducted a study on SaOS-2
characterization and assessed that these cell lines
possess several osteoblastic features and could be
useful as a permanent line of human osteoblast-like
cells and as a source of bone-related molecules.15 SaOS-2 cells have the advantage of following the
main molecular steps of osteoblast differentiation and
have the ability “to deposit a mineralization-competent
extracellular matrix”.16 Thus, they have been recently validated as a feasible model to investigate osteoblast
activity and maturation.17 Immunocytochemical assays
revealed that SaOS-2 cells express osteoblast-like
markers such as osteocalcin (OC or BGLAP) and osteopontin (OPN or SPP1). Expression of genes
involved in osteoblast differentiation and function
(i.e. runt-related transcription factor 2, RUNX2)
has been documented.18 Also, the literature data provided evidence of SaOS-2 responsiveness to steroid
stimulation.19
The aim of this study was to assess the effects
of ST on osteogenic activity and gene expression in SaOS-2 cells. The investigation of ST effects on bone
cells may in fact provide evidence to support the
clinical use of this steroid in the field of bone healing
and regeneration, particularly for developing targeted drug administration protocols applied to orthopedic,
Materials and methods
Stanozolol preparation
ST powder (ACME Srl, Reggio Emilia, Italy) was
weighted and dissolved in absolute ethanol (ETOH), preparing 1000X stock solutions. Sequential dilutions
of stocks were performed in the osteogenic medium,
to obtain final concentrations of 1 nM, 10 nM, 100 nM,
500 nM and 1000 nM, respectively.
Cell culture
We preliminarily assessed ST effects on cell
proliferation using resazurin assay up to 12 days of
culture.
SaOS-2 cells ranging from 8 to 12 passages were plated at a density of 1×10⁴ cells/cm2 into 6-well and 24-well plates, using respectively 2 mL and 500 μL
of DMEM-low glucose with 10% fetal bovine serum
(FBS), penicillin (100 μg/mL), streptomycin (100 μg/
mL) and L-glutamine (2 mM). After 24 h, this medium
was replaced with an osteogenic medium consisting
of DMEM-low glucose completed with
2-Phospho-L-ascorbic acid (100 μM), L-proline (34.8 μM) and
β2-glycerol phosphate (5 mM). The day after (day 0), the
medium was changed with fresh osteogenic medium
containing stanozolol at the described concentrations,
while osteogenic medium with 0.1% ETOH was used as a control. The culture medium was changed every
two/three days.
Culture staining
After 6, 12 or 24 days, cells lying in 24-well plates
were treated either with Alizarin Red S or Calcein Green staining.
Alizarin Red S staining:the cells were washed three
times with PBS and fixed by adding 250 μL of 4%
formaldehyde solution for 15 min at room temperature and rinsed twice with ddH2O. Then, 500 μL of Alizarin
Red S solution in water (40 mM, pH 4,2) were added
to each well, and the whole plates were kept at RT for
30 min with gentle shaking. The dye was removed, and cells were rinsed 5 times (5 min each time) with ddH2O.
To measure Alizarin Red S concentration, each
well was treated with 200 μL of 10% acetic acid and
incubated for 30 min at RT with shaking. Cells were scraped from the plate and transferred to a 1.5 mL
microcentrifuge tube and sealed with parafilm. After
vortexing vigorously for 30 seconds, the samples were
heated to 85°C for 10 min. Then they were transferred
on ice for 5 min and centrifuged at 20000 rpm for 15
min. After centrifugation, the slurry was transferred to a new tube, and pH was adjusted to 4.1-4.5 by adding
75 μL of 10% ammonium hydroxide. An Alizarin Red
S standard curve was prepared with serial dilutions of
Alizarin Red ranging from 10 mM to 10 μM, absorbance
was measured at 405 nm with an Enspire microplate
reader (Perkin Elmer, Waltham, Massachusetts, USA).
Calcein Green staining: 24 h before the end of
the experimental period, 2 μl of Calcein Green (10
mg/mL) were added to each well. At the end of the
experimental period, the samples were treated with
500 μl of acetic acid 10% dabbed with ammonium
hydroxide pH 7.0. The whole plate was placed under slow oscillation for 20 min and then placed in an
ultrasonic bath for 15 min. Each well was then washed
three times with PBS. Semi-quantitative analysis of
Calcein Green fluorescence was measured with an Enspire microplate fluorescence reader (Perkin Elmer,
Waltham, Massachusetts, USA) set to a wavelength of
512 nm, as described elsewhere.20
Gene expression analysis
RNA extraction and reverse transcription: At 12 and 24 days of culture, total RNA was isolated from cells
seeded onto 6 well dishes with GenEluteTM Mammalian
Total RNA Miniprep Kit (Sigma-Aldrich) following the
manufacturer’s instructions, and 1 μg RNA/sample
was reverse transcribed to cDNA (GoScript Reverse
Transcription System, Promega Corporation, Madison,
Wisconsin, USA). Briefly, RNA on 0.5 μg of random
hexamer oligonucleotide primers, in a total volume of
5 μl, was heated to 70°C for 5 min, cooled to 4°C for 5 min, and then incubated with 15 μl of a mixture of components to achieve the final concentration of 0.5 mM each dNTPs, 1× first-strand buffer, 3 mM MgCl2, 1 U/μl Recombinant RNasinR Ribonuclease Inhibitor, Improm-II 1 μl/reaction, for 1 h at 42°C. The reaction
was stopped by heating to 70°C for 15 min. The RT
reaction was then diluted with nuclease free water
to a total volume of 200 μl, and a triplicate of 5 μl aliquots was used for gene expression quantification in a 20 μl PCR.
Polymerase chain reaction: The primer set was designed according to the known sequences reported
in GenBank with Primer 3 program [Steve Rozen,
Helen J. Skaletsky (1998) Primer3. Code available at
with 1X GoTaq qPCR Master, 5 pmol specific primers
and RNase-free water. PCR was performed in a 36-well Rotor Gene 3000 (Rotor-Gene™ 3000, version
5.0.60, Mortlake, Australia). Each cycle consisted
of a denaturation step at 95°C for 15 s, followed by
separate annealing (15 s, 57°C or 60°C, depending on the examined gene) and extension (15 s, 72°C)
steps. Fluorescence was monitored at the end of
each extension step. A no-template, no-reverse
transcriptase control was included in each experiment.
At the end of the amplification cycles a melting curve
analysis was added. The data analysis was performed
according to the Relative Standard Curve Method.21
Data normalization was carried out in relation to the housekeeping gene glyceraldehyde 3-phosphate
dehydrogenase (GAPDH), which was found to be
expressed uniformly in all the tested conditions.
Statistical analysis
Growth curves were analyzed using the Boltzmann
sigmoidal function, and a comparison of curve fits was
performed to verify the null hypothesis of one curve
fitting all data sets and the alternative hypothesis
of different curves for each culture condition. Cell
differentiation and osteogenic activity was analyzed
with one-way ANOVA and Tukey’s post-test. A linear
regression analysis was performed to assess variations on different time-points. p<0.05 was considered the
level of statistical significance. Graphs were obtained
with GraphPad Prism 6.0 software. Data are expressed
as mean value ± standard deviation.
Results
Culture staining
Optical microscopy showed a typical polygonal shape of SaOS-2, which tended to become slightly
elongated once they reached confluence. The resazurin assay revealed a growth pattern perfectly fitting a
Sigmoidal Boltzmann curve up to 10 days of culture
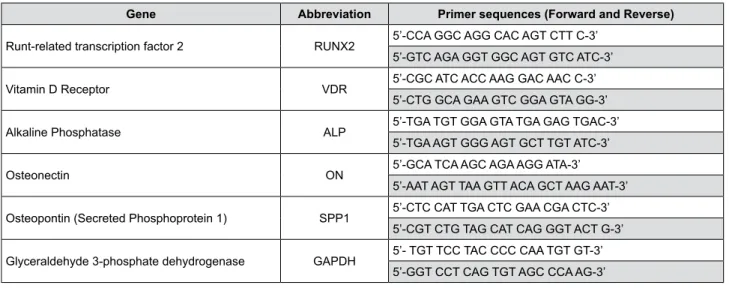
Gene Abbreviation Primer sequences (Forward and Reverse)
Runt-related transcription factor 2 RUNX2 5’-CCA GGC AGG CAC AGT CTT C-3’ 5’-GTC AGA GGT GGC AGT GTC ATC-3’
Vitamin D Receptor VDR 5’-CGC ATC ACC AAG GAC AAC C-3’ 5’-CTG GCA GAA GTC GGA GTA GG-3’
Alkaline Phosphatase ALP 5’-TGA TGT GGA GTA TGA GAG TGAC-3’ 5’-TGA AGT GGG AGT GCT TGT ATC-3’
Osteonectin ON 5’-GCA TCA AGC AGA AGG ATA-3’ 5’-AAT AGT TAA GTT ACA GCT AAG AAT-3’
Osteopontin (Secreted Phosphoprotein 1) SPP1 5’-CTC CAT TGA CTC GAA CGA CTC-3’ 5’-CGT CTG TAG CAT CAG GGT ACT G-3’
Glyceraldehyde 3-phosphate dehydrogenase GAPDH 5’- TGT TCC TAC CCC CAA TGT GT-3’ 5’-GGT CCT CAG TGT AGC CCA AG-3’
Figure 1- Sequences of primers used for RT-PCR
Figure 2- (a) Aspect of SaOS-2 cells at confluency. Optical microscopy, 10X magnification; (b) Graphic representation of SaOS-2 growth
under different conditions: DMEM-low (red line), ETOH 0.1% (blue line), ST 1-1000 nM (shades of grey). The X axis represents the days of culture, whereas the Y axis reports fluorescence values expressed in arbitrary units (A.U.)
(DMEM low: r2=0.94, ETOH 0.1%: r2=0.96, ST 1nM:
r2=0.98, ST 10nM: r2=0.93, ST 100nM: r2=0.99,
ST1000 nM: r2=0.98), while at 12 days of culture
an overall decrease in cell vitality was recorded
independently of the culture conditions. A comparison
of curve fits did not allow us to reject the null
hypothesis of one curve fitting all data sets (p=0.8),
thus indicating a superimposable growth pattern of SaOS-2 under all the tested conditions up to the end
of the experimental period. A graphic representation
of data is reported in Figure 2.
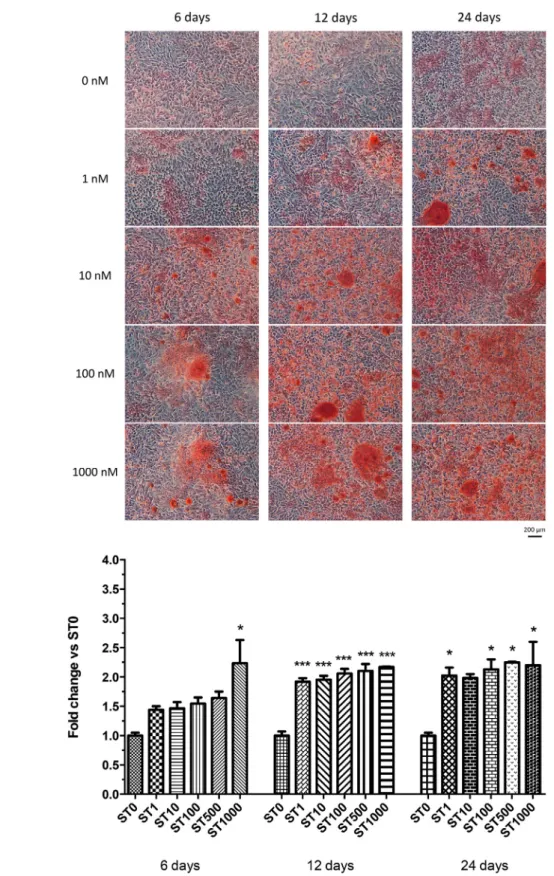
Alizarin Red S staining confirmed the capacity of
Figure 3- (a) Appearance of SaOS-cell culture treated with different stanozolol (ST) concentrations (0-1000 nM) at 6, 12 and 24 days after
Alizarin Red S staining. Optical microscopy, 10X magnification; (b) Alizarin Red S staining quantification with different ST concentrations (0-1000 nM) at 6, 12 days and 24 days. Data are reported as fold change over controls and expressed as mean ± standard deviation. Asterisks indicate statistical significance (*: p<0.05 vs ST 0 nM; ** p<0.005 vs ST 0 nM; ***: p<001 vs ST 0 nM)
a
SaOS-2 to produce calcified extracellular matrix. The
apposed matrix was characterized by round-shaped granules which increased progressively both in size
and in number depending on the concentration of the
administered steroid and extent of the induction (Figure
3a). Cells treated with ST revealed the presence of areas with mineralization since the earlier observation
time-point, which peaked at 1000 nM concentration
(fold change vs control: ST 1 nM: 1.44±0.08, p>0.05,
ST 10 nM: 1.47±0.15, p>0.05, ST 100 nM: 1.55±0.15,
p>0.05, ST 500 nM: 1.64±0.16, p>0.05, ST 1000 nM:
2.24±0.56, p<0.05). At 12 days, SAOS cell layers
cultured with ST appeared consistently more filled with calcified granules compared with the controls
at all the tested doses (fold change vs control ST 1
nM: 1.92±0.08; ST 10 nM: 1.95±0.09; ST 100 nM:
2.06±0.11; ST 500 nM: 2.10±0.16; ST 1000 nM:
2.17±0.01, p<0.01). A similar outcome was recorded at 24 days (fold change vs control ST 1 nM: 2.02±0.19;
ST 100 nM: 2.13±0.24; ST 500 nM: 2.25±0.01, ST
1000 nM: 2.20±0.57, p<0.05) (Figure 3b).
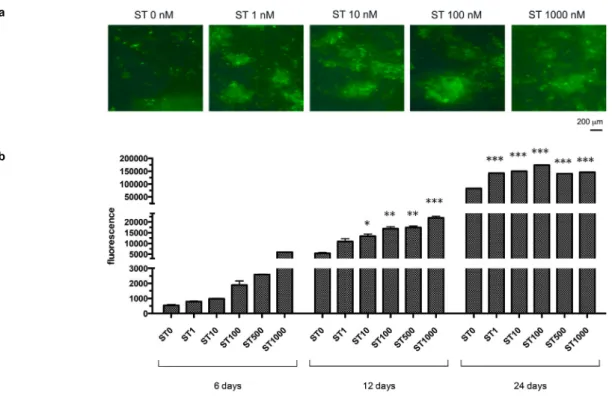
Semiquantitative analysis of Calcein Green fluorescence revealed a deposition of calcium
phosphates in response to ST administration (Figure
4a). At 6 days’ observation, a dose-dependent
trend was also evident (fold change vs control ST 1nM: 1.50±0.16, p>0.05; ST 10 nM: 1.84±0.18,
p>0.05; ST 100 nM: 3.58±0.54, p<0.005; ST 500
nM: 4.89±0.46, p<0.01; ST 1000 nM: 11.27±1.06,
p<0.01). Observations at further time-points revealed
a massive calcification in all the samples. All the tested ST doses produced significantly higher Calcein Green fluorescence compared with the controls both at 12
days (fold change vs control ST 1 nM: 2.03±0.14,
p<0.05; ST 10 nM: 2.46±0.21, p<0.05; ST 100
nM: 3.11±0.21, p<0.005; ST 500 nM: 3.21±0.21,
p<0.005; ST 1000 nM: 4.04±1.06, p<0.05) and 24 days (fold change vs control ST 1 nM: 1.75±0.10; ST
10 nM: 1.80±0.04; ST 100 nM: 2.07±0.04; ST 500
nM: 1.67±0.04; ST 1000 nM: 1.74±0.04; p<0.01)
(Figure 4b).
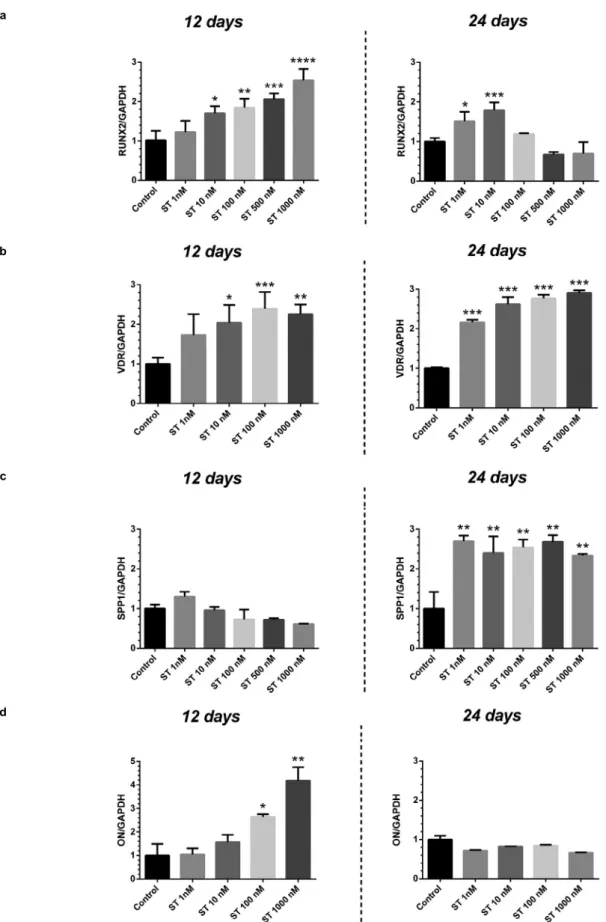
Gene expression analysis
The gene expression analysis related to osteogenic
differentiation revealed differences depending both
on the time-point (either 12 or 24 days) and on the
concentration of the steroid (Figure 5).
RUNX2: At 12 days’ observation, the Runx2
expression was shown to increase at growing
concentrations of ST, with significant differences vs
controls for doses ranging from 10 to 1000 nM (fold change vs control ST 10 nM: 1.701±0.182, p<0.05;
ST 100 nM: 1.847±0.226, p<0.005; ST 500 nM:
2.061±0.143, p<0.001; ST 1000 nM: 2.535±0.295,
a
b
Figure 4- (a) Appearance of samples treated with stanozolol (ST) (0-1000 nM) at 24 days observation period using a phase contrast
p<0.001). A similar pattern was recorded at 24 days
(fold change vs control ST 1 nM: 2.025±0.191; ST 100 nM: 2.130±0.240; ST 500 nM: 2.250±0.014, ST 1000
nM: 2.200±0.566, p<0.05). At 24 days, the Runx2
expression showed a significant increase vs control
only at the lowest ST concentrations (1 and 10 nM)
a
c b
d
Figure 5- Gene expression of SaOS-2 treated with different concentrations (0-1000 nM) of stanozolol (ST) at 12 and 24 days observation
used (fold change vs control ST 1nM: 1.514±0.234,
p<0.05; ST 10 nM: 1.786±0.201, p<0.005). A
tendency to decrease at the highest ST concentrations
(500, 1000 nM) was also detected, although without
any statistical significance (Figure 5a).
VDR: The VDR expression showed a consistent increase vs controls with the administration of the
highest ST concentrations (fold change vs control
ST 10 nM: 2.037±0.543, p<0.05; ST 100 nM:
2.388±0.427, p<0.001; ST 1000 nM: 2.255±0.247,
p<0.001) at 12 days. At 24 days, all the tested ST
doses were associated with significantly higher VDR
expression vs controls (fold change vs control ST 1 nM:
2.158±0.070; ST 10 nM: 2.622±0.179; ST 100 nM: 2.770±0.090, ST 1000 nM: 2.901±0.073, p<0.001)
(Figure 5b).
SPP1: The expression pattern of SPP1 showed
variations depending on the observation period, with
no significant differences in test groups vs controls at
12 days (p>0.05) and a consistent induction observed
at 24 days for all the tested concentrations of ST (fold
change vs control ST 1 nM: 2.691±0.145; ST 10 nM: 2.401±0.416; ST 100 nM: 2.540±0.197; ST 500 nM:
2.680±0.166, ST 1000 nM: 2.331±0.048, p<0.005)
(Figure 5c).
ON:The ON gene expression increased in response to the higher ST dose of 100 nM (fold change vs
control: 2.645±0.109, p<0.05) and 1000 nM (fold
change vs control: 4.175±0.577, p<0.001) at 12 days.
At 24 days, no significant differences in test groups vs
controls were recorded (p>0.05) (Figure 5d).
Discussion
This research investigated the effects of different
doses of ST on the proliferation and osteogenic
response of SaOS-2 cells. Growing evidence suggests androgens act directly on bone cells, playing a
complex regulatory role.22 Androgen effects on
osteogenic differentiation are still controversial,
nevertheless it has been suggested they may stimulate osteoblastic differentiation and extracellular bone
matrix apposition.23-25 Previous authors observed
the effects of androgenic steroids on cell lines and
reported positive effects of testosterone at doses of 10-10 M and 10-9 M on the proliferation of SaOS-2 cells
after 48 h.26 However, to the best of our knowledge,
only one study reported on ST effects on osteogenic
activity of bone cells, concluding that “Stanozolol at a
concentration of 10−10 mol/l to 10−6 mol/l consistently
stimulated the incorporation of [3H]thymidine into DNA
of human bone cells and increased proliferation” up to
15 days of culture.27
According to our assay, ST treatment at the doses of 1 to 1000 nM did not affect the growth pattern of
SaOS-2 cells up to 12 days of culture. This result may
be due to the specific characteristics of the steroid
used, although a peculiarity of the cells used in our experimental setting cannot be ruled out. Indeed,
various SaOS-2 subpopulations that responded
differently to proliferative and differentiative stimuli
were identified.28 Moreover, the phenotypic stability of SaOS-2 may be affected by the number of passages
they have undergone: it was noticed that a higher
passage SaOS-2 demonstrated higher proliferation
rates and lower alkaline phosphatase activities, although mineralization was significantly more
pronounced in cultures of late passage cells.29 Such findings are consistent with our results of an overall
high proliferation rate of SaOS-2 ranging from 8 to 12 passages as well as a high mineralizing activity.
Alizarin Red S and Calcein Green staining showed ST
administration notably increased mineralization. These
findings highlighted the advantages of treating cells
with androgens compared with the use of a standard
differentiation medium. At 12 days’ observation all the
tested doses showed a similar effect with Alizarin Red
S quantification technique, whereas a different
dose-dependent effect was recorded with Calcein Green
staining. These differences may point to a greater
sensitivity of Calcein Green technique compared with
Alizarin Red S. Nevertheless, neither Alizarin Red S nor Calcein Green revealed any differences between the
effect of treatment at 24 days’ observation, when all
the samples presented abundant uniform calcification.
RT-PCR analysis revealed a modulatory role played by ST on the gene expression related to
osteogenic differentiation. RUNX2 represents an early
differentiation marker, as its expression is enhanced
since the first stages of osteoblast maturation.30 The detection of RUNX2 mRNA in control samples
confirmed previous observations that described a
constitutive expression of this gene in SaOS-2 cells.18
In addition, we found out that RUNX2 expression may be modulated by steroid treatment: according
to our results at 12 days, the expression of RUNX2
consistently with the mineralization pattern (Calcein
Green staining). We may hypothesize that treatment with higher doses of ST induced a faster activation
in terms of osteo-differentiation and mineralization
when compared with lower doses. Thus, an overall
decrease in RUNX2 expression at 24 days in samples treated with high doses of ST is compatible with a
lower mitotic activity and a more mature phenotype.
On the other hand, lower doses may produce a similar
effect throughout a longer timeframe. It would be interesting to investigate the mineralization pattern
occurring between 12 and 24 days, as at 24 days we
observed a massive mineralization, which may mask
previous differences between samples.
Another hypothesis to explain RUNX2 decrease at
24 days is that of a biphasic effect of higher ST doses,
which may improve cell differentiation at early time
points (12 days) and may not keep this effect at late time points (24 days). A biphasic effect of androgens
on cell viability has been described in the literature,
with an initial increase in cell proliferation followed
by a decrease after prolonged exposure.31 However, according to our preliminary assay, ST treatment did
not affect the growth pattern of SaOS-2 up to 12
days. It would be interesting to investigate whether
a different effect on cell viability is observed between 12 and 24 days.
An increase in SPP1 expression in response to
ST was recorded respectively at 12 and 24 days
of ST treatment, which first demonstrated the modulatory activity of this androgen on genes
related to osteogenic function. Interestingly, the
expression pattern of RUNX2 and SPP1 was shown
to be inversely correlated, with a marked increase of SPP1 observed together with a decrease in RUNX2
expression. This finding may indicate an expression
switch from 12 to 24 days, as it was observed that in
SaOS-2 cells RUNX2 repressed SPP1 gene expression, and the induction of SPP1 expression during normal
human osteoblast differentiation has been previously
related to a decrease in RUNX2.32 Consistently, the
ON expression pattern revealed that, at the highest tested concentration, ST promoted the initial phases of
osteoblastic commitment (12 days), whereas its action
was no more evident at a longer time-point (24 days),
when the differentiation was more advanced. Another gene expression that was strongly enhanced by ST
treatment in our study was VDR, which encodes the
nuclear hormone receptor for vitamin D3 and has been
recognized as a key gene for SaOS-2 differentiation
elsewhere.33 It would be relevant to assess changes in the expression of other genes typical of both early
and late differentiation phases and to set a more
complete differentiation profile of cells in response to
growing steroid doses. Moreover, an examination of protein levels would be appropriate to validate our
RT-qPCR data, since mRNA expression could not directly
correlate to protein translation and activity.
A major limitation of this study is represented by the lack of assessment of ST receptor binding
and molecular pathway of action. Since ST is a
non-aromatizable androgen, we may suppose its action
to be exerted through AR. The expression of AR in SaOS-2 cells has been previously described in the
literature.34 However, the interaction of ST with AR and its influence on cell transcriptional activity is still
unclear: previous studies documented an activation of AR in response to ST treatment,35 but also a variety
of other receptors have been reported as ST ligands
(including progesterone receptor, estrogen receptor
alpha and low-affinity glucocorticoid-binding sites).36-39 Such differences could be dependent on the cell type,
as ST may have tissue-specific binding sites and elicit
differential biological responses. According to these
considerations, it would be relevant to characterize
SaOS-2 receptor profile, to investigate ST binding
to AR and to perform blockage tests to verify the
activation of different molecular pathways in response
to ST administration.
Finally, we recommend considering potential side
effects of AAS in further in vivo studies: changes in
cholesterol levels (increased low-density lipoprotein
and decreased high-density lipoprotein), liver damage, nephropathy, cardiovascular pathologies as
well as conditions pertaining to hormonal imbalance
have been reported in response to AAS high-dose or
prolonged administration.40
Conclusions
This study provided encouraging results, as it
showed ST promoted the osteogenic commitment of
SaOS-2 cells, by enhancing the mineralization process
and modulating the expression of genes related to osteogenic differentiation.
Nevertheless, further studies are required to
as to investigate ST receptor binding and molecular
pathway of action.
References
1- Hiort O. The differential role of androgens in early human sex development. BMC Med. 2013;11:152.
2- Neto WK, Gama EF, Rocha LY, Ramos CC, Taets W, Scapini KB, et al. Effects of testosterone on lean mass gain in elderly men: systematic
review with meta-analysis of controlled and randomized studies. Age (Dordr). 2015;37(1):9742.
3- Clarke BL, Khosla S. Androgens and bone. Steroids. 2009;74(3):296-305.
4- Mohamad NV, Soelaiman IN, Chin KY. A concise review of testosterone and bone health. Clin Interv Aging. 2016;11:1317-24.
5- Venken K, Callewaert F, Boonen S, Vanderschueren D. Sex hormones, their receptors and bone health. Osteoporos Int. 2008;19(11):1517-25.
6- Beck DT, Yarrow JF, Beggs LA, Otzel DM, Ye F, Conover CF, et al. Influence of aromatase inhibition on the bone-protective effects of testosterone. J Bone Miner Res. 2014;29(11):2405-13.
7- Nuti R, Martini G, Merlotti D, De Paola V, Valleggi F, Gennari L. Bone
metabolism in men: role of aromatase activity. J Endocrinol Invest. 2007;30(6 Suppl):18-23.
8- Liao J, Wu T, Li QN, Hu B, Huang LF, Li ZH, et al. Effects of stanozolol on bone mineral density and bone biomechanical properties of
osteoporotic rats. Di Yi Jun Yi Da Xue Xue Bao. 2003;23(11):1117-20. 9- Guimarães AP, Butezloff MM, Zamarioli A, Issa JP, Volpon JB.
Nandrolone decanoate appears to increase bone callus formation in young adult rats after a complete femoral fracture. Acta Cir Bras. 2017;32(11):924-34.
10- Donner DG, Elliott GE, Beck BR, Forwood MR, Du Toit EF. The effects of visceral obesity and androgens on bone: trenbolone protects
against loss of femoral bone mineral density and structural strength in viscerally obese and testosterone-deficient male rats. Osteoporos Int. 2016;27(3):1073-82.
11- Nebot E, Aparício VA, Camiletti-Moirón D, Martinez R, Erben RG,
Kapravelou G, et al. Stanozolol decreases bone turnover markers, increases mineralization, and alters femoral geometry in male rats.
Calcif Tissue Int. 2016;98(6):609-18.
12- Farooqi V, van den Berg ME, Cameron ID, Crotty M. Anabolic
steroids for rehabilitation after hip fracture in older people. Cochrane Database Syst Rev. 2014;10:CD008887.
13- Spadari A, Romagnoli N, Predieri PG, Borghetti P, Cantoni AM, Corradi A. Effects of intraarticular treatment with stanozolol on synovial
membrane and cartilage in an ovine model of osteoarthritis. Res Vet Sci. 2013;94(3):379-87.
14- Ghiacci G, Graiani G, Cacchioli A, Galli C, Lumetti S, Ravanetti F, et al. Stanozolol-soaked grafts enhance new bone formation in rat calvarial
critical-size defects. Biomed Mater. 2017;12(4):045016.
15- Rodan SB, Imai Y, Thiede MA, Wesolowski G, Thompson D,
Bar-Shavit Z, et al. Characterization of a human osteosarcoma cell line (Saos-2) with osteoblastic properties. Cancer Res.
1987;47(18):4961-6.
16- McQuillan DJ, Richardson MD, Bateman JF. Matrix deposition by
a calcifying human osteogenic sarcoma cell line (SAOS-2). Bone. 1995;16(4):415-26.
17- Prideaux M, Wijenayaka AR, Kumarasinghe DD, Ormsby RT, Evdokiou A, Findlay DM, et al. SaOS2 Osteosarcoma cells as an in vitro
model for studying the transition of human osteoblasts to osteocytes. Calcif Tissue Int. 2014;95(2):183-93.
18- Lucero CM, Vega OA, Osorio MM, Tapia JC, Antonelli M, Stein GS, et al. The cancer-related transcription factor Runx2 modulates
cell proliferation in human osteosarcoma cell lines. J Cell Physiol. 2013;228(4):714-23.
19- Rao LG, Wylie JN, Kung Sutherland MS, Murray TM. 17 beta-oestradiol enhances the stimulatory effect of 1,25-dihydroxyvitamin D3
on alkaline phosphatase activity in human osteosarcoma SaOS-2 cells in a differentiation-dependent manner. J. Endocrinol. 1996;148(1):181-7. 20- Hale LV, Ma YF, Santerre RF. Semi-quantitative fluorescence analysis of calcein binding as a measurement of in vitro mineralization. Calcif
Tissue Int. 2000;67(1):80-4.
21- Pfaffl MW. A new mathematical model for relative quantification in real-time RT-PCR. Nucleic Acids Res. 2001;29(9):e45.
22- Vanderschueren D, Vandenput L, Boonen S, Lindberg MK, Bouilln
R, Ohlsson C. Androgens and bone. Endocr Rev. 2004;25(3):389-425. 23- Lin IC, Slemp AE, Hwang C, Sena-Esteves M, Nah HD, Kirschner
RE. Dihydrotestosterone stimulates proliferation and differentiation of fetal calvarial osteoblasts and dural cells and induces cranial suture
fusion. Plast Reconstr Surg. 2007;120(5):1137-47.
24- Gao K, Wang X, Liu Q, Chen W, Wang G, Zhang D, et al.
Evaluation of osteoblast differentiation and function when cultured on mesoporous bioactive glass adsorbed with testosterone. J Cell Biochem.
2018;119(7):5222-32.
25- Costa KJ, Passos JJ, Gomes AD, Sinisterra RD, Lanza CR, Cortés
ME. Effect of testosterone incorporation on cell proliferation and differentiation for polymer-bioceramic composites. J Mater Sci Mater
Med. 2012;23(11):2751-9.
26- Fohr B, Schulz A, Battmann A. Sex steroids and bone metabolism:
comparison of in vitro effects of 17beta-estradiol and testosterone on human osteosarcoma cell lines of various gender and differentiation.
Exp Clin Endocrinol Diabetes. 2000;108(6):414-23.
27- Vaishnav R, Beresford JN, Gallagher JA, Russell RG. Effects of the
anabolic steroid stanozolol on cells derived from human bone. Clin Sci (Lond). 1988;74(5):455-60.
28- Kasperk CH, Faehling K, Börcsök I, Ziegler R. Effects of androgens on subpopulations of the human osteosarcoma cell line SaOS2. Calcif
Tissue Int. 1996;58:376-82.
29- Hausser HJ, Brenner RE. Phenotypic instability of Saos-2 cells in
long-term culture. Biochem Biophys Res Commun. 2005;333(1):216-22.
30- Cutarelli A, Marini M, Tancredi V, D’Arcangelo G, Murdocca M, Frank C, et al. Adenosine triphosphate stimulates differentiation and
mineralization in human osteoblast-like Saos-2 cells. Dev Growth Differ. 2016;58(4):400-8.
31- Wiren KM, Toombs AR, Zhang XW. Androgen inhibition of MAP kinase pathway and Elk-1 activation in proliferating osteoblasts. J Mol
Endocrinol. 2004;32(1):209-26.
32- Lamour V, Detry C, Sanchez C, Henrotin Y, Castronovo V, Bellahcène
A. Runx2- and histone deacetylase 3-mediated repression is relieved in differentiating human osteoblast cells to allow high bone sialoprotein
expression. J Biol Chem. 2007;282(50):36240-9.
33- Rao LG, Liu LJ, Rawlins MR, McBroom RJ, Murray TM, Reddy
GS, et al. The biological activities of 1alpha,25-dihydroxyvitamin D3 and its synthetic analog 1alpha,25-dihydroxy-16-ene-vitamin D3 in
normal human osteoblastic cells and human osteosarcoma SaOS-2 cells are modulated by 17-beta estradiol and dependent on stage of
differentiation. Biol Pharm Bull. 2001;24(3):242-8.
34- Orwoll ES, Stribrska L, Ramsey EE, Keenan EJ. Androgen receptors
in osteoblast-like cell lines. Calcif Tissue Int. 1991;49(3):183-7. 35- Feldkoren BI, Andersson S. Anabolic-androgenic steroid interaction
with rat androgen receptor in vivo and in vitro: a comparative study. J Steroid Biochem. 2005;94:481-7.
37- Zhu SY, Li YH, Ma HM, Huang TT, Luo HB, Dou J, et al. Stanozolol
regulates proliferation of growth plate chondrocytes via activation of ERalpha in GnRHa-treated adolescent rats. J Pediatr Endocrinol Metab.
2011;24(5-6):275-81.
38- Fernández L, Chirino R, Boada LD, Navarro D, Cabrera N, del Rio
I, et al. Stanozolol and danazol, unlike natural androgens, interact with the low affinity glucocorticoid-binding sites from male rat liver microsomes. Endocrinology. 1994;134(3):1401-8.
39- Ucer S, Iyer S, Bartell SM, Martin-Millan M, Han L, Kim HN, et al.
The effects of androgens on murine cortical bone do not require AR or ERa signaling in osteoblasts and osteoclasts. J Bone Miner Res. 2015;30(7):1138-49.