BJRS
RADIATION SCIENCES
07-02B (2019) 01-14ISSN: 2319-0612 Accepted: 2019-07-09
Artificial neural networks for spatial distribution of fuel
assemblies in reload of PWR reactors
E. C. A. Oliveira, V. F. Castro, P. A. L. Reis, C. Pereira
Departamento de Engenharia Nuclear /Universidade Federal de Minas Gerais /Av. Pres. Antônio Carlos, 6627/31270-901 Pampulha, Belo Horizonte, MG.
[email protected];[email protected]
ABSTRACT
An artificial neural network methodology is being developed in order to find an optimum spatial distribution of the fuel assemblies in a nuclear reactor core during reloading. The main bounding parameter of the modeling
was the neutron multiplication factor, keff. The characteristics of the network are defined by the nuclear
parame-ters: cycle, burnup, enrichment, fuel type, and average power peak of each element. As for the artificial neural network, the ANN Feedforward Multi_Layer_Perceptron with various layers and neurons were constructed. Three algorithms were used and tested: LM (Levenberg-Marquardt), SCG (Scaled Conjugate Gradient) and BayR (Bayesian Regularization). The artificial neural network has implemented using MATLAB 2015a version. As preliminary results, the spatial distribution of the fuel assemblies in the core using a neural network was slightly better than the standard core.
1. INTRODUCTION
The fuel reload of a nuclear reactor includes operational and safety restrictions. It is a process in-volving the insertion of fuel elements with varied enrichment. Some assemblies already contain partially irradiated fuel, while others contain fresh fuel, besides those that have a mixture of burna-ble poisons. For these reasons, the spatial distribution of the fuel elements in the core influences the behavior of the reactor. The fuel elements with higher burnup have fewer reactivity than another new element, for example. In view of this, when inserting two or more elements with high-level of burnup, together there may be a power outage in that core region. Whereas two or more new ele-ments inserted together tend to increase power in a certain region, which is not adequate [3, 5, 7]. In addition, there is still a concern in the optimization of the fuel elements in the core. It is safe to say that, by reducing the costs of the reactor operation, the cost of electricity production is also re-duced [3].
This work goal is to identify an acceptable reload standard for a PWR (Pressurized Water Reactor) core so that minimizes the fuel burnup, thus extending the burnup. There are several published works where the authors conducted tests using modern algorithms such as the evolutionary, heuris-tic and artificial neural networks (ANN). However, by the time, due to the expensive computational resources, no solution was implemented that could present a reload pattern with the characteristics desired above for any reload set.
Artificial neural networks are used to receive a set of fuel elements composed by ¼ of the PWR core out of the standard and, after processing, they are able to generate a dataset with a satisfactory spatial distribution. This means that the output proposed by the ANN model will be tested by a nu-clear code system to calculate and obtain nunu-clear data to serve as parameters to validate the ANN output. The choice of this technology was due to the success achieved in difficult-solving problems. Currently, artificial neural networks have been used for some time to predict, extract, classify, and group data [14]. In recent years, work with artificial neural networks has gone beyond, being widely used in electronic games, identification of images, texts and voice, to name just a few. On the next section, some correlated works are presented. Next, artificial neural networks are briefly described. Then the methodology adopted will be detailed, as well as the results of the experiments. And final-ly, considerations will be made on the proposed solution.
2. MATERIALS AND METHODS
2.1. ARTIFICIAL NEURAL NETWORK
Artificial neural networks (ANN) process information differently than a traditional computer. ANN has the fitness to them, making them able to solve complex problems such as pattern recognition [21].
A traditional computer system cannot resolve simple tasks like some that are performed by animals, such as recognition of a familiar face in an unknown scenario. The brain has a learning capability, and, in humans, this phase happens with greater intensity in the first two years of life. However, the process goes well beyond, practically in the entire life of the individual [14]. Artificial neural net-works have similar traits, so they can learn from experience, as well as the biological brain. Next sections will present neural, feedforward architecture and backpropagation training algorithm.
2.2. ARTIFICIAL NEURON
The first model of ANN (Artificial Neural Network) arose around 1946 with McCuloch and Pitts [22]. Scientists proposed the first artificial neuron as can be verified in Figure 1.
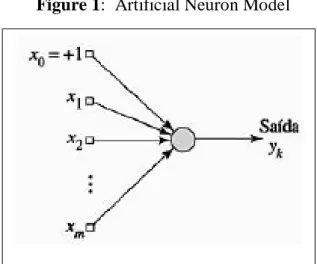
Figure 1: Artificial Neuron Model
The model was composed of a processor unit represented in Figure 1 by the filled or colored circle. The entries or data to be processed are characterized by squares starting with X1, X2... Xm. The
out-put is represented only by Yk. The first square x0 = + 1 corresponds to the bias, for instance, it is an
entry that always receives value 1. The purpose of this differentiated entry assists in processing the data.
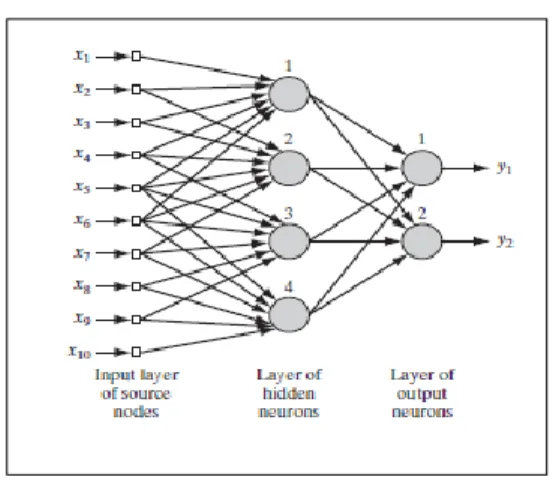
ANN is formed by several brain cells and layers. The quantity is defined according to the complexi-ty of the problem [14]. Figure 2 shows an ANN model.
Figure 2 shows an artificial neural network with an input layer, a layer hidden, and a layer output. The choice of architecture besides depending on the complexity of the problem should also consider learning algorithm. There are several algorithms that can be used, the traditional is the backpropaga-tion [21].
2.1.2 LEARNING ALGORITHM
Learning algorithms are structured programs that aim to assist in the learning of ANN. They have two main features, namely, learning algorithms can be or not supervised.
A supervised algorithm is the one that receives input and output data for processing. With this, ANN during a stage called training knows the input and output [14].
Figure 2: Artificial Neural Network Model
Unsupervised algorithms do not receive output, only the input. Therefore, they do not know the nature of the data. Generally, these algorithms are used for grouping, for instance, they receive mul-tiple data and organize them according to the identified characteristics [21].
The backpropagation algorithm is supervised, thereby, receives a vector with data in input to be computed and another vector with the corresponding responses. When arriving in the ANN output layer, the Backpropagation compares the output computed by ANN with the corresponding re-sponse that it received. If the results are different, for example, if ANN computed wrong, he stores the error and returns to the beginning of the ANN architecture, restarting processing.
For all commonly supervised algorithms, the initial dataset is separated into two sets. The first of them is for training, usually 80% of the total. The second set is used for validation [14]. This proce-dure appropriate because with 80% of total data, ANN will train, for instance, will receive the input, compute the output and compare to the answer. This is the training phase. However, necessary to perform tests to verify the learning, so the 10% separated previously has this purpose and last set is used for validation that is a parameter used by the ANN programmer to stop processing if ANN not learning [22]. Thus, while improvements are occurring, while ANN is computed as the input com-pared to the output, the process continues. In this case, the stop parameter will be the amount of processing stipulated by the programmer. Otherwise, if ANN reaches the stipulated quantity for validation without improving the learning, the ANN stops processing. This parameter will prevent the ANN from performing all tests without reaching the goal. In some cases, the performance can be around 20% or 30% of the training. The ideal, in this case, is to stop [23].
2.1.3 LEARNING PROCESS
ANN of type MultiLayer Perceptron can contain N connections to represent the N input variables. An example of input vector could be {x1, x2.... Xn}. The corresponding weight vector, w, would be
{w1, w2, w3,... wn}. The response of the processing represented by the letter 𝑢 in equation 1 below
would be [21]:
𝑢 = 𝑤1𝑥1+ 𝑤2𝑤2+ ⋯ + 𝑤𝑛𝑥𝑛
The threshold function defined in the source produces a 𝑦 - output, so that:
If ANN response is correct so that computed values are equal to those received, the weight vector is not adjusted. Otherwise, the individual weights are adjusted using a Perceptron learning algorithm, which is a modified form of Hebbian learning that incorporates the error as follows [22]:
𝐸𝑟𝑟𝑜𝑟 = 𝐸 = 𝑡 − 𝑦
Where´s T is the expected exit. The weights vector is upgraded to equation 4.
𝑤𝑛𝑒𝑤 = 𝑤𝑜𝑙𝑑+ 𝛽 𝑥 𝐸
Where 𝑤𝑛𝑒𝑤 is the new weight value, 𝑤𝑜𝑙𝑑 is the value of the old weight, 𝑥 is the input vector and β
is the learning rate. This is a constant between 0 and 1 that aims to adjust the learning speed. When β has a lower value, the adjustment occurs slower and so, the training time will be longer. While using higher values, learning will accelerate.
Accelerating learning does not mean better performance because it can cause instability. The algo-rithm jumps in wide steps oscillating around optimal points, without yet reaching them [21].
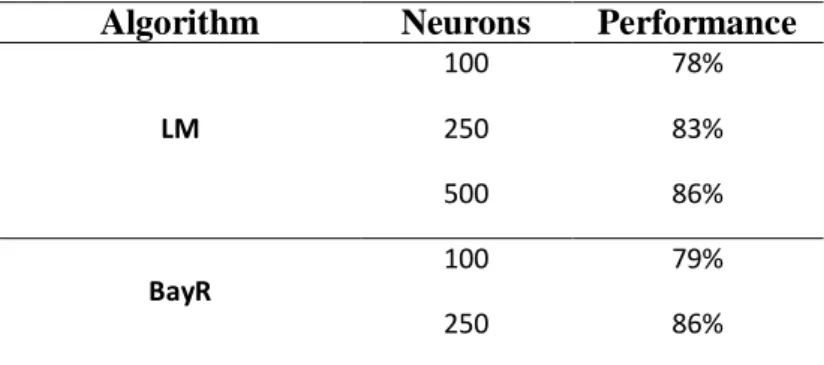
3. METHODOLOGY
3.1 Obtaining DataAn ANN learns using a stochastic optimization algorithm, as is the case of backpropagation and its variations. Therefore, a large amount of data is required for training. The size of the data set de-pends on the complexity of the problem. However, according to the literature, the more data, better [14]. (2) 𝑦 = {0, 𝑢 < 0 1, 𝑢 ≥ 0 (3) (4)
For this work, 70 sets of PWR reactor core ¼ validated by the PARCS1 nuclear code were used. Each set consisted of 20 characteristics of the combustible elements and their positions, as well as information of the core geometry. The clusters were obtained through the ANN itself. As it was presenting results deemed appropriate, these were validated by the nuclear code and then inserted into the model training set in order to further improve it.
The whole process worked as follows: In order to generate a method that could be repeated was developed a computational system to present a set of data for ANN, then extract the response and generate the input to be validated by the code Nuclear PARCS. After validation, the system sought the exit of the PARCS and performed another validation based on certain criteria, such as keff < =
1.10 and the 5 highest relative power peaks lower than 1.6. If the system response was acceptable, the set was part of the training group. Figure 3 shows the generated method for obtaining the data, processing it in the ANN, and validating it in the PARCS.
1 https://engineering.purdue.edu/Engr/AboutUs/Facilities/NE/PARCS
3.2 ANN Training
Each data set was separated int other parts, being 80% used for ANN training, the remainder for validation. Each data set consisted of 56 rows of data, i.e. 56 x 70 sets. Therefore, the complete set consisted of 3,920 information or data line.
Of the total 3,136 data were used for training. The remainder of the data was used for ANN valida-tion. All data were normalized using the Min/Max funcvalida-tion. Equation 5 shows the normalization used [23].
𝑥𝑇𝑖 = 𝑥𝑖−𝑥𝑖𝑚𝑖𝑛
𝑥𝑖𝑚𝑎𝑥− 𝑥𝑖𝑚𝑖𝑛
where 𝑥𝑖𝑚𝑖𝑛 and 𝑥𝑖𝑚𝑎𝑥 are the minimum and maximum values of the 𝑥𝑖 variable.
To perform the tests that, in this case, means to evaluate the accuracy of ANN after training, 3 sets of data were used. These sets totaled 168 lines in total.
3.2.1 ANN Validation
In this work, the cross-validation method was used. It is a process where a reserved set is divided into a certain quantity and each time one of these parts is tested in ANN. This data used for valida-tion is not part of the training set, so they are unknown by the model.
In each training step, a subset of the validation set is confronted with the ANN result. This is done by presenting an example of the validation for the ANN and the predicted result is compared with the actual result. Thus, all results are counted to verify the accuracy of ANN.
3.2.2 ANN Tests
After completion of the ANN training, the test set is used to verify the performance of the trained ANN. This work, after ANN training, the model received three sets of data containing the equiva-lent of core ¼, that is, 56 rows of data. The after process performed by ANN, the response was cap-tured, the exchanges performed and then validated by the nuclear PARCS code.
The response of the PARCS, which are the safety values used in this work, keff and relative power
peaks were compared with the values prior to the process. The result considered appropriate was accounted for or discarded if it was worse than the previous one.
3.3 Materials and Methods
The ANN code was implemented in the MATLAB 2018a. The model was built with 20 characteris-tics in the input layer, two hidden layers, the two with 50 neurons and the output layer with only 1 neuron.
The activation function used was the hyperbolic tangent in the first layer, ReLu in the second and the output layer has not used any function. The learning rate that helped in the proper convergence had a value of 0.010.
4. RESULTS AND DISCUSSION
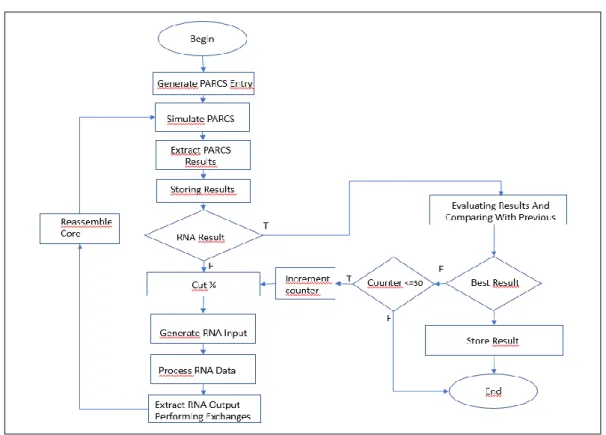
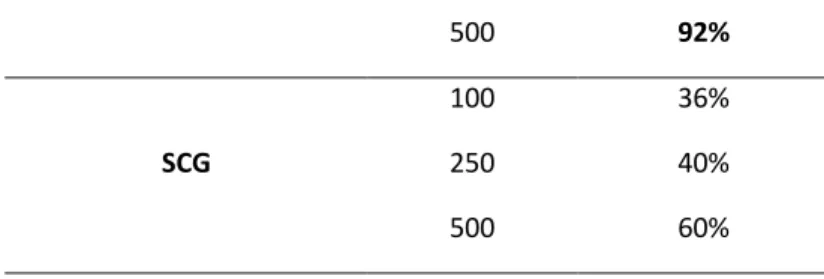
The accuracy of ANN was measured in the training by accounting for the correct output values compared to the predicted value with the actual value. As a supervised model, both the characteris-tics and the response were passed on to the ANN. So, it had to compare the actual value with the predicted making notes of the errors and hits. The learning algorithm used was the Backpropagation with three variations, the first being Levemberg (LM), the second the Bayesian (Bayr) and the third the Conjugated Scaled (SCG). In the training, the results ranged from 36% to 92% of accuracy, as can be seen in Table 3.
Table 3: Results of Experiments in the Training Phase
Algorithm Neurons Performance
LM 100 78% 250 83% 500 86% BayR 100 79% 250 86%
500 92%
SCG
100 36% 250 40% 500 60%
With the trained model, tests were performed with data sets unknown by ANN. This phase indicates whether the neural network has learned and can be used in production. Three sets were used, and for each case, the keff and the highest relative power peak value was recorded in order to compare
with the result at the end of the process. The results presented by the ANN were validated by the PARCS results and then compared with the previous results. The images 4a to 6a present the results obtained the trained model, i.e. in the test phase.
2 5 8 11 14 0 0,5 1 1,5 2 2 3 4 56 7 8 9 10 11 12 13141516 PE A K PO W E R POSITION
Relative Power Distribution Before RNA
1,5-2 1-1,5 0,5-1 0-0,5 2 5 8 11 14 0 0,2 0,4 0,6 0,8 1 1,2 1,4 1,6 1,8 2 2 3 4 5 6 7 8 9 101112 131415 16 PE AK PO W ER POSITION
Relative Power Distribution Bef ore RNA
1,8-2 1,6-1,8 1,4-1,6 1,2-1,4 1-1,2 0,8-1 0,6-0,8 0,4-0,6 0,2-0,4 0-0,2 2 5 8 11 14 0 0,5 1 1,5 2 3 4 5 67 8 910 11 12 13 14 1516 PE A K PO W E R POSITION
Relative Power Distribution After RNA
1-1,5 0,5-1 0-0,5 2 5 8 11 14 0 0,5 1 1,5 2 3 4 5 6 7 8 910 11 12 13 14 15 16 PE A K PO W E R POSITION
Relative Power Distribution After RNA
1-1,5 0,5-1 0-0,5
Figure 4a: Case 1- Relative Power
Distribution Before RNA. k-effective: 1.0976
Highest relative power peak: 1.52
Figure 5b: Case 2 - Relative Power
Distri-bution After RNA. k-effective: 1.0943
Highest relative power peak: 1.32
Figure 5a: Case 2- Relative Power
Distribution Before RNA. k-effective: 1.1016
Highest relative power peak: 1.55
Figure 4b: Case 1 - Relative Power
Distribution After RNA. k-effective: 1.093
5. CONCLUSION
Optimizing a set of data from a reactor is considered a complex problem, because when performing an exchange, the peak of the relative power of the fuel element is changed, from the neighbors and, consequently, from the whole nucleus. In addition, the number of combustible elements in the core, as in the case of Angra 2 contributes making it even more difficult. In this article, an ANN was im-plemented in order to optimize the core of a PWR reactor.
As seen in this article, an ANN learns from examples. Thus, two sets of datasets generated, being 80% for training and the remainder for validation. Next, an ANN model was developed with three different learning algorithms and Bayesian presented results above 90% in the trainings.
In the tests, the trained ANN suggested exchanges that when applied resulted in an optimized set. In this article only 3 results were presented, however, the trained model was able to optimize 8/10 un-known sets.
In future works, other technologies are also suggested, such as deep learning. These are modern techniques that have obtained satisfactory results in several fields, especially unknown data.
6. ACKNOWLEDGMENT
The authors are grateful to the Brazilian research funding agencies, CNEN (Comissão Nacional de energia Nuclear), CNPq (Conselho Nacional de Desenvolvimento e Pesquisa), CAPES (Brazil) and FAPEMIG (Funadação de Amparo à Pesquisa do Estado de Minas Gerais) for the support.
REFERENCES
Figure 6a: Caso 3 - Relative Power
Dis-tribution Before RNA. k-effective: 1.112
Highest relative power peak: 1.52
2 5 8 11 14 0 0,5 1 1,5 2 3 4 56 7 8 9 10 11 1213 14 1516 PE A K PO W ER POSITION
Relative Power Distribution Before RNA
1-1,5 0,5-1 0-0,5 2 5 8 11 14 0 0,5 1 1,5 2 3 4 567 8910 11 12 13141516 PE A K PO W E R POSITION
Relative Power Distribution After RNA
1-1,5 0,5-1 0-0,5
Figure 6b: Case 3 - Relative Power
Dis-tribution After RNA. k-effective: 1.0912
1. AUGUSTO, C. S. P. JOÃO, NICOLAU, S. ANDRESSA, SCHIRRU, ROBERTO. PSO with Dynamic Topology and Random Keys method applied to Nuclear Reactor Reload, Brazil, 2015, Vol. 83, pp. 191-196.
2. BABAZADEH, DAVOOD, BOROUSHAKI, MEHRDAD, LUCAS CARO. Optimization Of Fuel Core Loading Pattern Design In: VVER Nuclear Power Reactors Using Particle
Swarm Optimization (PSO), 2009, Iran, Elsevier, vol. 23, pp. 923-930.
3. CACUCI, D.G. Handbook of Nuclear Engineering, Springer Verlag, Alemanha, 2013. 4. CHAPOT, L. C. JORGE, SILVA, C. FERNANDO, SCHIRRU, ROBERTO. A New
Ap-proach to the Use Of Genetic Algorithms to Solve the Pressurized Water Reactor's Fuel Management Optimization Problem, Brazil, 1999, Pergamon, Vol. 26, pp. 641-651.
5. COCHRAN, Robert G. Tsoulfanidis, Nicholas. The Nuclear Fuel Cycle: Analysis and
Management, American Nuclear Society, 1999.
6. CHUNHUI DAI, XINYU WEI, YUN TAI, FUYU ZHAO, The Optimum Design of Power Distribution For Pressurized Water Reactor, China, 2012, Vol. 50, pp. 126-132.
7. DUDERSTADT, James and Louis J. Hamilton. Nuclear Reactor Analysis, Wiley, NY, 1976.
8. ERDOGAN, ADEM MELIH, GEC. A PWR Reload Optimization Code Using Artificial Neural Networks and Genetic Algorithms, Turkey, 2003, Elsevier, Vol. 30, pp. 35-53. 9. FARIA, EDUARDO FERNANDES, Otimização da Distribuição Espacial de Combustíveis
Reprocessados Utilizando Técnicas de Redes Neurais, Dissertação, Ciências Técnicas Nu-cleares da Universidade Federal de Minas Gerais, Brazil, 1999.
10. FARIA, F. EDUARDO, PEREIRA, CLAUBIA. Nuclear Fuel Loading Pattern Optimization Using A Neural Network, Brazil, 2003, Pergamon, Vol. 30, pp. 603-613.
11. FOSTER, Artur R., Basic Nuclear Engineering, Third Edition, 1977.
12. GLADSTONE, Samuel. Ingenieria de Reactores Nucleares, Editorial Reverté, Barcelona, 1975.
13. GONZALVEZ, JOSÉ. Sensitivity study on e termining an efficient set of fuel assembly pa-rameters in training data for designing of neural networks in hybrid genetic algorithms, Spain, 2005, Elsevier, Vol. 33, pp. 457-465.
14. HAYKIN, Simon. Neural Networks and Learning Machines, 3ª edição, New Jersey, Prentice Hall, 2009.
15. LEWIS, Elmer E. Fundamentals of Nuclear Reactor Physics, Academic Press, 1ª edição, 2008.
16. NICOLAU, S. ANDRESSA, SHIRRU, ROBERTO, LIMA, M. M.,ALAN. Nuclear Reactor Reload Using Quantum Inspired Algorithm, Brazil, 2012, Elsevier, Vol. 55, pp. 40-48. 17. OLIVEIRA, M. IONÁ, SCHIRRU, ROBERTO. Swarm Intelligence of Artificial Bees
Ap-plied To In-Core Fuel Management Optimization, Brazil, 2011, Vol. 38, pp. 1039-1045. 18. ORTIZ, J. JOSE, REQUENA, IGNACIO. Using A Multi-State Recurrent Neural Network
To Optimize Loading Patterns In Bwrs, Spain, 2004, Elsevier, Vol. 31, pp. 789-803.
19. POURSALEHI, N, ZOLFAGHARI, MINUCHEHR. Multi-Objective Loading Pattern En-hancement Of PWR Based on the Discrete Firefly Algorithm, Teerã, Elsevier, 2012, Vol. 57, pp. 151-163.
20. POURSALEHI, N., ZOLFAGHARI, A., MINUCHEHR, A., MOGHADDAM,H.K. Contin-uous Firefly Algorithm Applied to PWR Core Pattern Enhancement, Teerã, Elsevier, 2012, vol. 258, pp.107-115.
21. REZENDE, Solange Oliveira. Sistemas Inteligentes – Fundamentos e Aplicações, São Paulo, Manole, 2005.
22. RUSSELL, Stuart; Norvig, Peter. Artificial Intelligence - A Modern Approach, Third Edition, New Jersey, Prentice Hall Series em Inteligência Artificial, 2010.
23. SAMARASINGHE, Sandhya. Neural Networks for Applied Sciences and Engineering:
From Fundamentals to Complex Pattern Recognition, New Jersey, Auerback
24. SHICHANG LIU, JIEJIN, CAI. Studies of Fuel Loading Pattern Optimization For a Typical Pressurized Water Reactor (PWR) Using Improved Pivot Particle Swarm Method, Brazil, 2012, Elsevier, Vol. 50, pp.117-125.
25. SILVA, H. MÁRCIO, SCHIRRU, ROBERTO. A Self-Adaptive Quantum PBIL Method For The Nuclear Reload Optimization, Brazil, Elsevier, 2014, vol. 74, pp. 103-109.
26. SILVA, H. MÁRCIO, SCHIRRU, ROBERTO, LIMA, M. M. ALAN. QACO_Alpha ap-plied to the nuclear reactor core fuel reload optimization, Brazil, 2011, Elsevier, Vol. 53, pp. 80-85.
27. SOUZA, M. ROSE, MOREIRA, JOÃO. Neural network correlation for power peak factor estimation, Brazil, 2006, Elsevier, Vol. 33, pp. 594-608.
28. STOUT, B. RICHARD, Optimization Of In-Core Nuclear Fuel Management In a Pressur-ized Water, Thesis/Dissertation, Oregon State University, 1972.
29. TAVARES, ODILON A. P. Energia Nuclear: ontem e hoje, Revista Ciência Hoje, edição 299, 2013. Last accessed: 18/11/2017.