Cop
yright
© ABE&M t
odos os dir
eit
os r
eser
vados
.
Parameters of glycemic control
in type 2 diabetic patients on
hemodialysis or peritoneal dialysis:
implications for clinical practice
Parâmetros do controle glicêmico em pacientes com diabetes melito tipo 2 em hemodiálise ou diálise peritoneal: implicações para a prática clínica
Maria Valeria Pavan1, Cibele Isaac Saad Rodrigues2, Ronaldo D’Ávila2,
Enio Marcio Maia Guerra2, Ricardo Augusto de Miranda Cadaval2,
Fernando Antonio de Almeida2
ABSTRACT
Objective: To better explore the relationship between parameters of glycemic control of T2DM in RRT, we studied 23 patients on hemodialysis (HD), 22 on peritoneal dialysis (PD), and com-pared them with 24 T2DM patients with normal renal function (NRF). Materials and methods: We performed, on four consecutive days, 10 assessments of capillary blood glucose [4 fasting, 2 pre- and 4 postprandial (post-G) and average (AG)], random glycemia, and HbA1c in all pa-tients. Results: Preprandial blood glucose was greater in patients on RRT compared with NRF. Correlations between AG and HbA1c were 0.76 for HD, 0.66 for PD, and 0.82 for NRF. The regres-sion lines between AG and HbA1c were similar for patients on HD and with NFR, but they were displaced upward for PD. Conclusion: Similar HbA1c values in PD patients may correspond to greater levels of AG than in HD or NRF patients. Arq Bras Endocrinol Metab. 2013;57(6):457-63
Keywords
Type 2 diabetes mellitus; hemodialysis; peritoneal dialysis; hemoglobin A1c; end-stage renal disease RESUMO
Objetivo: Para melhor explorar a relação entre os parâmetros de controle glicêmico em DM2 em TRS, estudamos 23 pacientes em hemodiálise (HD), 22 em diálise peritoneal (DP) em com-paração à 24 DM2 com função renal normal (FRN). Materiais e métodos: Em quatro dias con-secutivos, realizamos 10 glicemias capilares [4 em jejum, 2 pré- e 4 pós-prandiais (G-pós) e a média glicêmica (MG)], glicemia aleatória e HbA1c em todos os pacientes. Resultados: As gli-cemias pré-prandiais foram mais elevadas nos pacientes em TRS se comparadas àqueles com FRN. As correlações entre MG e HbA1c foram em HD = 0,76; DP = 0,66 e FRN = 0,82. As retas de regressão entre MG e HbA1c assemelham-se nos pacientes em HD e NFR e estão deslocadas para cima em DP. Conclusão: Valores similares de HbA1c podem corresponder a MG maiores em pacientes em DP do que em HD ou FRN. Arq Bras Endocrinol Metab. 2013;57(6):457-63
Descritores
Diabetes melito tipo 2; hemodiálise; diálise peritoneal; hemoglobina A glicosilada; doença renal terminal
1 Centro de Diálise e Transplante
Renal, Hospital Santa Lucinda, Pontifícia Universidade Católica de São Paulo (PUC-SP), Sorocaba, SP, Brazil
2 Nephrology Division at Faculdade
de Ciências Médicas e de Saúde, PUC-SP, Sorocaba, SP, Brazil
Correspondence to:
Cop
yright
© ABE&M t
odos os dir
eit
os r
eser
vados
.
INTRODUCTION
D
iabetic nephropathy is the leading cause of end--stage renal disease (ESRD) in many countries (1-4). Furthermore, the mortality of diabetic patients on renal replacement therapy (RRT), independent on the dialysis method, is greater than in comparable patients without diabetes (4,5). Many factors may be associated with the increased mortality rate of diabe-tic patients under dialysis, such as older age, gender, hypoalbuminemia, malnutrition and inlammation, smoking, dialysis vintage, dialysis dose, arrhythmia or left ventricular hypertrophy, prior cardiovascular events, hypocholesterolemia, hyperphosphatemia, and poor glycemic control before or during dialysis (4-12). However, there is lack of information about the effects of improving glycemic control on morbidity and mortality in patients with diabetes on hemodialysis and peritoneal dialysis (PD). Moreover, the goals for glyce-mic control parameters used in patients with diabetes on RRT have been the same as those used in patients with preserved renal function, particularly, blood or capillary glucose and glycated hemoglobin (HbA1c). Indeed, we do not even know if values indicating good glycemic control for individuals without renal failure also apply for those under dialysis, particularly on PD. One previous study has shown that diabetic patients on hemodialysis had greater values of HbA1c for the same average glucose levels than patients with preserved re-nal function in the DCCT trial (13). In the last decade, there has been increasing evidence of an association be-tween HbA1c levels and long-term morbidity and mor-tality rates in diabetic patients on dialysis. In a Japanese diabetic population receiving hemodialysis, predialysis HbA1c levels greater than 8% were associated with gre-ater mortality rates over a 7-year follow-up (14). In a large setting of US diabetic patients under hemodialy-sis, the non-anemic patients (hemoglobin > 11 g/dL) had increasing mortality risk for HbA1c levels greater than 6%, even after adjustment for many confounders (15). In a German multicentric study, the T2DM pa-tients on hemodialysis with greater levels of HbA1c at baseline had greater risk of cardiovascular and all-cause mortality in a 4-year follow-up period (16).Recently, the ADAG Study established the corre-spondence of HbA1c with average serum glucose level in a large population of normal individuals and patients with type 1 or type 2 diabetes (17). These data became reference for the correspondence of HbA1c and
aver-age glucose levels and are recommended for use in clin-ical practice, but that study excluded diabetic patients with chronic renal disease (CRD) (17).
Taking these indings into account, the aim of the present study was to investigate the most useful param-eters of glycemic control in patients with type 2 dia-betes under RRT (hemodialysis or PD) and compare them with those in diabetic individuals with normal renal function. For this study, we used the average of blood glucose values (AG: mean 10 values of fasting, preprandial and postprandial capillary glycemia) as the reference for glycemic control, and correlated it with HbA1c or compared it with postprandial glycemia and to random glycemia. Random glycemia is usually taken as a parameter of glycemic control in the majority of patients receiving dialysis.
MATERIALS AND METHODS
Patients
We identiied diabetic patients with normal renal func-tion and diabetic patients receiving hemodialysis or PD at Centro de Diálise e Transplante Renal – Hospital Santa Lucinda, Pontifícia Universidade Católica de São Paulo, Sorocaba, SP, Brazil. The inclusion criteria were age over 18 years; diagnosis of type 2 diabetes mellitus; and when on RRT, patients must have been on hemo-dialysis three times weekly or PD for at least three mon-ths, and must have had stable hemoglobin level and erythropoietin dose. The exclusion criteria were blood transfusion in the previous three months; diagnosis of an immune or hereditary hemolytic anemia, and inabi-lity or unwillingness to perform the required protocol measurements.
For hemodialysis adequacy, patients were dialyzed without glucose in the dialysis bath in accordance with
The National Kidney Foundation guidelines (US) also
called The Kidney Disease Outcome Quality
Improve-ment Initiative (18). Patients on PD performed four
Cop
yright
© ABE&M t
odos os dir
eit
os r
eser
vados
.
not change their regular doses of oral hypoglyce-miants or insulin. Patients with normal renal func-tion usually took sulphonilurea alone or sulphoni-lurea plus metformin and/or NPH insulin, whereas patients on dialysis were under NPH insulin therapy or only on diet (n = 3). Two out of 20 patients on hemodialysis received lower doses of NPH insulin on the day of hemodialysis (6 units less than on hemo-dialysis days). The mean daily dose of NPH insulin in hemodialysis patients was 23 units (range: 8 to 56 units), and in PD patients, 42 units (range: 12 to 72 units). After all the study procedures were explained, the participants read and signed an informed consent form, were clinically evaluated, and laboratorial para-meters were recorded.
Parameters of glycemic control
To determine capillary glycemia, patients were provided and instructed on how to use the Accu-Chek Advanta-ge capillary glucose meter (Roche Diagnostic GmbH, Mannheim, Germany) to obtain a total of 10 measure-ments during four consecutive days (2 days on and 2 days off hemodialysis). Capillary glucose measurements were done twice daily (fasting and preprandial), or three times daily (one fasting and 2 postprandial). The patients or one relative was trained to correctly manage the capillary glucose meter. The instructions were repe-ated several times by the study personnel. The patients had to prove their ability to perform these tests befo-re actually participating in the study. Capillary glucose measurements consisted of 10 predeined time points: four fasting, two preprandial, and four two-hour post-prandial assessments. A data collection form was provi-ded to each patient to record the test results. Glucose measurements were stored in the glucose meter’s me-mory so that conirmation of the patient-reported data could be assessed for accuracy. When the results of the written test and those recorded in the glucose meter memory differed, values stored in the meter memory were considered correct. On the inal day of capillary glucose determination, blood was collected to assess random plasma glucose, HbA1c, creatinine, urea, albu-min, hematocrit, and hemoglobin.
The study protocol was approved by the institutio-nal review board of the Faculdade de Ciências Médicas e da Saúde – Pontifícia Universidade Católica de São Paulo, and was conducted according to the Interna-tional Good Clinical Practice Harmonization and the Declaration of Helsinki.
Assays
HbA1c was assessed by immunoassay (Roche Diag-nostic GmbH – TQ HbA1c, Mannheim, Germany), as certiied by the National Glycohemoglobin Standar-dization Program (NGSP, USA), which has a normal range of 4% to 6%. Plasma glucose and other bioche-mical parameters were determined using an automated chemistry analyzer (LabMax 240, Labtest Diagnosti-ca, 33400-000 Belo Horizonte, Brazil). Hematology analysis was performed using the ABX Pentra ES 60 (Horiba ABX Ltda, 04795-100 São Paulo, Brazil).
Statistical analysis
For statistical analysis, IBM® SPSS® Statistics
Professio-nal (Somers, NY, USA) was used. All data are expressed as mean ± standard deviation. For comparisons between means and variance of different groups, ANOVA follo-wed by Tukey’s test was used. For correlation between different parameters Pearson’s correlation coeficient followed by regression analysis was used.
RESULTS
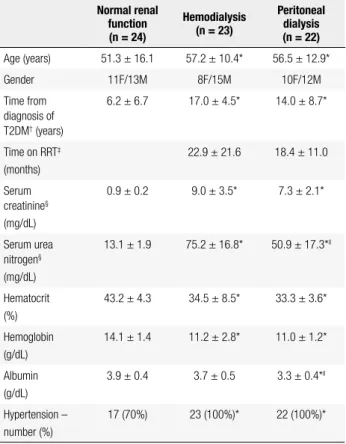
Demographic data and clinical characteristics of the diabetic patients with normal renal function, on hemo-dialysis, and on PD are presented in table 1. Patient age was similar among groups. Time from diagnosis of T2DM was longer in patients receiving hemodialysis or PD than diabetic patients with normal renal function. No differences were observed between PD and hemo-dialysis patients in the time from T2DM diagnosis, time on RRT, plasma creatinine, hematocrit level, or hemo-globin level. Serum albumin and pre-dialysis urea levels were greater in patients receiving hemodialysis compa-red with those on PD. All patients receiving dialysis and 66% of diabetic patients with normal renal function had hypertension.
Cop
yright
© ABE&M t
odos os dir
eit
os r
eser
vados
.
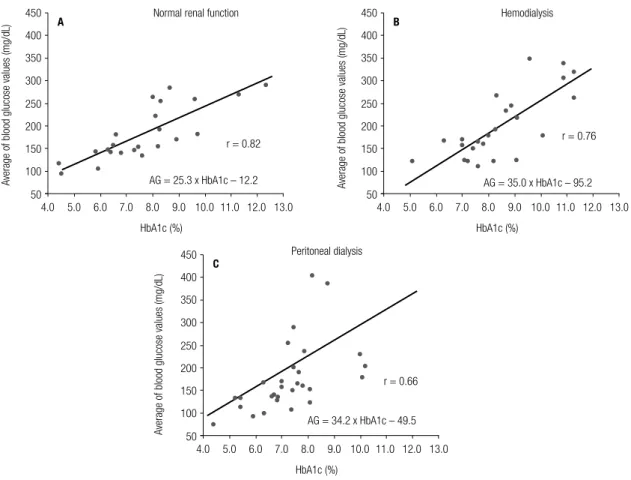
Table 3 depicts Pearson’s correlation coeficients between different parameters of glycemic control. All parameters were signiicantly correlated with each other (p < 0.01). As expected, HbA1c was correlated with AG in patients with normal renal function (r = 0.82) and hemodialysis patients (r = 0.76), but Person’s cor-relation index for PD patients was only fair (r = 0.66). Figure 1 shows the scatter plot of the individual data and the linear regression for the correlation of AG with HbA1c. In igure 1, graph A represents data from diabetic patients with normal renal function, graph B expresses data from hemodialysis patients and graph C shows the values from patients on PD. There was a good correlation between AG and HbA1c for patients with normal renal function and those on hemodialysis, but this correlation was lower in patients on PD due to the great variation of individual data.
Figure 2 compares the regression lines that rep-resent the correspondence of AG and HbA1c for the three groups of patients. As a reference, the regression line published in the ADAG Study, the most recom-mended in recent clinical practice, is included (17). The regression line for patients with normal renal func-tion was very close to that of the ADAG Study. On the other hand, the regression line was steeper for hemo-dialysis and PD patients, and that for PD was displaced upward. If we considered the most prevalent range of HbA1c values, that is, from 6% to 10%, the correspon-dence between AG and HbA1c was similar in patients with normal renal function compared with those on
he-Table 1. Clinical characteristics of patients with type 2 diabetes
Normal renal function (n = 24)
Hemodialysis (n = 23)
Peritoneal dialysis (n = 22)
Age (years) 51.3 ± 16.1 57.2 ± 10.4* 56.5 ± 12.9*
Gender 11F/13M 8F/15M 10F/12M
Time from diagnosis of T2DM† (years)
6.2 ± 6.7 17.0 ± 4.5* 14.0 ± 8.7*
Time on RRT‡
(months)
22.9 ± 21.6 18.4 ± 11.0
Serum creatinine§
(mg/dL)
0.9 ± 0.2 9.0 ± 3.5* 7.3 ± 2.1*
Serum urea nitrogen§
(mg/dL)
13.1 ± 1.9 75.2 ± 16.8* 50.9 ± 17.3*ll
Hematocrit (%)
43.2 ± 4.3 34.5 ± 8.5* 33.3 ± 3.6*
Hemoglobin (g/dL)
14.1 ± 1.4 11.2 ± 2.8* 11.0 ± 1.2*
Albumin (g/dL)
3.9 ± 0.4 3.7 ± 0.5 3.3 ± 0.4*ll
Hypertension – number (%)
17 (70%) 23 (100%)* 22 (100%)*
Values are mean ± SD; * = p < 0.01 versus normal renal function; † = type 2 diabetes mellitus;
‡ = renal replacement therapy; § = random values of serum creatinine and serum urea nitrogen
for normal renal function and peritoneal dialysis patients, and values pre-hemodialysis for the hemodialysis patients; ll = p < 0.01 hemodialysis versus peritoneal dialysis. Conversion factors
for units: serum creatinine in mg/dL to μmol/L, x88.4; serum urea nitrogen in mg/dL to mmol/L, x0.357; hemoglobin in g/dL to g/L, x10; albumin in g/dL to g/L, x10.
Table 2. Blood glucose in patients with type 2 diabetes
Normal renal function (n = 24)
Hemodialysis (n = 23)
Peritoneal dialysis (n = 22)
Fasting glycemia* (mg/dL)
163 ± 54 157 ± 55 165 ± 58
Preprandial glycemia†
(mg/dL)
178 ± 87 213 ± 111‡§ 218 ± 110‡§
Postprandial glycemia (mg/dL)
194 ± 75‡ 235 ± 87‡ 211 ± 86‡
Average of blood glucose valuesll
(mg/dL)
179 ± 61 195 ± 71 202 ± 74
Random glycemia¶
(mg/dL)
172 ± 79 208 ± 115 177 ± 91
HbA1c (%) 7,6 ± 2.0 8.5 ± 1.6# 7.1 ± 1.4
Values are mean ± SD; * = fasting glycemia determined before any meal and before the irst peritoneal dialysis exchange of the day; † = most patients in peritoneal dialysis used a
hypertonic (4.25% glucose) dialysis solution as the irst exchange in the morning; ‡ = p < 0.01
versus fasting glycemia; § = p < 0.01 versus normal renal function; ll = mean of 10 values
determined on 4 consecutive days; ¶ = for random glycemia, blood was collected any time of
the day; # = p < 0.01 hemodialysis versus peritoneal dialysis. Conversion factors for units:
glycemia in mg/dL to mmol/L, x0.05551.
Table 3. Pearson’s correlation coeficients between different glycemic control parameters
Normal renal function (n = 24)
Hemodialysis (n = 23)
Peritoneal dialysis (n = 22)
Fasting glycemia versus random glycemia
0.65 0.66 0.77
Fasting glycemia versus HbA1c
0.72 0.82 0.57
Preprandial glycemia versus HbA1c
0.72 0.72 0.71
Postprandial glycemia versus HbA1c
0.73 0.67 0.58
Average of blood glucose values versus HbA1c
0.82 0.76 0.66
Cop
yright
© ABE&M t
odos os dir
eit
os r
eser
vados
.
modialysis, whereas patients on PD would have greater AG for a given value of HbA1c. For instance, the same value of AG of 200mg/dL would result in different HbA1c level in patients on PD (nearly 7.5%) compared
with those on hemodialysis or with normal renal func-tion (about 8.5%). In other words, the same level of HbA1c (such as 9%) would correspond to a 30-mg/dL greater value of AG in patients on PD.
450
400
350
300
250
200
150
100
50
4.0 5.0 6.0 7.0 8.0 9.0 10.0 11.0 12.0 13.0
HbA1c (%)
r = 0.82
AG = 25.3 x HbA1c – 12.2
Normal renal function Hemodialysis
Peritoneal dialysis
A
A
verage of blood glucose values (mg/dL)
450
400
350
300
250
200
150
100
50
4.0 5.0 6.0 7.0 8.0 9.0 10.0 11.0 12.0 13.0
HbA1c (%)
r = 0.76
AG = 35.0 x HbA1c – 95.2
B
A
verage of blood glucose values (mg/dL)
450
400
350
300
250
200
150
100
50
4.0 5.0 6.0 7.0 8.0 9.0 10.0 11.0 12.0 13.0
HbA1c (%)
r = 0.66
AG = 34.2 x HbA1c – 49.5
C
A
verage of blood glucose values (mg/dL)
Figure 2. Regression lines for type 2 diabetic patients with normal renal function, on hemodialysis, and on peritoneal dialysis.
Best-itting regression lines for type 2 diabetic patients with normal renal function (NRF), on hemodialysis (HD) and on peritoneal dialysis (PD), as well as the regression line from the ADAG study (17). Inside the graph are the equations for the best-itting regression lines.
Figure 1. Correlation between average of blood glucose values and postprandial glycemia or HbA1c.
Graph A represents type 2 diabetic patients with normal renal function, Graph B represents type 2 diabetic patients on hemodialysis, and Graph C
represents type 2 diabetes patients on peritoneal dialysis. AG = average of blood glucose values, HbA1c = hemoglobin A1c. Pearson’s correlation indexes (r) are shown inside the graphs, as well as the equation for best-itting regression lines.
450
400
350
300
250
200
150
100
50
4.0 5.0 6.0 7.0 8.0 9.0 10.0 11.0 12.0 13.0 HbA1c (%)
NRF AG = 25.3 x HbA1c – 12.2 PD AG = 34.2 x HbA1c – 49.5 HD AG = 35.0 x HbA1c – 95.2
PD HD
NRF AG = 28.7 x HbA1c – 46.7
(ADAG Study)
A
Cop
yright
© ABE&M t
odos os dir
eit
os r
eser
vados
.
DISCUSSION
In this study, we observed that, despite similar values of fasting glycemia and AG in the three groups of dia-betic patients, those on RRT had greater preprandial glycemic levels. This inding may have resulted from the insulin resistance and glucose metabolism altera-tions characteristic of ESRD (19). Second, patients on hemodialysis had greater HbA1c compared with diabe-tics with normal renal function or those on PD (Table 2). This inding is in accordance with previous data in a similar group of diabetic patients on hemodialysis (13). Third, HbA1c correlated well with AG in all groups (Table 3 and Figure 1), but the regression line of AG
versus HbA1c in patients on PD was clearly displaced
upward, meaning greater AG values for a given level of HbA1c (Figure 2). Although the slopes of the regres-sion lines of AG versus HbA1c for hemodialysis and PD patients were slightly steeper than in the normal renal function patients and in the ADAG study (17), our data allow us to translate HbA1c into average glucose values (and vice versa) using the equations that represent the best-it regression line (Figures 1 and 2).
We believe that there were no important variations on blood glucose levels during the study days and the period that HbA1c represents, because we recom-mended to the participants not to change their usual food intake and medication. Furthermore, if there were any variation during the day on dialysis compared with days off, they could not be accounted for changes in capillary glucose, for AG or for HbA1c, because data collection was carried out during two hemodialysis days and two non-dialysis days, similarly to what happens on a regular dialysis period.
It is important to evaluate how these indings may impact the management of glycemic control and prog-nosis of type 2 diabetic patients on dialysis. In diabetic patients with preserved renal function, postprandial glucose is an independent risk factor and correlates bet-ter with morbidity and mortality than fasting glucose (20,21). However, we have no information on the rel-evance of postprandial glucose in the prognosis of dia-betic patients under dialysis. Although data on PD are scarce, HbA1c is a good marker of prognosis in patients receiving hemodialysis (11-12,14-16). Thus, besides HbA1c, postprandial glucose should be better explored in future studies of patients on dialysis, particularly in those on PD.
Considering the differences among the groups in the relationship between AG and HbA1c obtained in
our study, one should be cautious when comparing va-lues of HbA1c of diabetic patients on hemodialysis, on PD or with preserved renal function. Furthermore, we also must consider that for our patients on PD, values of AG versus HbA1c had the greatest dispersion and the lowest correlation index (r = 0.66) among the three groups of patients. Thus, this must be considered an important limitation of this study, as well as the number of patients in each group.
Finally, these new data must be conirmed in other settings of diabetic patients receiving dialysis. Also, fur-ther studies are required to explore whefur-ther HbA1c is a valuable marker of morbidity and mortality, and whether it may serve to advise interventions to improve glycemic control and, thus, the prognosis of diabetic patients undergoing RRT.
Acknowledgements: Accu-Chek Advantage capillary glucose me-ters were kindly provided by Roche Diagnostica, São Paulo, SP, Brazil.
Disclosure: no potential conlict of interest relevant to this article was reported.
REFERENCES
1. Atkins RC. The epidemiology of chronic kidney disease. Kidney Int. 2005;67(suppl 94):S14-8.
2. Stewart JH, McCredie MR, Williams SM, Jager KJ, Trpeski L, McDonald SP; ESRD Incidence Study Group. Trends in inciden-ce of treated end-stage renal disease, overall and by primary renal disease, in persons aged 20-64 years in Europe, Canada and the Asia-Paciic region, 1998-2002. Nephrology (Carlton). 2007;12:520-7.
3. Boddana P, Caskey F, Casula A, Ansell D. UK Renal Registry 11th Annual Report (December 2008): Chapter 14 UK Renal Registry and international comparisons. Nephron Clin Pract. 2009;111(su-ppl 1):c269-76.
4. US Renal Data System – USRDS 2010 Annual Data Report. Be-thesda, MA: National Institute of Health, National Institute of Dia-betes and Digestive and Kidney Diseases; 2010.
5. Goldwasser P, Mittman N, Antignani A, Burrell D, Michel MA, Collier J, et al. Predictors of mortality in hemodialysis patients. J Am Soc Nephrol. 1993;3:1613-22.
6. Chertow GM, Johansen KL, Lew N, Lazarus JM, Lowrie EG. Vinta-ge, nutritional status, and survival in hemodialysis patients. Kid-ney Int 2000;57:1176-81.
7. Cheung AK, Sarnak MJ, Yan G, Heyka RJ, Rocco MV, Teehan BP, et al. Atherosclerotic cardiovascular disease risks in chronic hemo-dialysis patients. Kidney Int. 2000;58:353-62.
8. Locatelli F, Pietro Pozzoni P, Del Vecchio L. Renal replacement the-rapy in patients with diabetes and end-stage renal disease. J Am Soc Nephrol. 2004;15(suppl 1):S25-9.
9. Shik J, Parfrey PS. The clinical epidemiology of cardiovascular disease in chronic kidney disease. Curr Opin Nephrol Hypertens. 2005;14:550-7.
Investiga-Cop
yright
© ABE&M t
odos os dir
eit
os r
eser
vados
.
tors. Electrocardiography and outcome in patients with diabetes mellitus on maintenance hemodialysis. Clin J Am Soc Nephrol. 2009;4:394-400.
11. Chung SH, Han DC, Noh H, Jeon JS, Kwon SH, Lindholm B, et al. Risk factors for mortality in diabetic peritoneal dialysis patients. Nephrol Dial Transplant. 2010;25:3742-8.
12. Carrero JJ, Mutsert R, Axelsson J, Dekkers OM, Jager KJ, Boes-choten EW, et al.; for the NECOSAD Study Group. Sex differences in the impact of diabetes on mortality in chronic dialysis patients. Nephrol Dial Transplant. 2011;26:270-6.
13. Joy MS, Cefalu WT, Hogan SL, Nachman PH. Long-term glycemic control measurements in diabetic patients receiving hemodialy-sis. Am J Kidney Dis. 2002;39:297-307.
14. Oomichi T, Emoto M, Tabata T, Morioka T, Tsujimoto Y, Tahara H, et al. Impact of glycemic control on survival of diabetic patients on chronic regular hemodialysis: a 7-year observational study. Dia-betes Care. 2006;29:1496-500.
15. Kalantar-Zadeh K, Kopple JD, Regidor DL, Jing J, Shinaberger CS, Aronovitz J, et al. A1C and survival in maintenance hemodialysis patients. Diabetes Care. 2007;30:1049-55.
16. Drechsler C, Krane V, Ritz E, März W, Wanner C. Glycemic control and cardiovascular events in diabetic hemodialysis patients. Cir-culation. 2009;120:2421-8.
17. Nathan DM, Kuenen J, Borg R, Zheng H, Schoenfeld D, Heine RJ. A1c-Derived Average Glucose Study Group: Translating the A1C assay into estimated average glucose values. Diabetes Care. 2008;31:1473-8. Erratum in: Diabetes Care 2009;32:207.
18. K/DOQI Clinical Practice Guidelines for Chronic Kidney Disease: evaluation, classiication, and stratiication evaluation of labora-tory measurements for clinical assessment of kidney disease. Am J Kidney Dis. 2002;39(suppl):S1-266.
19. DeFronzo RA, Alvestrand A, Smith D, Hendler R, Hendler E, Wahren J. Insulin resistance in uremia. J Clin Invest. 1981;67:563-8. 20. DECODE Study Group, the European Diabetes Epidemiology
Group. Glucose tolerance and cardiovascular mortality: compa-rison of fasting and 2-hour diagnostic criteria. Arch Intern Med. 2001;161:397-405.