Article
J. Braz. Chem. Soc., Vol. 25, No. 4, 697-703, 2014. Printed in Brazil - ©2014 Sociedade Brasileira de Química 0103 - 5053 $6.00+0.00
A
*e-mail: [email protected]
HPLC-FLD Method for Itraconazole Quantification in Poly Lactic-
co
-glycolic Acid
Nanoparticles, Plasma and Tissue
Karen R. Py-Daniel,a Osmindo R. Pires Junior,b Carlos M. Infante Cordova,c
Maria L. Fascineli,a Antonio C. Tedescod and Ricardo B. Azevedo*,a
aLaboratório de Nanobiotecnologia, GEM-IB; bLaboratório de Toxinologia, CFS-IB; cFaculdade de Ciências da Saúde, Universidade de Brasília, 70910-900 Brasília-DF, Brazil
dLaboratório de Fotobiologia e Fotomedicina, Departamento de Química, Faculdade de Filosofia Ciências e
Letras de Ribeirão Preto (FFCLRP), Universidade de São Paulo, 14040-901 Ribeirão Preto-SP, Brazil
Itraconazol, um antifúngico de amplo espectro, possui muitos efeitos colaterais e o uso de nanossistemas para a entrega de fármacos tem sido proposto como um método para otimizar a
farmacocinética da droga e reduzir os efeitos colaterais. Um procedimento de cromatografia líquida
de alta performance (HPLC) utilizando detecção fluorimétrica foi desenvolvido para a determinação de itraconazol em nanopartículas do copolímero de ácido láctico e glicólico, plasma e tecidos. A linearidade, limites de detecção e quantificação, recuperação, precisão, seletividade e estabilidade do método foram estabelecidas. O método desenvolvido foi testado na detecção e quantificação de itraconazol na biodistribuição de nanopartículas administrados intraperitonealmente em camundongos fêmeas Balb/C. Neste estudo foi desenvolvido um método analítico de HPLC com detecção fluorimétrica para quantificação de itraconazole em nanopartículas poliméricas, tecidos e plasma, sendo ele sensível, de baixo custo, viável para uso de rotina e com potencial para aplicação na biodistribuição e estudos farmacocinéticos de itraconazole em nanossistemas.
Itraconazole, a broad-spectrum anti-fungal, has many side effects, and nanosystems for drug delivery have been proposed as a method to optimize the drug’s pharmacokinetics and reduce side effects. An high performance liquid chromatography (HPLC) procedure using fluorometric
detection was developed for determination of itraconazole in polymeric poly(lactic-co-glycolic
acid) nanoparticles, plasma and tissue. Linearity, limits of detection and quantification, recovery, precision, selectivity and stability were established. The developed method was tested in itraconazole detection and quantification of biodistribution of nanoparticles administered intraperitoneally to Balb/C female mice. This study developed an analytical method for HPLC with fluorometric detection for quantification of itraconazole in polymeric nanoparticles, tissue and plasma, which is sensitive, low cost, viable for routine usage and with potential for application in itraconazole biodistribution and pharmacokinetics studies.
Keywords: HPLC, itraconazole, nanoparticles, biodistribution
Introduction
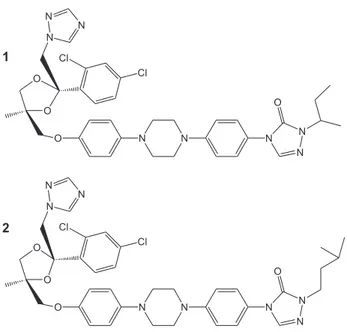
Itraconazole (ITZ) (Figure 1) is a classical member of the triazole class that exhibits a broad-spectrum anti-fungal activity.1 Diverse side effects, such as nausea, vomiting, abdominal pain, diarrhea, headaches and mild alopecia, commonly identified with ITZ treatment of fungal infections,2,3 can be avoided using nanoparticulated drug delivery systems.4 Nanosystems can protect drugs from
Various methods for the quantification of ITZ have been developed, with spectrophotometry,10-13 thin layer
chromatography,14,15 and high performance liquid
chromatography (HPLC) from diverse matrixes.16-19 Liquid chromatographic methods are the most extensively used techniques in pharmaceutical analysis, and HPLC has gained increased attention for being the most versatile technique. It can be used for separation, identification and quantification of active substances, excipients and impurities.20 Despite its worldwide usage and applications in ITZ quantification in diverse nanosystems,21,22 no method has yet been developed and validated for determination of ITZ of PLGA nanoparticles in biological matrices.
Green analytical chemistry principles should always be considered in the development of new analytical methods. For liquid chromatographic separations, solvent replacement, use of less toxic or less persistent solvents, allied to a reduction in solvent usage in all the steps of the procedure, are the typical ways used to cut down on products that are harmful to human health or the environment.23
The aim of this study was to develop an environmentally friendly bioanalytical method for HPLC with fluorometric detection for quantification of ITZ in nanoparticles, plasma, lung, liver, kidney and spleen tissue, and that was sensitive, low-cost, viable for routine usage and with potential for application in ITZ biodistribution and pharmacokinetics studies.
The method was validated based on FDA guidelines forvalidation of bioanalytical methods.24 The assay performance was evaluated through the determination of selectivity, limits of detection (LOD), limits of quantification
(LOQ), the linearity over the tested concentration range, recovery, precision and stability.
Experimental
Chemicals
Itraconazole (R051211-98% purity), dimethyl sulfoxide (DMSO-HPLC grade) and zinc sulfate heptahydrate (ACS reagent) were purchased from Sigma (Sigma-Aldrich Co., St. Louis, MO, USA) and itraconazole internal standard (R51012) was purchased from Fitzgerald (Fitzgerald Industries International Inc., Concord, MA, USA). Acetonitrile (ACN), methanol (MeOH) and tetrahydrofuran (THF) used for the HPLC analyses were HPLC grade and were purchased from Mallinckrodt (Mallinckrodt Inc., Hazelwood, MO, USA). Trifluoracetic acid (TFA), ethylenediaminetetraacetic acid (EDTA) and sodium cloride (NaCl) were purchased from VETEC (Duque de Caxias, RJ, Brazil) and were ACS grade. Milli-Q water was obtained from Barnstead EASYpure II Thermo Scientific (San Jose, CA, USA) and was used to prepare aqueous solutions. DMSA-PLGA nanoparticles loaded with itraconazole were synthesized and characterized as described by Cunha-Azevedo et al..25
Instrumentation
The chromatographic equipment (Shimadzu-Prominence)
comprised of on-line degasser (Model DGU 20A5),
solvent delivery module (Model LC-20AT), autosampler (Model SIL-20AHT), column oven (Model CTO-20A), fluorescence detector (Model RF-10AXL) and system controller CBM-20A. Reverse-phase C18 column ACE AQ (25 × 0.4 cm, 5 µm particle size) (ACE, Aberdeen, Scotland) with a pre-column (25 × 0.4 cm, 5 µm particle size) (ACE, Aberdeen, Scotland) were used. Samples were stored in ultra-low temperature freezer, Model MDF-U3086S (Sanyo), and centrifuged in microcentrifuge model Mikro 220R (Hettich).
Chromatographic condition
The mobile phase was obtained from the mixture of 0.12% TFA in Milli-Q water (pump A) and 0.12% TFA in acetonitrile (pump B) at 50:50 (v/v) proportion, rendering an isocratic phase. Fluorimetric measurements were carried out in a 12 µL flow cell at 260 and 365 nm excitation and emission wavelength respectively. The injection volume was 10 µL and the flow-rate during the assays was 1 mL min–1 at working pressure of 80 kgf cm–2. Analysis was performed with column temperature of 30 °C. Software LCsolution
(Shimadzu, Tokyo, Japan) was used for data processing and identification of chromatographic parameters.
Extraction and quantification of ITZ in nanoparticles
ITZ in PLGA-DMSA nanoparticles was extracted with DMSO as described by Cunha-Azevedo et al..25 MeOH, ACN and THF were also used to compare ITZ extraction capacity of different solvents. Briefly, aliquots of nanoparticles containing ITZ were dissolved in the cited solvents (1:1000), sonicated for 10 min, filtered through 0.22 µm nylon filters (Millex GN, Millipore, Darmstadt, Germany) and injected in HPLC system. Filter interference in ITZ quantification was determined by comparisons with non-filtered centrifuged solutions. Effect in quantification of ITZ and IS when diluted in mobile phase or in MeOH was also determined.
Animals
Female BALB/c mice weighing 20-22 g were purchased from the University of Campinas, São Paulo, Brazil. The mice were housed in polypropylene cages under controlled conditions of luminosity and were provided with food and water ad libitum. All animal procedures performed in this study were approved by the Animal Care and Use Committee of the University of Brasília (UnB), Brasília, Federal District, Brazil.
Biological sample preparation
Plasma, liver, spleen, lung and kidney samples from drug-free animals were used as blanks for method validation. Blood from anesthetized mice (ketamine 60 mg kg–1 and xylazine 7.5 mg kg–1) was collected by heart puncture and transferred to tubes containing EDTA. After 30 min at room temperature, tubes were centrifuged for 5 min at 5000 g, aliquoted and stored at –80 ºC for future analyses.
For quantification of ITZ in plasma, 0.2 mL of plasma were transferred to microcentrifuge tubes with 20 µl of 20% ZnSO4 (for protein precipitation),26 mixed in a vortex for 1 min and extracted with 0.7 mL of MeOH. The samples were shaken on a vortex for 3 min and centrifuged for 5 min at 6000 g. Supernatant was transferred to a 2 mL volumetric flask and 1 mL of MeOH was added to samples to repeat extraction. Samples were vortexed for 3 min followed by centrifugation for 5 min at 24000 g and transference to volumetric flask.
For ITZ quantification in tissue, organs were removed, washed with cold 0.9% NaCl solution, blotted on filter paper, weighed and stored at –80 ºC for future analyses.
Whole organs and 400 mg of liver were homogenized in 1.5 mL microcentrifuge tubes with hand pestles and extracted using the same process as described for plasma. Previous to extraction of plasma and tissue, 40 µL of itraconazole internal standard (20 µg mL–1) was added to the tubes.
Method development
A stock solution (1 mg mL–1) of ITZ was prepared in tetrahydrofuran and itraconazole internal standard (IS) (1 mg mL–1) was prepared in MeOH. Solutions of ITZ (500, 100, 25, 5 and 1 µg mL–1) and IS (20 µg mL–1) were prepared as standards and quality control samples (QC) for quantification in biological matrices. Calibration curve standards were prepared in mobile phase and in biological matrices. Curves in mobile phase were constructed using ITZ concentrations of 10, 5, 2, 1, 0.5, 0.2, 0.1, 0.05, 0.02 and 0.01 µg mL–1 and in biological matrices using ITZ concentrations of 10, 2, 0.5, 0.1 and 0.02 µg mL–1 with internal standard concentration of 0.4 µg mL–1. Calibration curve in mobile phase was obtained by the serial dilution method from the stock solution and areas of ITZ observed in chromatograms were used. Calibration curves in biological matrices were obtained by doping tissue with cited concentrations of ITZ and IS, followed by extraction as described in topic Biological sample preparation. The ratio of areas of ITZ and IS obtained on chromatograms was used to construct calibration curves with internal standard in biological matrix.
The bioanalytical method was also used to determine ITZ concentrations in plasma, liver, kidney, spleen and lung samples of healthy mice (n = 3). The mice received 300 µL of single intraperitoneal doses of 200 µg mL–1 ITZ-loaded, PLGA nanoparticles. Blood samples (approximately 800 µL) were collected by heart puncture in VACUETTE® K3E K3EDTA tubes (Greiner Bio-One) one hour after administration. Samples were centrifuged after 30 min for 5 min at 500 g, and the plasma was then frozen at −80 °C until analysis. After euthanasia of the mice, tissues of interest were excised, washed with cold saline and blotted on filter paper. The quantification of ITZ in biological samples was undertaken within 72 h post-collection of samples using the method described above.
Method validation
Linearity
Limit of detection and limit of quantification
The limit of detection was determined as 3.3*(standard deviation)/(slope of analytical curve) and limit of quantification as 10*(standard deviation)/(slope of analytical curve),27 considering the standard deviation of the lowest concentration of ITZ used in the calibration curve.
Recovery
Recovery of the method (%) was obtained by comparison of observed values of ITZ/IS in processed matrix with standard solutions of ITZ/IS containing the same added concentration. Intra-day recovery was determined by analysis of three replicates of low, medium and high (0.01, 1 and 10 µg mL–1, respectively) concentrations of ITZ and IS (0.4 µg mL–1) in liver, lung, spleen, kidney and plasma in the same day. Inter-day recovery was determined by the analysis of different processed samples on three different days.
Precision
Intra-day precision was determined by analysis of three replicates of low, medium and high (0.01, 1 and 10 µg mL–1, respectively) concentrations of ITZ and IS (0.4 µg mL–1) in liver, lung, spleen, kidney and plasma in the same day. Inter-day precision was determined by the analysis of different processed samples on three different days. The precision of the method was expressed as relative standard deviation (RSD) of ITZ/IS areas in processed matrices in the cited concentrations.
Selectivity
Selectivity of the method was investigated by processing and analyzing blank plasma and tissues from three animals with and without addition of ITZ/IS. Selectivity is established as absence of peaks in blank samples at the same retention time of ITZ and IS.
Stability
Stability of ITZ and IS in methanol was determined by daily quantification of solutions maintained at –20 °C and at 25 °C with low, medium and high concentrations of ITZ (0.01, 1 and 10 µg mL–1, respectively) and IS (0.4 µg mL–1).
Samples were verified for seven days, maximum time proposed for sample processing.
Results and Discussion
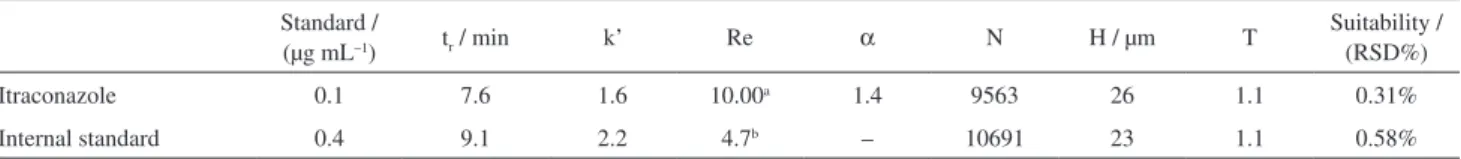
Optimum mobile phase composition was determined by analysis of ITZ and IS peaks in water/solvent gradients in a standard C-18 column. The composition, acetonitrile/ water with trifluoracetic acid with gradient elution, allowed modulation of mobile phase strength and optimization of retention time of ITZ and IS. The retention time of ITZ and IS was decisive for definition of isocratic mobile phase used throughout experiments: acetonitrile: water (50:50, with 0.12% TFA). Injection volume was defined by optimum signal range/sensitivity factors and was established in 10 µL, since this volume resulted in a wide range of concentrations detectable in the same method (10-0.01 µg mL–1) with high sensitivity. Injection volumes of 5 and 20 µL were also tested with solutions with concentrations ranging from 10-0.01 µg mL–1, but the dynamic range was always smaller. Using the developed analytical method, ITZ retention time was 7.6 min and internal standard retention time was 9.1 min with 11 min for each run. With the conditions obtained, the typical chromatographic parameters: retention time, retention factor (k’), separation factor (α), resolution (Re), number of plates (N), height of theoretical plates (H) and suitability were calculated for each compound (Table 1). Suitability was determined as relative standard deviation of areas of peaks of consecutive injections of ITS and IS stock solution (0.1 µg mL–1 and 0.4 µg mL–1, respectively) (n = 6). The parameters values demonstrated: 1) adequate interaction with the column, 2) ideal separation of peaks of itraconazole and internal standard, and 3) symmetric shape of the peaks obtained.
Solvent extraction of ITZ from nanoparticles and tissue aimed at low cost-high output extraction procedure. The efficiency of different solvents in ITZ extraction from nanoparticles was determined by comparison with DMSO extraction, because DMSO is the solvent used for the drug encapsulation efficiency calculation in nanoparticle
characterization.24 MeOH, DMSO and THF rendered
the same extraction capacity, and for practical reasons,
Table 1. Chromatographic parameters of itraconazole and internal standard in described method
Standard /
(µg mL–1) tr / min k’ Re α N H / µm T
Suitability / (RSD%)
Itraconazole 0.1 7.6 1.6 10.00a 1.4 9563 26 1.1 0.31%
Internal standard 0.4 9.1 2.2 4.7b – 10691 23 1.1 0.58%
MeOH was used throughout all extraction procedures. No difference was observed in the ITZ fluorescent signal when the drug was dissolved in mobile phase or MeOH, rendering unnecessary solvent substitution from extracted ITZ.
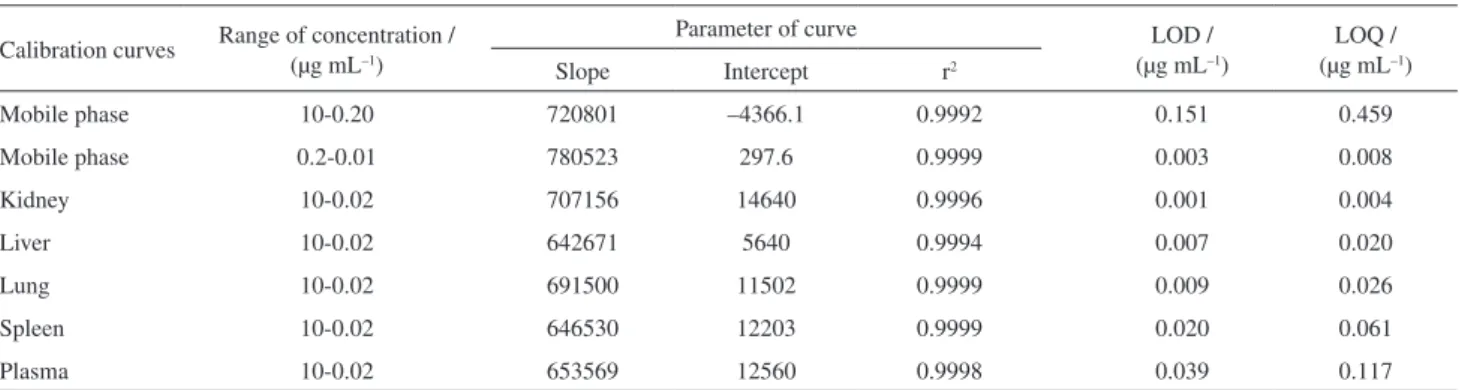
Calibration curves in mobile phase and in biological matrices resulted in the values observed in Table 2. For construction of each point of the calibration curve in mobile phase triplicates of peak areas were used. Over the range of 10-0.02 µg mL–1 for biological matrices and 10-0.2 and 0.2-0.001 µg mL–1 in mobile phase, the linear fit was used and correlation coefficients were obtained (Table 2).
The limits of detection (LOD) and quantification (LOQ) were determined (Table 2), and results are in agreement with the targeted application of the method: the value of the limit of detection obtained demonstrates sensitivity that permits dosage of ITZ in probable low concentrations throughout biodistribution studies. Calibration curves for ITZ and IS ratio in biological matrix can be seen in Table 3.
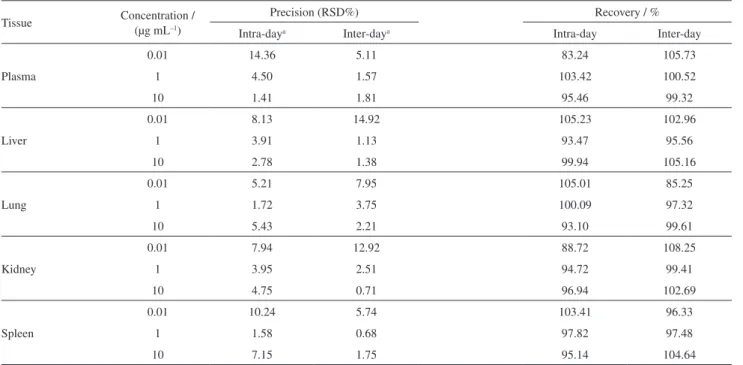
Recovery and precision of extractions from doped plasma and tissue may be observed in Table 4. The recovery varied between 83 and 106%. The extraction procedure was the same for all tested matrices and demonstrated satisfactory and rapid extraction of ITZ. It is worth noting that only one solvent was used without purification or substitution, rendering a low-cost and fast method. The precision observed for the analytical procedure developed expresses a close
agreement between a series of measurements obtained from multiple sampling of a homogeneous sample. Intra-day and inter-day precision and recovery of plasma, lung, kidney, spleen and liver are presented in Table 4.
No interfering peaks were found at the retention time of the analyzed drug and internal standard, demonstrating the selectivity of the method (Figure 2). The chromatographic runs were completed at 11 min, a short run when compared to most methods for ITZ quantification in HPLC,28 resulting in less waste, in accordance with the principles of green analytical chemistry.23
Stability of quality control samples maintained as 25 °C demonstrated by the seventh day degradation of 23%, 15% and 17% of low, medium and high concentration while all samples kept at –20 °C varied in less than 0.05% of initial concentration. This result demonstrates that processed samples can be stored for one week without degradation of ITZ.
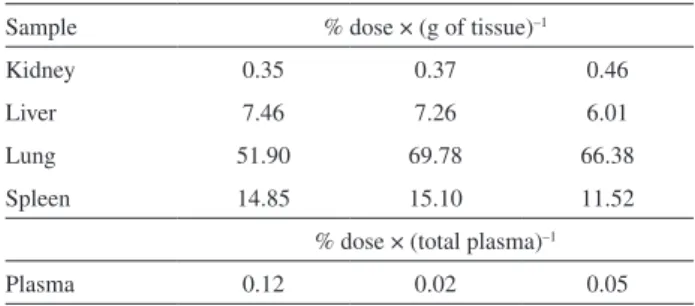
Application of bioanalytical method
The bioanalytical method was tested for ITZ quantification in organs and plasma after administration of nanoparticles in mice. One hour after intraperitoneal injection, organs were extracted and processed as described earlier. The result of percentage of injected drug per gram
Table 2. Linear regression parameter and limits of detection and quantification for itraconazole (area vs. concentration)
Calibration curves Range of concentration / (µg mL–1)
Parameter of curve LOD /
(µg mL–1)
LOQ / (µg mL–1)
Slope Intercept r2
Mobile phase 10-0.20 720801 –4366.1 0.9992 0.151 0.459
Mobile phase 0.2-0.01 780523 297.6 0.9999 0.003 0.008
Kidney 10-0.02 707156 14640 0.9996 0.001 0.004
Liver 10-0.02 642671 5640 0.9994 0.007 0.020
Lung 10-0.02 691500 11502 0.9999 0.009 0.026
Spleen 10-0.02 646530 12203 0.9999 0.020 0.061
Plasma 10-0.02 653569 12560 0.9998 0.039 0.117
r2: determination coefficient; LOD: limit of detection; LOQ: limit of quantification.
Table 3. Linear regression parameters for itraconazole/itraconazole internal standard (ITZ/IS) curve
Range of concentration / (µg mL–1) Parameter of curve
Slope Intercept Determination coefficient (r2)
Kidney 10-0.02 3.7119 0.0849 0.9996
Liver 10-0.02 4.2484 –0.1666 0.9998
Lung 10-0.02 3.288 0.1317 0.9999
Spleen 10-0.02 3.5952 –0.0384 0.9999
of tissue is shown in Table 5. The method demonstrated fast and effective capacity of ITZ dosing in tissue and plasma after nanoparticle administration and calibration curves in matrixes with the ITZ/IS reason rendered a method that normalizes losses in extraction procedures.
The proposed method was described and validated for ITZ extraction for biodistribution/pharmacokinetic
studies, but serves as a model for future development of methods for extraction of lipophilic drugs from nanosystems and tissue. The cited advantages of HPLC for routine detection and quantification more than justify its usage in such studies, as well as the growing demand for validated, efficient and rapid methods for application in nanotechnology.
Table 4. Precision and recovery of intra-day and inter-day itraconazole extraction in biological matrices (n = 3)
Tissue Concentration / (µg mL–1)
Precision (RSD%) Recovery / %
Intra-daya Inter-daya Intra-day Inter-day
Plasma
0.01 14.36 5.11 83.24 105.73
1 4.50 1.57 103.42 100.52
10 1.41 1.81 95.46 99.32
Liver
0.01 8.13 14.92 105.23 102.96
1 3.91 1.13 93.47 95.56
10 2.78 1.38 99.94 105.16
Lung
0.01 5.21 7.95 105.01 85.25
1 1.72 3.75 100.09 97.32
10 5.43 2.21 93.10 99.61
Kidney
0.01 7.94 12.92 88.72 108.25
1 3.95 2.51 94.72 99.41
10 4.75 0.71 96.94 102.69
Spleen
0.01 10.24 5.74 103.41 96.33
1 1.58 0.68 97.82 97.48
10 7.15 1.75 95.14 104.64
RSD = Relative standard deviation; aintra-day = day 1; inter-day = days 1, 2 and 3.
Conclusion
An HPLC method with isocratic elution and fluorescent detection was developed for ITZ determination in polymeric nanoparticles and biological samples. Only one solvent was used in a liquid-liquid extraction with no need of drying or concentrating of samples, resulting in time gained in process. The method was simple, low-cost and environmentally friendly, using only MeOH for extraction of itraconazole in samples. Low limits of detection and quantification were observed. The validated method permits the identification and quantification of ITZ in virtually all staged of nanoparticle preparation with an adequate precision and recovery. Preliminary biodistribution of itraconazole showed good applicability for biodistribution and pharmacokinetic studies.
Acknowledgments
We thank the Brazilian agencies National Council for Technological and Scientific Development (CNPq), National Institute of Science and Technology-Nanotechnology (INCT-Nanobiotecnologia) of Ministry of Science, Technology and Innovation (MCT/CNPq), and the Federal District Agency for Fomenting Research (FAP-DF) for financial support.
References
1. Prentice, A. G.; Glasmacher, A.; J. Antimicrob. Chemother. 2005, 56, i17.
2. Abe, S.; Ochi, H.; Takahashi, Y.; Ishijima, S. A.; Osumi, M.; Yamaguchi, H.; J. Infect. Chemother. 2000, 6, 35.
3. Catalán, M.; Montejo, J. C.; Rev. Iberoam. Micol. 2006, 23, 39. 4. Khandare, J. J.; Jayant, S.; Singh, A.; Chandna, P.; Wang, Y.;
Vorsa, N.; Minko, T.; Bioconjugate Chem. 2006, 17, 1464. 5. Moghimi, S.; Hunter, A. C.; Andresen, T. L.; Annu. Rev.
Pharmacol. Toxicol. 2012, 52, 481.
6. Allen, T. M.; Cullis, P. R.; Science 2004, 303, 1818.
7. Davis, M. E.; Chen, Z.; Shin, D. M.; Nat. Rev. Drug Discovery 2008, 7, 771.
8. Hassan, H. A.; Al-Marzouqi, A. H.; Jobe, B.; Hamza, A. A.; Ramadan, G. A.; J. Pharm. Biomed. Anal. 2007, 45, 243. 9. Contado, C.; Vighi, E.; Dalpiaz, A.; Leo, E.; Anal. Bioanal.
Chem. 2013, 405, 703.
10. Alsarra, I. A.; Alanazi, F. K.; Ahmed, S. M.; Bosela, A. A.; Alhamed, S. S.; Mowafy, H. A.; Neau, S. H.; Arch. Pharmacal Res. 2010, 33, 1009.
11. Murthy, T.; Reddy, M.; Srinivasa Rao, Y.; Sankar, D.; Indian J. Pharm. Sci. 2002, 64, 491.
12. El-Enany, N.; El-Sherbiny, D.; Belal, F.; J. Chin. Chem. Soc. 2007, 54, 375.
13. Nakarani, M.; Misra, A.; Patel, J.; Vaghani, S.; DARU J. Pharm. Sci. 2010, 18.
14. Mirza, M. A.; Talegaonkar, S.; Iqbal, Z.; J. Liq. Chromatogr. Related Technol. 2012, 35, 1459.
15. Parikh, S.; Dave, J.; Patel, C.; Ramalingan, B.; Pharm. Methods 2011, 2, 88.
16. Uno, T.; Shimizu, M.; Sugawara, K.; Tateishi, T.; Ther. Drug Monit. 2006, 28, 526.
17. Redmann, S.; Charles, B. G.; Biomed. Chromatogr. 2006, 20, 343.
18. Darouiche, R. O.; Setoodeh, A.; Anaissie, E. J.; Antimicrob. Agents Chemother. 1995, 39, 757.
19. Gordien, J.-B.; Pigneux, A.; Vigouroux, S.; Tabrizi, R.; Accoceberry, I.; Bernadou, J.-M.; Rouault, A.; Saux, M.-C.; Breilh, D.; J. Pharm. Biomed. Anal. 2009, 50, 932.
20. Ekiert, R. J.; Krzek, J.; Talik, P.; Talanta 2010, 82, 1090. 21. Badawi, A. A.; El-Nabarawi, M. A.; El-Setouhy, D. A.;
Alsammit, S. A.; AAPS PharmSciTech. 2011, 12, 811. 22. Prakobvaitayakit, M.; Nimmannit, U.; AAPS PharmSciTech.
2003, 4, 565.
23. Armenta, S.; Garrigues, S.; De la Guardia, M.; TRAC-Trend. Anal. Chem. 2008, 27, 497.
24. US Food and Drug Administration, Guidance for Industry, Bioanalytical Method Validation, Centre for Drug Evaluation
and Research (CDER). Rockville, USA. 2001.
25. Cunha-Azevedo, E. P.; Silva, J. R.; Martins, O. P.; Siqueira-Moura, M. P.; Bocca, A. L.; Felipe, M. S. S.; Tedesco, A. C.; Azevedo, R. B.; J. Nanosci. Nanotechnol. 2011, 11, 2308. 26. Ng, L. L.; J. Chromatogr. A. 1983, 257, 345.
27. Miller, J. C.; Miller, J. N.; Statistics for Analytical Chemistry, 2nd ed.;Wiley: New York, USA, 1988.
28. Yao, M.; Srinivas, N. R.; Biomed. Chromatogr. 2009, 23, 677.
Submitted on: October 2, 2013
Published online: January 31, 2014
FAPESP has sponsored the publication of this article. Table 5. Determination of ITZ in organs and plasma after 1 h of
intraperitoneal administration of nanoparticles containing ITZ (n = 3)
Sample % dose × (g of tissue)–1
Kidney 0.35 0.37 0.46
Liver 7.46 7.26 6.01
Lung 51.90 69.78 66.38
Spleen 14.85 15.10 11.52
% dose × (total plasma)–1