387 Correlation among yield stability parameters in maize
Genetics and Molecular Biology, 23, 2, 387-393 (2000)
INTRODUCTION
Cultivar interaction with environmental factors (lo-cation, year of planting, soil type, level of technology used, etc.) is an important consideration for plant breeders. The effects that cultivars and environments exert on cultivar-environment interactions (G x E) are statistically nonad-ditive, indicating that differences in yields among culti-vars will depend on the environment (Yue et al., 1997). Consequently, selection procedures based on the mean yield of cultivars in a given environment are less efficient (Hopkins et al., 1995).
There are two possible strategies for developing cul-tivars with low G x E interaction. The first is subdivision or stratification of a heterogeneous area into smaller, more homogeneous sub-regions, with breeding programs aimed at developing cultivars for specific sub-regions. However, even with this refinement, the level of interaction can re-main high because breeding area does not reduce the inter-action of cultivars with locations on years (Eberhart and Russell, 1966; Tai, 1971). This approach is also costly. Allard and Bradshaw (1964) classified the environmental variations for which stratification is not effective as unpredictable.
The second strategy for reducing G x E interaction involves selecting cultivars with a better stability across a wide range of environments in order to better predict be-havior (Eberhart and Russell, 1966; Tai, 1971). Various methods use the G x E interaction to facilitate genotype characterization and as a selection index together with the mean yield of the cultivars. Parametric models based on simple linear regression analysis are among the most widely used to identify superior cultivars, and include the method proposed by Eberhart and Russell (1966), which interprets the variance of the regression deviations (σdi2)
as a measure of cultivar stability and the linear regression coefficient (βi) as a measure of the cultivar adaptability. Although regression is widely applied, the fact that the mean of all the cultivars in each environment is taken as a measure of the environmental index and is used as an in-dependent variable in the regression may be considered a serious limitation to this procedure because there cannot be independence among the variables, especially when the number of cultivars is less than 15 (Becker and Léon, 1988; Crossa, 1990). Furthermore, the variation of the estimates of the regression coefficient is usually so small that classification of the genotype for stability and
adapt-Yield stability in maize (
Zea mays
L.) and correlations among the parameters
of the Eberhart and Russell, Lin and Binns and Huehn models
Carlos Alberto Scapim1, Valter Rodrigues Oliveira2, Alessandro de Lucca e Braccini1, Cosme Damião Cruz3, Carlos Alberto de Bastos Andrade1 and Maria Celeste Gonçalves Vidigal1
Abstract
Assessment of the stability and adaptability of a genotype to different environments is useful for recommending cultivars for known
conditions of cultivation and should be a requirement in breeding programs. Twenty maize (Zea mays L.) cultivars were tested at eight
locations in Minas Gerais by the National Center for Maize and Sorghum Research (CNPMS) of the Brazilian Enterprise for Agricultural Research (EMBRAPA) for two years. The experiments involved a randomized complete block design in which three procedures were used to analyze cultivar stability and adaptability. The level of association among the parameters obtained by the three methods was assessed using Spearman’s rank correlation. Hybrids ‘DINA 170’, ‘G-96C’, ‘C 505’, ‘DINA 70’ and ‘C 435’ had a mean yield greater
than 6,000 kg/ha. Eberhart and Russell’s regression coefficient (βi) was negative and correlated significantly (P < 0.01) with Lin and Binn’s
superiority index (Pi), indicating that the most responsive cultivars tended to have smaller Pi. Pi did not correlate with Huehn’s nonparametric
measurements Si(2) and Si(3) nor with Eberhart and Russell’s σdi2 (P ≥ 0.05), but correlated positively with Si(1) (P < 0.05), indicating that
superior genotypes (with lower Pi) could also be stable, a finding not commonly reported in the literature. The stability parameters, Si(1), Si(2),
Si(3) and σdi2, correlated positively among each other (P < 0.01), indicating that the stability estimates of the Huehn’s nonparametric model did
not add important information to those obtained by the Eberhart and Russell’s method. Estimates from the Huehn’s method, however, showed that stability estimates from nonparametric models are useful alternatives to parametric models. ‘DINA 170’, which had a greater general mean, was characterized as a cultivar adapted to favorable environments, and was among the most productive in the different environments assessed. The cultivar ‘G-96C’ showed medium adaptation to all environments (ideal cultivar) and had good stability. Cultivars ‘C 505’ and ‘C435’ were alternatives for ‘G-96C’. ‘DINA 70’ showed good adaptability but had low stability.
1Departamento de Agronomia, Universidade Estadual de Maringá, Av. Colombo, 5790, 87020-900 Maringá, PR, Brasil. Send correspondence to C.A.S. E-mail: [email protected]
ability is difficult (Farias et al., 1995). Yue et al. (1997) considered the need to satisfy the assumptions of normal-ity, the homogeneity of variance, and the additivity or lin-earity of the effects of genotypes and environment as fur-ther limitations of parametric models.
Lin and Binns’ (1988) methodology, although infre-quently quoted in the literature, is a good alternative for the assessment of cultivar performance in the G x E inter-actions. Their method does not have limitations inherent to the use of regression. It characterizes the genotypes with a single parameter (Pi) by associating stability and productivity, and defines a superior cultivar as one with a performance near the maximum in various environments (Lin and Binns, 1988; Helgadóttir and Kristjánsdóttir, 1991). This definition of superiority is similar to the breeder’s objective, since a superior cultivar should be among the most productive in the greatest possible num-ber of environments (Farias et al., 1995, 1997).
Stability estimates from nonparametric models based on the relative classification of the cultivars in a given set of environments do not require previous assumptions and are good alternatives for parametric measurements (Nassar and Hühn, 1987; Hühn and Nassar, 1989). Huehn (1990a) proposed as stability measures the nonparametric statis-tics Si(1), S
i(2), and Si(3) based on the classification of the genotypes in each environment, and defined stable culti-vars as those whose position in relation to the others re-mained unaltered in the set of environments assessed. In addition to not having the limitations of the parametric models, this model reduces or avoids the biases caused by points outside the adjusted regression equation (outli-ers), and the stability parameters are easy to use and inter-pret. The addition or removal of one or a few genotypes probably causes less variation in estimates of the stability parameters than in parametric models. Finally, this ap-proach can be used for other purposes, such as selection in competition and breeding programs, when the order of genotype classification is of fundamental importance (Huehn, 1990a).
The level of association among the adaptability or sta-bility estimates of different models is indicative of whether one or more estimates should be obtained for reliable pre-dictions of cultivar behavior, and also helps the breeder to choose the best adjusted and most informative stability parameter(s) to fit his concept of stability (Duarte and Zimmermann, 1995).
The objective of our study was to determine pheno-typic stability of grain yield in maize cultivars and evaluate the level of association among the stability parameters de-rived using the models suggested by Eberhart and Russell (1966), Lin and Binns (1988) and Huehn (1990a).
MATERIAL AND METHODS
Data from a group of experiments from the Early Genotypes National Maize Experiment carried out in 1989/
90 and 1990/91 were used. Twenty maize (Zea mays L.) cultivars with an early maturity and normal height from research companies and public and private universities were assessed. The National Maize Experiment is coordinated by the National Center for Maize and Sorghum Research (CNPMS) of the Brazilian Enterprise for Agricultural Re-search (EMBRAPA).
Five of the 10 experiments were carried out in 1989/ 90 and the remaining five were carried out in 1990/91. In 1989/90, the experiments were conducted in Rio Paranaíba, Uberlândia, Sete Lagoas, Capinópolis, and Viçosa and, in 1990/91, they were conducted in Uberlândia, Capinópolis (at two locations in the same county), Coimbra, and Lavras. All locations are counties in the State of Minas Gerais, Bra-zil. Since the experiments were carried out in different places and under different soil and climatic conditions, each was considered as a distinct environment. Each trial was laid out in a randomized complete-block design with three replications. The characteristic assessed was grain yield (kg/ ha) standardized for 14.5% moisture.
The statistical procedures adopted for the adaptabil-ity and stabiladaptabil-ity analysis of the genotypes were those pro-posed by Eberhart and Russell (1966), Lin and Binns (1988), and Huehn (1990a).
As described by Eberhart and Russell (1966), the be-havior of the cultivars was assessed by the model Yij = m + βiIj + δij + εij, where Yij = observation of the i-th (i = 1, 2, ..., g) cultivar in the j-th (j = 1, 2, ...n) environment, m = gen-eral mean, βi =regression coefficient, Ij = environmental index obtained by the difference among the mean of each
environment and the general mean ( Σ Ij = 0), δij = the
regression deviation of the i-th cultivar in the j-th environ-ment and εij = effect of the mean experimental error.
The Lin and Binns’ (1988) model uses the Pi
param-eters obtained by the expression Pi = Σ (Xij - Mj)2 /2n to
assess the superiority of the cultivar, where Pi= superior-ity index of the i-th cultivar, Xij = yield of the i-th cultivar in the j-th environment, Mj = maximum response obtained among all the cultivars in the j-th environment, and n = number of environments. This expression was further
par-titioned into Pi = [n(Xi.- M)2 + Σ (Xij - Mj + M)2]/2n,
where Xi = Σ Xij/n and M = Σ Mj/n, Xi = yield mean of
the i-th cultivar in the n environments and M = mean of the maximum response in the n environments. According to Lin and Binns (1988), the first part of the Piexpression quantifies the genetic deviation and the second quantifies the G x E interaction.
Huehn (1990a) proposed the use of the parameters Si(1), Si(2), and Si(3) as stability measurements based on the
n
j = l
n
j = l
n
j = l n
j = l
n
389 Correlation among yield stability parameters in maize
classification of genotypes in various environments, where
Si(1)Σ rij - rij’/[n(n - 1)/2], Si(2) = Σ (rij - ri.)2 /n-1 and Si(3) =
Σrij - ri./ri., where Si(1), = mean of the absolute differences
among the classification of the i-th cultivar in the n envi-ronments, rij = classification of the i-th cultivar in the j-th environment, n = number of environments, Si(2) = variance of the classifications of the i-th cultivar in the environments,
ri. = Σ rij/n and Si(3) = sum of absolute deviations in yield
units of each classification relative to the mean classification. The significance tests for the Si(1) and Si(2) statistics were determined as suggested by Nassar and Hühn (1987) and Hühn and Nassar (1989). The χ2 values associated with
Si(1) and Si(2) were obtained by the expression χ2s = Σ Zi(m),
where m = 1, 2, Zi(m) = [Si(m) - E (Sim)]2 / V(Sim), E(Si(m)) = expected value (= mean) of Si(m), and V(Si(m)) = Si(m) vari-ance. The significance test for the null hypothesis that all the genotypes are equally stable was done using a chi-square distribution with g degrees of freedom. The stability pa-rameters were compared using Spearman’s rank correlation (Steel and Torrie, 1980).
RESULTS AND DISCUSSION
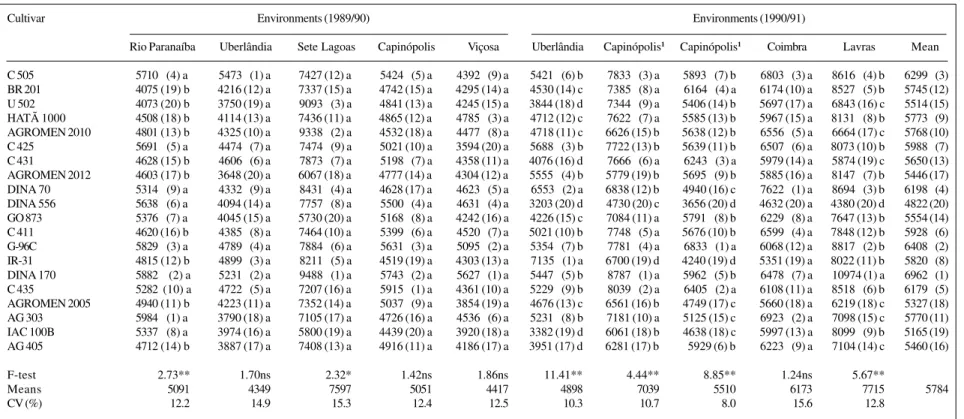
The differences in the classification of the cultivars in the various environments indicated the presence of G x E interactions (Table I). This was confirmed by the sig-nificant effect of the cultivar x environment interaction in the joint analysis of variance (Table II) and indicated the need to assess the response of the cultivars to environ-mental variation. Taking the mean general yield as the first parameter for the assessment of the cultivars, ‘DINA 170’, ‘G-96C’, ‘C 505’, ‘DINA 70’ and ‘C 435’ gave the best yields, with mean yields greater than 6,000 kg/ha (Table I). ‘DINA 170’ had the lowest yield variation among the environments.
The adaptability and stability of a genotype are use-ful parameters for recommending cultivars for known cropping conditions. Eberhart and Russell (1966) proposed an assessment of cultivar response to environmental changes using a linear regression coefficient and the vari-ance of the regression deviations. The cultivars are grouped according to the size of their regression coefficients, less than, equal to, or greater than one and according to the size of the variance of the regression deviations (equal to or different from zero). Those cultivars with regression coefficients greater than one would be more adapted to favorable growth conditions, those with regression coef-ficients less than one would be adapted to unfavorable environmental conditions, and those with regression
co-efficients equal to one would have an average adaptation to all environments. Thus, genotypes with variances in re-gression deviations equal to zero would have highly pre-dictable behavior, whereas with a regression deviation greater than zero, they would have low predictability be-cause of the environmental stimulus.
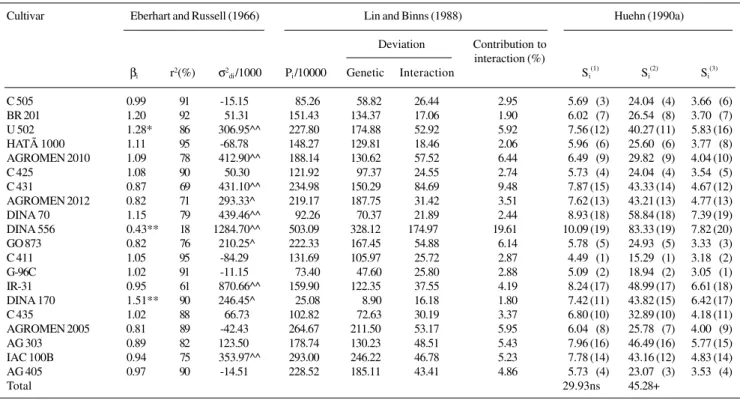
‘DINA 170’ had a high general mean (Table I) and a regression coefficient greater than one (Table III), thus characterizing it as a cultivar adapted to environments with a high level of technology. In environments with a low level of technology, the yield potential of this cultivar would not be fully exploited. The level of variance in the stabil-ity regression deviations was greater than zero, indicating low predictability. This fact, however, should not adversely influence decisions regarding the use of this genotype be-cause it had a high determination coefficient (r2 = 90%). The ‘G-96C’, ‘C 505’, ‘C 435’ cultivars had regres-sion coefficients equal to one, regresregres-sion deviation vari-ances equal to zero and high determination coefficients (Table III). Therefore, they had an average capacity for ad-aptation to all the environments and were highly predict-able. According to Eberhart and Russell (1966), they could be considered ideal cultivars, since they maintained good performance in environments with low yields. This con-cept of an ideal genotype has been questioned by Hilde-brand (1990), who suggests that breeders should find geno-types capable of maintaining good yield in unfavorable en-vironments or those excellent in variable enen-vironments, rather than select materials with a regression coefficient equal to one. Hildebrand (1990) stated that these geno-types may yield less in unfavorable environments than those with low regression coefficients, and less in favorable en-vironments than those with higher regression coefficients. The cultivar ‘DINA 70’ had a regression coefficient equal to one, but had a regression deviation variance greater than zero and a relatively low determination coefficient (r2 = 79.0%). In view of its low predictability, care should be taken when recommending it for general adaptability.
Genotypes with high mean yields and a specific adapt-ability to unfavorable environments were not identified by the regression analysis (Tables I and III). The only cultivar with a regression coefficient lower than one was ‘DINA 556’, which had the lowest mean yield, the greatest vari-ance in the regression deviations and the lowest determina-tion coefficient of all the cultivars assessed. Cultivars ‘C 425’, ‘C 411’, ‘BR 201’, ‘HATÃ 1000’ and ‘AG 303’ had yields similar to or above the general mean of the experi-ments (5,748 kg/ha) and had adaptability and stability pa-rameters defined as ideal by Eberhart and Russell (1966).
In an alternative procedure for assessing the behav-ior of genotypes in genotype-environment interactions pro-posed by Lin and Binns (1988), the superiority of a geno-type may be assessed by the superiority index (Pi), defi-ned as the deviation of the i-th cultivar relative to the geno-type with maximum performance in each environment. The superior genotype would be that one with the lowest Pi g
i = l n
j = l j < j’ n
j = l
n
Scapim
et al.
Table I - Mean yield (kg/ha) of maize cultivars evaluated in five environments for two seasons.
Cultivar Environments (1989/90) Environments (1990/91)
Rio Paranaíba Uberlândia Sete Lagoas Capinópolis Viçosa Uberlândia Capinópolis1 Capinópolis1 Coimbra Lavras Mean
C 505 57100 (4) a 54730 (1) a 7427 (12) a 54240 (5) a 43920 (9) a 54210 (6) b 78330 (3) a 58930 (7) b 68030 (3) a 86160 (4) b 62990 (3) BR 201 4075 (19) b 4216 (12) a 7337 (15) a 4742 (15) a 4295 (14) a 4530 (14) c 73850 (8) a 61640 (4) a 6174 (10) a 85270 (5) b 5745 (12) U 502 4073 (20) b 3750 (19) a 90930 (3) a 4841 (13) a 4245 (15) a 3844 (18) d 73440 (9) a 5406 (14) b 5697 (17) a 6843 (16) c 5514 (15) HATÃ 1000 4508 (18) b 4114 (13) a 7436 (11) a 4865 (12) a 47850 (3) a 4712 (12) c 76220 (7) a 5585 (13) b 5967 (15) a 81310 (8) b 57730 (9) AGROMEN 2010 4801 (13) b 4325 (10) a 93380 (2) a 4532 (18) a 44770 (8) a 4718 (11) c 6626 (15) b 5638 (12) b 65560 (5) a 6664 (17) c 5768 (10) C 425 56910 (5) a 44740 (7) a 74740 (9) a 5021 (10) a 3594 (20) a 56880 (3) b 7722 (13) b 5639 (11) b 65070 (6) a 8073 (10) b 59880 (7) C 431 4628 (15) b 46060 (6) a 78730 (7) a 51980 (7) a 4358 (11) a 4076 (16) d 76660 (6) a 62430 (3) a 5979 (14) a 5874 (19) c 5650 (13) AGROMEN 2012 4603 (17) b 3648 (20) a 6067 (18) a 4777 (14) a 4304 (12) a 55550 (4) b 5779 (19) b 56950 (9) b 5885 (16) a 81470 (7) b 5446 (17) DINA 70 53140 (9) a 43320 (9) a 84310 (4) a 4628 (17) a 46230 (5) a 65530 (2) a 6838 (12) b 4940 (16) c 76220 (1) a 86940 (3) b 61980 (4) DINA 556 56380 (6) a 4094 (14) a 77570 (8) a 55000 (4) a 46310 (4) a 3203 (20) d 4730 (20) c 3656 (20) d 4632 (20) a 4380 (20) d 4822 (20) GO 873 53760 (7) a 4045 (15) a 5730 (20) a 51680 (8) a 4242 (16) a 4226 (15) c 7084 (11) a 57910 (8) b 62290 (8) a 7647 (13) b 5554 (14) C 411 4620 (16) b 43850 (8) a 7464 (10) a 53990 (6) a 45200 (7) a 5021 (10) b 77480 (5) a 5676 (10) b 65990 (4) a 7848 (12) b 59280 (6) G-96C 58290 (3) a 47890 (4) a 78840 (6) a 56310 (3) a 50950 (2) a 53540 (7) b 77810 (4) a 68330 (1) a 6068 (12) a 88170 (2) b 64080 (2) IR-31 4815 (12) b 48990 (3) a 82110 (5) a 4519 (19) a 4303 (13) a 71350 (1) a 6700 (19) d 4240 (19) d 5351 (19) a 8022 (11) b 58200 (8) DINA 170 58820 (2) a 52310 (2) a 94880 (1) a 57430 (2) a 56270 (1) a 54470 (5) b 87870 (1) a 59620 (5) b 64780 (7) a 10974 (1) a 69620 (1) C 435 5282 (10) a 47220 (5) a 7207 (16) a 59150 (1) a 4361 (10) a 52290 (9) b 80390 (2) a 64050 (2) a 6108 (11) a 85180 (6) b 61790 (5) AGROMEN 2005 4940 (11) b 4223 (11) a 7352 (14) a 50370 (9) a 3854 (19) a 4676 (13) c 6561 (16) b 4749 (17) c 5660 (18) a 6219 (18) c 5327 (18) AG 303 59840 (1) a 3790 (18) a 7105 (17) a 4726 (16) a 45360 (6) a 52310 (8) b 7181 (10) a 5125 (15) c 69230 (2) a 7098 (15) c 5770 (11) IAC 100B 53370 (8) a 3974 (16) a 5800 (19) a 4439 (20) a 3920 (18) a 3382 (19) d 6061 (18) b 4638 (18) c 5997 (13) a 80990 (9) b 5165 (19) AG 405 4712 (14) b 3887 (17) a 7408 (13) a 4916 (11) a 4186 (17) a 3951 (17) d 6281 (17) b 5929 (6) b 62230 (9) a 7104 (14) c 5460 (16)
F-test 2.73** 1.70ns 2.32* 1.42ns 1.86ns 11.41** 4.44** 8.85** 1.24ns 5.67**
Means 5091 4349 7597 5051 4417 4898 7039 5510 6173 7715 5784
CV (%) 12.2 14.9 15.3 12.4 12.5 10.3 10.7 8.0 15.6 12.8
391 Correlation among yield stability parameters in maize
action (Table III). However, this genotype contributed only 1.8% of the total value of the interaction (Table III).
Huehn (1990a) proposed that the stability of a culti-var in response to environmental changes could be assessed based on its classification in various environments. Three nonparametric stability measurements (Si(1),Si(2) and Si(3)) were proposed such that the i-th cultivar could be consid-ered stable in n environments under analysis if its classifi-cations were similar in all environments, i.e., it would cor-respond to maximum stability. For a cultivar with maximum stability Si(1) =Si(2) = Si(3) = 0.
The χs2 value for the Si(1) statistic is a measure of the homogeneity of the Si(1) values of all the cultivars. It was not significant (P = 7.1%), indicating that there was no dif-ference in stability among the genotypes (Table III). The cultivar with the lowest Si(1) value was ‘C 411’, followed by ‘G-96C’, ‘C 505’, ‘C 425’ and ‘AG 405’; all except ‘AG 405’ had mean yields above the general mean for the ex-periment (Tables I and III). On the other hand, ‘DINA 170’, ‘DINA 70’, ‘C435’ and ‘IR-31’ had mean yields above the general mean but relatively high Si(1) values and, conse-quently, showed low stability.
The genotypes Si(2) were significantly different (P < 0.01). The cultivar stability evaluated by these Si(2) values coincided with the classification of the cultivar stability given by Si(1) (Table III). The stability of genotypes based on the estimates of Si(3) was similar to that estimated by the two previous measures (Table III). According to Huehn
Table III - Estimates of the stability parameters proposed by Eberhart and Russell (1966),
Lin and Binns (1988) and Huehn (1990a) for grain yield (kg/ha) of 20 maize hybrids evaluated in 10 environments. Cultivar Eberhart and Russell (1966) Lin and Binns (1988) Huehn (1990a)
Deviation Contribution to interaction (%)
βi r2(%) σ2di /1000 Pi /10000 Genetic Interaction Si(1) Si(2) Si(3)
C 505 0.99 91 -15.15 85.26 58.82 26.44 2.95 5.699 (3) 24.049 (4) 3.669 (6) BR 201 1.20 92 51.31 151.43 134.37 17.06 1.90 6.029 (7) 26.549 (8) 3.709 (7) U 502 1.28* 86 306.95^^ 227.80 174.88 52.92 5.92 7.56 (12) 40.27 (11) 5.83 (16) HATÃ 1000 1.11 95 -68.78 148.27 129.81 18.46 2.06 5.969 (6) 25.609 (6) 3.779 (8) AGROMEN 2010 1.09 78 412.90^^ 188.14 130.62 57.52 6.44 6.499 (9) 29.829 (9) 4.04 (10) C 425 1.08 90 50.30 121.92 97.37 24.55 2.74 5.739 (4) 24.049 (4) 3.549 (5) C 431 0.87 69 431.10^^ 234.98 150.29 84.69 9.48 7.87 (15) 43.33 (14) 4.67 (12) AGROMEN 2012 0.82 71 293.33^ 219.17 187.75 31.42 3.51 7.62 (13) 43.21 (13) 4.77 (13) DINA 70 1.15 79 439.46^^ 92.26 70.37 21.89 2.44 8.93 (18) 58.84 (18) 7.39 (19) DINA 556 0.43** 18 1284.70^^ 503.09 328.12 174.97 19.61 10.09 (19) 83.33 (19) 7.82 (20) GO 873 0.82 76 210.25^ 222.33 167.45 54.88 6.14 5.789 (5) 24.939 (5) 3.339 (3) C 411 1.05 95 -84.29 131.69 105.97 25.72 2.87 4.499 (1) 15.299 (1) 3.189 (2) G-96C 1.02 91 -11.15 73.40 47.60 25.80 2.88 5.099 (2) 18.949 (2) 3.059 (1) IR-31 0.95 61 870.66^^ 159.90 122.35 37.55 4.19 8.24 (17) 48.99 (17) 6.61 (18) DINA 170 1.51** 90 246.45^ 25.08 8.90 16.18 1.80 7.42 (11) 43.82 (15) 6.42 (17)
C 435 1.02 88 66.73 102.82 72.63 30.19 3.37 6.80 (10) 32.89 (10) 4.18 (11)
AGROMEN 2005 0.81 89 -42.43 264.67 211.50 53.17 5.95 6.049 (8) 25.789 (7) 4.009 (9) AG 303 0.89 82 123.50 178.74 130.23 48.51 5.43 7.96 (16) 46.49 (16) 5.77 (15) IAC 100B 0.94 75 353.97^^ 293.00 246.22 46.78 5.23 7.78 (14) 43.16 (12) 4.83 (14) AG 405 0.97 90 -14.51 228.52 185.11 43.41 4.86 5.739 (4) 23.079 (3) 3.539 (4)
Total 29.93ns 45.28+
*P < 0.05, **P < 0.01 (t-test) for the hypothesis βi = 1. +P < 0.01 and ns, nonsignificant (χ2 test). ^P < 0.05, ^^P < 0.01 (F-test).
value, that one which remained among the most produc-tive in a given set of environments. The estimate of Pi could be partitioned into a portion attributed to genetic deviation, that is, the sum of the squares of the genotypes. This would be troublesome to breeder’s since it does not necessarily imply alteration in the genotypes ranking or in the portion attributed to genotype x environment interac-tions. In this case, the cultivars of greatest interest would be those with the lowest Pi values, most of which would be attributed to genetic deviation (Lin and Binns, 1988).
Cultivars ‘DINA 170’, ‘G-96C’, ‘C 505’, ‘DINA 70’ and ‘C 435’ had the greatest mean general yields (Table I) and the lowest Pi values, with its most part attributed to the genetic component. The exception was ‘DINA 170’, which had the greatest part of Pi , that was attributed to the
inter-Table II - Joint analysis of variance for the yield (kg/ha) of 20 maize cultivars in 10 environments. Source of variation Degrees of freedom Mean squares
Block/environments 20 1,643,639
Cultivars 19 6,764,587 **
Environments 9 96,971,800 **
Cultivars x environments 171 1,455,783 **
Error 380 577,628
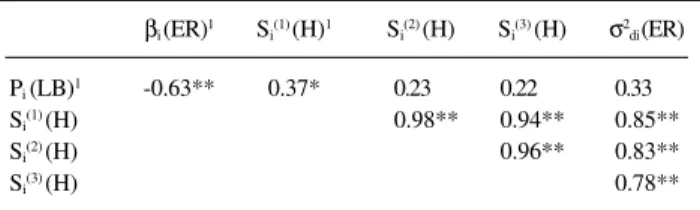
Table IV - Spearman’s coefficients of linear correlation among parameters of the Eberhart and Russell’s (1966), Lin and Binns’ (1988), and Huehn’s
(1990a) models, for 20 maize hybrids evaluated in 10 environments.
βi (ER)1 Si(1) (H)1 Si(2) (H) Si(3) (H) σ2di (ER) Pi (LB)1 -0.63** 0.37* 0.23 0.22 0.33
Si(1) (H) 0.98** 0.94** 0.85**
Si(2) (H) 0.96** 0.83**
Si(3) (H) 0.78**
1ER = Eberhart and Russell; LB = Lin and Binns; H = Huehn. *P < 0.05, **P < 0.01.
(1990a,b) Si(1) and Si(2) are functions only of the stability measurements whereas the numerical value of Si(3) is deter-mined by yield and stability simultaneously.
The correlation among the adaptability or stability es-timates of the different models may indicate if more esti-mates should be obtained to improve confidence in the pre-diction of cultivar behavior. The Spearman’s rank correla-tion between the βi regression coefficient and the superi-ority index (Pi) was negative and significant (P < 0.01). This estimate indicates that more responsive genotypes tended to have lower Pivalues. Similar results were obtained in barley (Hordeum vulgare) (Lin and Binns, 1988), timothy (Phleum pratense L.) (Helgadóttir and Kristjánsdóttir, 1991) and cotton (Gossypium hirsutum) (Farias et al., 1995, 1997). Pi did not correlate with Si(2), Si(3) or σ2di, but Pi did correlate positively and significantly with Si(1) (Table IV). The presence of a correlation between Pi and Si(1) seems to indicate that superior genotypes (with lower Pi) could also be stable (with lower Si(1)). According to Huehn (1990a,b), Si(1) is a function only of the stability measurement using corrected data, i.e., if one wants to estimate the phe-notypic stability independent from yield level effects.
The stability parameters Si(1), Si(2), Si(3) and σ2di were positively and significantly correlated (P < 0.01), indicat-ing that the four measures were similar in classifyindicat-ing the genotypes according to their stability under different en-vironmental conditions (Table IV). Consequently, only one of these parameters would be sufficient to select the stable genotypes in a breeding program. Similar results were ob-tained in the common bean (Phaseolus vulgaris L.) (Miranda 1993), corn (Zea mays L.) (Veronesi, 1995), soy-bean (Glycine max (L.) Merrill) (Yue et al., 1997) and popcorn (Zea mays L.) (Vendrúscolo, 1998). Parameters Si(1) and Si(2) are measurements of stability alone. They are strongly intercorrelated with each other even in the case of using the uncorrected yield data xij. But, if one adjusts the xij by the genotype effects, i.e., using the corrected values xij*, then all the nonparametric measures Si(1) - Si(3) are nearly perfectly correlated among each other - includ-ing Si(3) (Huehn, 1990a).
The nonparametric stability measurements Si(1), Si(2) and Si(3) do not require any assumptions about the normal-ity of the distribution and variance homogenenormal-ity. The
in-teraction concepts of the classification they represent are strongly related to that of selection in which breeders are interested, i.e., whether the best cultivar in one environ-ment is also the best in other environenviron-ments. In conclu-sion, nonparametric stability measurements seem to be useful alternatives to parametric measurements (Yue et al., 1997), although they do not supply information about genotype adaptability. Miranda (1993) suggested that Si(1) and Si(2) are easier to apply and interpret than Si(3).
ACKNOWLEDGMENTS
The authors thank Embrapa - CNPMS for allowing the use of the experimental data.
RESUMO
O conhecimento sobre a estabilidade e adaptabilidade de comportamento de genótipos contém informações muito úteis para a recomendação de cultivares para condições de cultivo
conhe-cidas a priori, de modo que a avaliação da resposta dos genótipos
às variações ambientais deve ser etapa obrigatória em programas de melhoramento. Para caracterizar 20 cultivares de milho, foram realizados dez ensaios (oito localidades do Estado de Minas Gerais, em dois anos) no delineamento de blocos ao acaso, pelo Centro Nacional de Pesquisa de Milho e Sorgo (CNPMS) da Empresa Brasileira de Pesquisa Agropecuária (Embrapa). Três procedimentos estatísticos foram adotados para a análise da estabilidade e adaptabilidade dos cultivares e avaliou-se o grau de associação entre os parâmetros dos três métodos por meio da correlação classificatória de Spearman. ‘DINA 170’, ‘G-96C’, ‘C 505’, ‘DINA 70’ e ‘C 435’ destacaram-se com produtividades
médias superiores a 6.000 kg/ha. O coeficiente de regressão (βi)
de Eberhart e Russell foi negativo e significativamente
correla-cionado (P < 0,01) com o índice de superioridade (Pi) de Lin e
Binns, indicando que os cultivares mais responsivos tenderam a
apresentar menor Pi. Pi não se correlacionou com as medidas
não-paramétricas Si(2) e S
i(3) de Huehn e com σ2di de Eberhart e
Russell (P ≥ 0,05), mas correlacionou-se positiva e
signi-ficativamente com Si(1) (P < 0,05), indicando que genótipos mais
produtivos e responsivos (com menor Pi) também podem ser
está-veis (com menor Si(1)), embora tal situação não seja comumente
observada na literatura. Huehn afirma que as estimativas de Si(1)
indicam somente estabilidade, quando os dados são corrigidos.
Os parâmetros de estabilidade Si(1), Si(2), Si(3) e σ2di
correla-cionaram-se positiva e significativamente entre si (P < 0,01),
393 Correlation among yield stability parameters in maize
REFERENCES
Allard, R.W. and Bradshaw, A.D. (1964). Implications of genotype-envi-ronmental interactions in applied plant breeding. Crop Sci.4: 503-507.
Becker, H.C. and Léon, J. (1988).Stability analysis in plant breeding.
Plant Breed. 101: 1-23.
Crossa, J. (1990). Statistical analysis of multilocation trials. Adv. Agron.44: 55-85.
Duarte, J.B. and Zimmermann, M.J. (1995). Correlation among yield sta-bility parameters in common bean. Crop Sci.35: 905-912.
Eberhart, S.A. and Russell, W.A. (1966). Stability parameters for compar-ing varieties. Crop Sci.6: 36-40.
Farias, F.J.C., Ramalho, M.A.P., Carvalho, L.P., Moreira, J.A.N. and Costa, J.N. (1995). Comparação entre métodos de avaliação de estabilidade para rendimento em cultivares de algodoeiro herbáceo. Ciênc. Prát. 19: 252-255.
Farias, F.J.C., Ramalho, M.A.P., Carvalho, L.P., Moreira, J.A.N. and Costa, J.N. (1997). Parâmetros de estabilidade propostos por Lin e Binns (1988) comparados com o método da regressão. Pesqui. Agropecu. Bras.32: 407-414.
Helgadóttir, A. and Kristjánsdóttir, T. (1991). Simple approach to the analy-sis of G x E interactions in a multilocational spaced plant trial with timothy. Euphytica54: 65-73.
Hildebrand, P.E. (1990). Modified stability analysis and on-farm research to breed specific adaptability for ecological diversity. In: Genotype-By-Environment Interaction and Plant Breeding (Kang, M.S., ed.). Louisana State, Baton Rouge, pp. 169-180.
Hopkins, A.A., Vogel, K.P., Moore, K.J., Johnson, K.D. and Carlson, I.T.
(1995). Genotype effects and genotype by environment interactions for traits of elite switchgrass populations. Crop Sci.35: 125-132.
Huehn, M. (1990a). Nonparametric measures of phenotypic stability. Part
1: Theory. Euphytica47: 189-194.
Huehn, M. (1990b). Nonparametric measures of phenotypic stability. Part 2: Applications. Euphytica 47: 195-201.
Hühn, M. and Nassar, R. (1989). On tests of significance for nonparametric measures of phenotypic stability. Biometrics45: 997-1000.
Lin, C.S. and Binns, M.R. (1988). A superiority measure of cultivar perfor-mance for cultivar x location data. Can. J. Plant Sci.68: 193-198.
Miranda, G.V. (1993). Comparação de avaliação da adaptabilidade e estabi-lidade de comportamento de cultivares: exemplo com a cultura do feijão (Phaseolus vulgaris L.). Master’s thesis, UFV, Viçosa, MG.
Nassar, R. and Hühn, M. (1987). Studies on estimation of phenotypic stability: tests of significance for nonparametric measures of pheno-typic stability. Biometrics43: 45-53.
Scott, A.J. and Knott, M. (1974). A cluster analysis methods for grouping means in the analysis of variance. Biometrics30: 507-512.
Steel, R.G.D. and Torrie, J.H. (1980). Principles and Procedures of Statis-tics. McGraw Hill Book Company, New York.
Tai, G.C.C. (1971). Genotypic stability analysis and its application to po-tato regional trials. Crop Sci.11: 184-190.
Vendrúsculo, E. (1998). Comparação de métodos e avaliação da adapta-bilidade e estaadapta-bilidade de genótipos de milho pipoca na região Centro-Sul do Brasil. Master’s thesis, UEM, Maringá, PR.
Veronesi, J.A. (1995). Comparação de métodos e avaliação da adapta-bilidade e estaadapta-bilidade de comportamento de vinte genótipos de milho (Zea mays L.) em dez ambientes do Estado de Minas Gerais. Master’s thesis, UFV, Viçosa, MG.
Yue, G.L., Roozeboom, K.L., Schapaugh Jr., W.T. and Liang, G.H. (1997). Evaluation of soybean cultivars using parametric and nonparametric stability estimates.Plant Breed.116: 271-275.