AMTD
8, 9075–9103, 20151941–2013 AOD time series at IZO from
ANNs
R. D. García et al.
Title Page
Abstract Introduction
Conclusions References
Tables Figures
◭ ◮
◭ ◮
Back Close
Full Screen / Esc
Printer-friendly Version Interactive Discussion
Discussion
P
a
per
|
Discussion
P
a
per
|
Discussion
P
a
per
|
Discussion
P
a
per
|
Atmos. Meas. Tech. Discuss., 8, 9075–9103, 2015 www.atmos-meas-tech-discuss.net/8/9075/2015/ doi:10.5194/amtd-8-9075-2015
© Author(s) 2015. CC Attribution 3.0 License.
This discussion paper is/has been under review for the journal Atmospheric Measurement Techniques (AMT). Please refer to the corresponding final paper in AMT if available.
Aerosol optical depth retrievals at the
Izaña Atmospheric Observatory from 1941
to 2013 by using artificial neural networks
R. D. García1,2, O. E. García1, E. Cuevas1, V. E. Cachorro2, A. Barreto1,3,
C. Guirado-Fuentes1,2, N. Kouremeti4, J. J. Bustos1, P. M. Romero-Campos1, and
A. M. de Frutos2
1
Izaña Atmospheric Research Center (IARC), Agencia Estatal de Meteorología (AEMET), Santa Cruz de Tenerife, Spain
2
Atmospheric Optics Group, Valladolid University, Valladolid, Spain
3
Cimel Electronique, Paris, France
4
Physikalish-Meteorologisches Observatorium, Davos, World Radiation Center, Davos, Switzerland
Received: 23 July 2015 – Accepted: 7 August 2015 – Published: 3 September 2015
Correspondence to: R. D. García ([email protected])
AMTD
8, 9075–9103, 20151941–2013 AOD time series at IZO from
ANNs
R. D. García et al.
Title Page
Abstract Introduction
Conclusions References
Tables Figures
◭ ◮
◭ ◮
Back Close
Full Screen / Esc
Printer-friendly Version Interactive Discussion
Discussion
P
a
per
|
Discussion
P
a
per
|
Discussion
P
a
per
|
Discussion
P
a
per
|
Abstract
This paper presents the reconstruction of the 73 year time series of the aerosol optical depth (AOD) at 500 nm at the subtropical high-mountain Izaña Atmospheric Obser-vatory (IZO) located in Tenerife (Canary Islands, Spain). For this purpose, we have combined AOD estimates from artificial neural networks (ANNs) from 1941 to 2001
5
and AOD measurements directly obtained with a Precision Filter Radiometer (PFR) between 2003 and 2013. The analysis is limited to summer months (July–August– September), when the largest aerosol load is observed at IZO (Saharan mineral dust particles). The ANN AOD time series has been comprehensively validated against co-incident AOD measurements performed with a solar spectrometer Mark-I (1984–2009)
10
and AERONET (AErosol RObotic NETwork) CIMEL photometers (2004–2009) at IZO,
obtaining a rather good agreement on a daily basis: Pearson coefficient,R, of 0.97
be-tween AERONET and ANN AOD, and 0.93 bebe-tween Mark-I and ANN AOD estimates. In addition, we have analyzed the long-term consistency between ANN AOD time series and long-term meteorological records identifying Saharan mineral dust events at IZO
15
(synoptical observations and local wind records). Both analyses provide consistent re-sults, with correlations larger than 85 %. Therefore, we can conclude the reconstructed AOD time series captures well the AOD variations and dust-laden Saharan air mass outbreaks at short-term and long-term time scales and, thus, it is suitable to be used in climate analysis.
20
1 Introduction
Solar radiation reaching the Earth’s surface (SSR) plays a key role in our climate and environment. In the last decades, numerous analyses have demonstrated that SSR records have not been constant over time, but have undergone climatologically sig-nificant decadal variations (e.g. Pallé and Butler, 2001; Stanhill and Cohen, 2001;
25
AMTD
8, 9075–9103, 20151941–2013 AOD time series at IZO from
ANNs
R. D. García et al.
Title Page
Abstract Introduction
Conclusions References
Tables Figures
◭ ◮
◭ ◮
Back Close
Full Screen / Esc
Printer-friendly Version Interactive Discussion
Discussion
P
a
per
|
Discussion
P
a
per
|
Discussion
P
a
per
|
Discussion
P
a
per
|
the early 1950s the few data available suggest an increase of the SSR in the first part of the 20th century, known as early brightening. This period is followed by a widespread
period of reduced solar radiation from the 1950s to the end of the 1990s. This effect,
extensively reported by the literature at a global scale, is known as dimming, with a
gen-eral decline between 4 and 6 % decade−1 considering worldwide distributed stations.
5
Recently, a gradual increase of the SSR has been documented, known as
brighten-ing, with trends between+1 and +11 % decade−1 from the 1980s onwards (Ohmura
and Lang, 1989; De Bruin et al., 1995; Gilgen et al., 1998; Stanhill and Cohen, 2001; Ohmura, 2006; Wild et al., 2005; Sanchez-Lorenzo et al., 2007; Wild et al., 2008; Wild, 2009; García et al., 2014a).
10
The causes of these phenomena are not fully understood currently, but it has been pointed as most probably the changes in the transmissivity of the Earth’s atmosphere. These changes might be due to changes on global cloud cover and atmospheric aerosol concentrations. Wild et al. (2005) found that the changes are observed un-der all cloud-cover conditions, thus probably the most important cause is the aerosol
15
effects (Kaufman et al., 2002). In this context, the study of the spatial and temporal
variability of atmospheric aerosols at sites in background conditions can offer crucial
insights to account for their key role on the observed SSR trends. For this purpose, reliable long-term series of aerosol content and properties are fundamental. However, these long-term series are only available typically since the middle of the 1970s, due
20
to the poor data quality and changes in measurements methodology before this date. There are few studies treating aerosol long-term series in the literature. The longest available series are those of normal direct irradiance measured at various stations in Russia, Ukraine and Estonia covering together a 102 year period (1906–2007) with which the atmospheric transparency has been estimated (Ohvril et al., 2009). Kudo
25
et al. (2011) estimated aerosol optical depth (AOD) combining broadband direct and
diffuse irradiance measurements performed at Tsukuba, Japan, from 1975 to 2008.
AMTD
8, 9075–9103, 20151941–2013 AOD time series at IZO from
ANNs
R. D. García et al.
Title Page
Abstract Introduction
Conclusions References
Tables Figures
◭ ◮
◭ ◮
Back Close
Full Screen / Esc
Printer-friendly Version Interactive Discussion
Discussion
P
a
per
|
Discussion
P
a
per
|
Discussion
P
a
per
|
Discussion
P
a
per
|
irradiance measurements at Izaña Atmospheric Observatory (IZO) since 1976. All of
these studies are based on solar spectrometry, but a different approach is needed to
obtain longer AOD time series.
One of the most powerful tools used in science in the last decades are the artifi-cial neural networks (ANNs). The ANNs have been employed in diverse applications
5
and fields such as robotics, pattern recognition, forecasting, medicine, power systems, etc. In atmospheric science the use of ANNs is quite recent, for example, ANNs have been successfully used for estimating solar radiation values (Mohandes et al., 1998; Dorvlo et al., 2002; López et al., 2005; Feister and Junk, 2006; Junk et al., 2007; Feister et al., 2008; Paoli et al., 2009; Linares-Rodríguez et al., 2011, 2013) or cloud properties
10
(González et al., 2002; Cerdeña et al., 2006). However, its use for AOD estimations is quite recent and limited to short periods. For example, Cazorla et al. (2008) estimated AOD values from All-Sky images at Granada (Spain) between 2005 and 2006, finding uncertainties of 0.019 and 0.014 for AOD at 440 and 670 nm, respectively, by com-paring with AERONET (AErosol RObotic NETwork; http://aeronet.gsfc.nasa.gov) AOD
15
observations. Also, Foyo-Moreno et al. (2014) used ANNs to obtained AOD from global,
diffuse and direct normal irradiance in Granada between 2006 and 2008. They found
uncertainties of∼13 % respect to AERONET AOD values.
In this context, the goal of this paper is to estimate the long-term AOD time series of Saharan mineral dust events at IZO and to document its quality and long-term
con-20
sistency by a comprehensive validation study. This has been done by using ANN tech-niques and, as input parameters, in-situ meteorological observations performed at IZO between 1941 and 2001. The estimated ANN AOD time series has been completed with AOD observations from sunphotometry since 2003. Given the strategic location of IZO, very close to the Saharan desert, the reconstructed ANN AOD time series provide
25
AMTD
8, 9075–9103, 20151941–2013 AOD time series at IZO from
ANNs
R. D. García et al.
Title Page
Abstract Introduction
Conclusions References
Tables Figures
◭ ◮
◭ ◮
Back Close
Full Screen / Esc
Printer-friendly Version Interactive Discussion
Discussion
P
a
per
|
Discussion
P
a
per
|
Discussion
P
a
per
|
Discussion
P
a
per
|
have been obtained (IZO), while Sect. 3 presents the architecture, training process and input parameters used to select the optimal ANN configuration, as well as an error anal-ysis of ANN AOD estimations. Section 4 shows the validation of ANN AOD estimates with coincident AOD measurements, whereas the comparison between long-term ANN AOD and meteorological records is addressed in Sect. 5. Finally, a summary and the
5
main conclusions are given in Sect. 6.
2 Description of site and aerosol conditions
Izaña Atmospheric Observatory (http://izana.aemet.es) is a high-mountain
observa-tory located in Tenerife (Canary Islands) at 28.3◦N, 16.5◦W, 2373 m a.s.l., and situated
approximately 300 km west from the African coast (Fig. 1a). IZO is managed by the
10
Izaña Atmospheric Research Center (IARC) which forms part of the Meteorological State Agency of Spain (AEMET).
The observatory is located above a strong subtropical temperature inversion layer,
which acts as a natural barrier for local pollution (Fig. 1b). In addition, IZO is affected
by a quasi-permanent subsidence regime typical of subtropical latitudes, therefore the
15
air surrounding the observatory is representative of the background free troposphere (especially at night-time). The combination of these two features makes IZO excel-lent for in-situ and remote sensing atmospheric measurements and explains the his-tory of the observahis-tory. The first meteorological observations date from 1916 (DGIGE, 1915). In 1984 IZO became a World Meteorological Organization (WMO) Background
20
Atmospheric Pollution Monitoring Network (BAPMon), and afterwards (1989), a Global Atmosphere Watch (GAW) station. Currently, there is a comprehensive measurement programme to monitor the atmospheric composition. IZO has been part of NDACC (Network for the Detection of Atmospheric Composition Change) since 2001, and has actively contributed to international aerosols and radiation networks such as GAW/PFR
25
AMTD
8, 9075–9103, 20151941–2013 AOD time series at IZO from
ANNs
R. D. García et al.
Title Page
Abstract Introduction
Conclusions References
Tables Figures
◭ ◮
◭ ◮
Back Close
Full Screen / Esc
Printer-friendly Version Interactive Discussion
Discussion
P
a
per
|
Discussion
P
a
per
|
Discussion
P
a
per
|
Discussion
P
a
per
|
2014, IZO was appointed by WMO as a CIMO (Commission for Instruments and Meth-ods of Observation) Testbed for aerosols and water vapour remote sensing instruments (Cuevas et al., 2015a).
The typical background free troposphere conditions at IZO are only significantly mod-ified in summer, mainly in July and August, when the most intense and relatively
fre-5
quent Saharan air mass outbreaks in the subtropical free troposphere can affect the
observatory (Cuevas, 1996; Rodríguez et al., 2011, 2015; Cuevas et al., 2013, 2015b; Barreto et al., 2014). During these months, Saharan dust long-range transport over the Atlantic that can reach the Caribbean is driven by incursions of the so-called Saharan Air Layer (SAL) over the North Atlantic (Prospero et al., 2002, and references therein).
10
In order to discriminate these two atmospheric conditions at IZO (clean free tropo-sphere and presence of the SAL) we have combined AOD and Angström Exponent
(α) information. While AOD provides the overall solar extinction due to aerosols, α
characterizes the AOD spectral variation, which is related to the aerosols median size
(Kaufman et al., 1994). Highαvalues indicate fine particle predominance, lowαvalues
15
are related to coarse particles (Kaufman et al., 1994; Kim et al., 2011). Figure 2
illus-trates an example of AOD-αdistributions, showing the daily AOD time series at 500 nm
labeled with the corresponding dailyαvalues since AERONET records are available at
IZO (2004 onwards). Values of AOD≤0.10 andα≥0.75 (zone I, 63 % of days),
corre-spond to background conditions, while values of AOD≥0.20 and≤0.50 (zone II, 9 % of
20
days), are associated with Saharan dust episodes. Finally, the zone III, characterized by
0.10<AOD<0.20 and 0.50< α <0.75 (28 % of days), describes the periods of
tran-sition between these two patterns. As observed, the Saharan dust events at IZO are mainly detected in summer months (July, August and September) with a median AOD
value of 0.13±0.02 andαof 0.47±0.03, in contrast with the clean conditions observed
25
the rest of months (median AOD andα of 0.05±0.01 and 1.17±0.02, respectively, for
zone I and median AOD andαof 0.07±0.02 and 0.67±0.03, respectively, for zone III).
AMTD
8, 9075–9103, 20151941–2013 AOD time series at IZO from
ANNs
R. D. García et al.
Title Page
Abstract Introduction
Conclusions References
Tables Figures
◭ ◮
◭ ◮
Back Close
Full Screen / Esc
Printer-friendly Version Interactive Discussion
Discussion
P
a
per
|
Discussion
P
a
per
|
Discussion
P
a
per
|
Discussion
P
a
per
|
Eastern North Atlantic. Note that, hereafter, we use AOD medians instead of means because the AOD values dramatically change orders of magnitude from background
conditions to dusty conditions. The errors are given as±1SEM (standard error of the
median).
3 Artificial neural networks (ANNs)
5
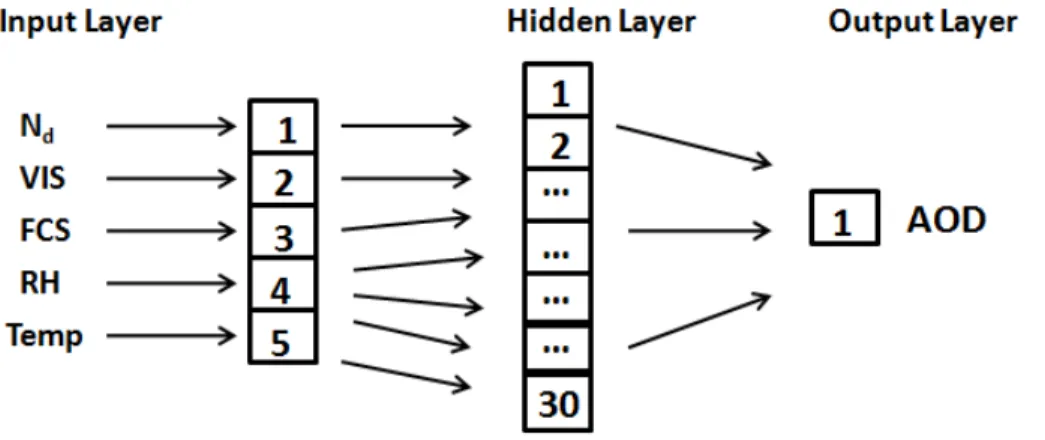
ANNs are statistical data modeling tools, inspired by the human brain, capable of sim-ulating highly non-linear and complex relationships between inputs and outputs by a learning process. This tool mainly consists in three layers of neurons: the input layer groups the input data and connects them with the hidden layer, where the layer of neu-rons processes the input information with the adaptive weights obtained in the learning
10
procedure. Finally, the hidden layer is connected with the output layer, in which the transfer function processes the input data to obtain the outputs or targets (Jain et al., 1996, and references therein).
In this work, the ANNs have been implemented by using the Matlab Neural Net-work Toolbox (Demuth and Beale, 1993) with the architecture shown in Fig. 3: an
in-15
put layer with different meteorological observations taken at IZO as input parameters
(Sect. 3.2 details the selection of these inputs), a hidden layer made up of 30 neurons,
and a transfer functionϕdefined by the hyperbolic tangent function (Eq. 1). Our target
parameter is AOD at 500 nm (hereafter ANN AOD).
ϕ=tanh(χ)=e
2χ −1
e2χ+1 (1)
20
whereχ is the corresponding input.
3.1 Training process
AMTD
8, 9075–9103, 20151941–2013 AOD time series at IZO from
ANNs
R. D. García et al.
Title Page
Abstract Introduction
Conclusions References
Tables Figures
◭ ◮
◭ ◮
Back Close
Full Screen / Esc
Printer-friendly Version Interactive Discussion
Discussion
P
a
per
|
Discussion
P
a
per
|
Discussion
P
a
per
|
Discussion
P
a
per
|
of the ANN’s results and, then, to select the optimal ANN. To do so, we have iteratively repeated the learning procedure 1000 times considering the Levenberg–Marquard al-gorithm (Foresee and Hagan, 1997). For each iteration the input dataset is randomly divided into the training (70 % of the data) and validation (15 % of the data) subsets to obtain ANN AOD and test subset (15 % of the data) to evaluate and validate with
5
the known outputs. Then, the best ANN is selected in the iterative procedure as that
showing the highest Pearson correlation coefficient (R) slope closer to one and lowest
intercept with respect to the known outputs (Hao and Wilamowski, 2011).
The AOD measurements used to train the ANNs were performed with one of the most accurate and stable instruments dedicated for atmospheric aerosol monitoring,
10
a Precision Filter Radiometer (hereafter PFR AOD), developed at the World Radia-tion Center Physikalish-Meteorologisches Observatorium (www.pmodwrc.ch). It was installed at IZO in the framework of a high precision world network for AOD character-ization and watching (GAW/PFR) in June 2001, but continuous observations are only available since 2003. The PFR measures direct solar radiation, with a field of view of
15
2.5◦, at 862, 500, 412 and 368 nm. Then, the AOD is estimated at all these wavelengths
with an expected uncertainty of±0.01 (Wehrli, 2000). In this study, we have used Level
3.0 of Version 3.0 AOD at 500 nm.
3.2 Input parameters and ANN AOD estimates
The other critical step in the ANN design is the selection of an appropriate set of
in-20
put parameters, since they should be able to adequately capture the actual variability of the target. A parameter describing the extinction of the solar radiation similarly to AOD is the horizontal visibility (VIS). The VIS is estimated by human observations (by observers) manually as the maximum distance at which the naked eye of an observer can distinguish a predetermined marker object (a building, a mountain, etc.) from the
25
AMTD
8, 9075–9103, 20151941–2013 AOD time series at IZO from
ANNs
R. D. García et al.
Title Page
Abstract Introduction
Conclusions References
Tables Figures
◭ ◮
◭ ◮
Back Close
Full Screen / Esc
Printer-friendly Version Interactive Discussion
Discussion
P
a
per
|
Discussion
P
a
per
|
Discussion
P
a
per
|
Discussion
P
a
per
|
on the variability of the VIS, we only work with cloud-free days filtered with an average sky cover of 0 oktas. Furthermore, we have introduced the fraction clear sky (FCS)
defined as the ratio between the maximum daily sunshine duration SDmaxand SD
per-formed with Campbell-Stokes sunshine recorder (García et al., 2014a) to account for the remaining variability introduced by the presence of clouds, fog, etc. To complete the
5
characterization of the meteorological conditions, we have considered the relative
hu-midity (RH) and temperature records (T). The latter inputs are only available every 3 h
between 06:00 and 18:00 UTC, thereby we have calculated the daily medians. Finally, to account for the seasonal variation of each parameter we have also introduced the day of year (Nd) as input parameter. The time series at IZO range from 1916 and 1921
10
to present for T/RH and FCS, respectively, and from 1941 to 2009 for VIS. Therefore, the latter time series determines the period in which the ANN AOD time series can be estimated with ANN techniques: 1941–2009. These data were taken from the AEMET climatological database (http://www.aemet.es).
In order to study the relative importance of each input parameter and select the
15
best configuration, several combinations of the input parameters has been trained, validated and tested in the period 2003–2009 (period with coincident PFR AOD and
input parameter measurements). The different combinations considered were: (A) Nd
and VIS; (B) Nd, VIS and FCS; (C) Nd, VIS, FCS and RH; and (D) Nd, VIS, FCS, RH and Temp. As observed in Table 1, the VIS and FCS are the most critical parameters
20
determining∼90 % of the observed AOD variance, although the maximum agreement
is achieved when the RH is also taken into account as input parameter (setup C). This configuration accounts for 98 % of the actual AOD variability with a slope of 0.99 and
intercept of−0.01 between the measured and estimated AOD values. By applying this
setup, we have obtained the daily ANN AOD time series between 1941 and 2009 at
25
IZO, which is displayed in Fig. 4 on a monthly basis.
To analyze how the ANN AOD estimates could be affected by uncertainties in the
param-AMTD
8, 9075–9103, 20151941–2013 AOD time series at IZO from
ANNs
R. D. García et al.
Title Page
Abstract Introduction
Conclusions References
Tables Figures
◭ ◮
◭ ◮
Back Close
Full Screen / Esc
Printer-friendly Version Interactive Discussion
Discussion
P
a
per
|
Discussion
P
a
per
|
Discussion
P
a
per
|
Discussion
P
a
per
|
eters described in the previous section, obtaining the non-perturbed values (AOD). In a second step, we have simulated again the same sample by applying the typical
uncer-tainties of the inputs parameters reported in the literature,±5 % for FCS (García et al.,
2014a) and±2 % for RH (Thies, 2011). For the horizontal visibility we have assumed
a very conservative error of±25 %. Note that the day of year has been omitted from
5
this analysis.
This strategy was applied to all cloud-free days (oktas=0) between 2003 and 2009
in order to detect random and systematic behaviours in the error time series (AOD±δ)
(García et al., 2014b). As the theoretical error distributions have not shown dependence either on the input parameters or on the ANN AOD values (correlation is not significant
10
at 95 % level of confidence), the systematic and random errors have been calculated as the median and the standard deviation of the corresponding error distributions.
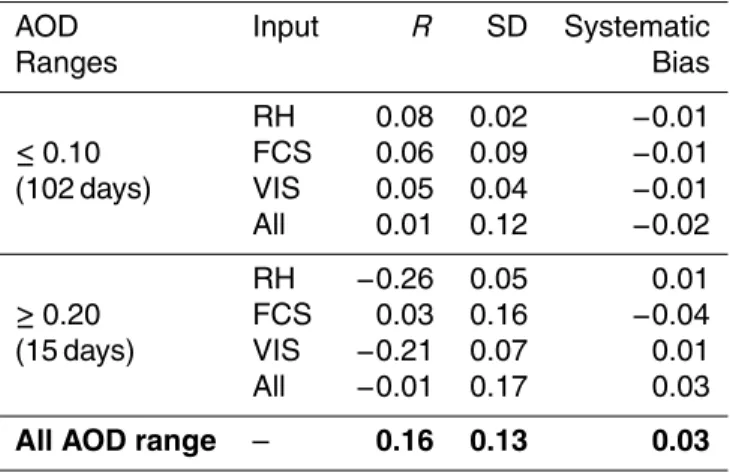
The results of our error analysis are summarized in Table 2, where the two preva-lent atmospheric situations observed at IZO have been distinguished: free-troposphere
background conditions with AOD≤0.10 and α≥0.75, and Saharan dust events with
15
AOD≥0.20 andα≤0.50. As expected, the uncertainties of the FCS and VIS dominate
the random and systematic error budgets for all the AOD ranges. For AOD≤0.10 the
scatter reaches 0.12 and the systematic error is−0.02, while for AOD≥0.20 we obtain
a scatter of 0.17, and a bias of 0.03. When considering all the AOD range and all the input parameter errors, the overall uncertainty is expected to be less than 0.15 (SD),
20
with a positive bias of 0.03.
4 Validation of ANN AOD estimates
The ANN AOD estimates have been validated with coincident AERONET CIMEL pho-tometers Level 2.0 AOD (cloud screened and quality ensured) from 2004 to 2009, and with a long-term AOD at 769.9 nm data series retrieved by Barreto et al. (2014) from
25
AMTD
8, 9075–9103, 20151941–2013 AOD time series at IZO from
ANNs
R. D. García et al.
Title Page
Abstract Introduction
Conclusions References
Tables Figures
◭ ◮
◭ ◮
Back Close
Full Screen / Esc
Printer-friendly Version Interactive Discussion
Discussion
P
a
per
|
Discussion
P
a
per
|
Discussion
P
a
per
|
Discussion
P
a
per
|
CIMEL photometers retrieves AOD measurements at different wavelengths between
340–1640 nm from direct Sun observations under cloud-free conditions, with an ex-pected uncertainty of 0.01 at 500 nm for field instruments (Eck et al., 1999). The val-idation procedure of Mark-I AOD time series was performed by Barreto et al. (2014),
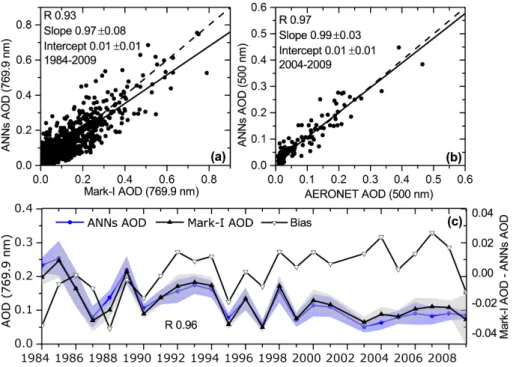
showing a root-mean-square error of 0.022 (R=0.94) and 0.034 (R=0.92) in
com-5
parison with the PFR reference and AERONET master instruments, respectively. In order to compare the Mark-I AOD values at 769.9 nm and the ANN AOD estimates at 500 nm, we have extrapolated the ANN AOD values from 500 to 769.9 nm by using the
Angström’s Law (Angstrom, 1929) and the α data retrieved from PFR observations.
From Mark-I we have used the AOD records since 1984 when the observations start
10
to be seamlessly performed.
The straightforward comparisons between AOD observations and estimates show
a good agreement for the daily values with∼94 % (R=0.97) of the variance in
agree-ment between AERONET AOD and ANN AOD, and 85 % (R=0.93) between Mark-I
AOD and ANN AOD values (Fig. 5a and b). When considering monthly values the
15
agreement increases, achieving a correlation of 96 and 98 % with Mark-I/ANN and AERONET/ANN, respectively. Although the comparison with the Mark-I AOD records shows a poorer agreement, both inter-comparisons behave similarly. We observe that the ANN AOD estimates have shown to be dependent on the AOD range (see Table 3), confirming the results obtained in the theoretical error estimation (Table 2). For low
20
AOD, the ANN AOD values tend to overestimate compared with the observed AOD
values (median bias of ∼0.01–0.02), but the contrary behavior is observed for high
AOD (underestimation by 0.01–0.03). However, the overall ANN AOD/ Mark-I AOD scatter (0.06) duplicates the observed for the ANN AOD/AERONET AOD comparison (0.03). This agreement is within the AOD uncertainty of Mark-I (Barreto et al., 2014)
25
AMTD
8, 9075–9103, 20151941–2013 AOD time series at IZO from
ANNs
R. D. García et al.
Title Page
Abstract Introduction
Conclusions References
Tables Figures
◭ ◮
◭ ◮
Back Close
Full Screen / Esc
Printer-friendly Version Interactive Discussion
Discussion
P
a
per
|
Discussion
P
a
per
|
Discussion
P
a
per
|
Discussion
P
a
per
|
values capture well the day-to-day AOD variability and successfully identify Saharan mineral dust events at IZO.
The long-term Mark-I AOD time series also allows us to analyse the temporal con-sistency of the ANN AOD estimations by examining possible drifts and discontinuities
in the monthly time series of the differences between ANN AOD and Mark-I AOD for
5
July, August and September. A drift is defined as the linear trend of monthly median bias (measurements-estimations), while the change-points (changes in the median of the bias time series) are analyzed by using a robust rank order change-point test (Lan-zante, 1996). We detect a systematic change point in 1997 (see Fig. 5c), caused by the horizontal visibility records. Although this discontinuity is significant at 99 % confidence
10
level, the difference of median bias is rather small (−0.013±0.001 for 1984–1997
pe-riod and+0.006±0.003 for 1998–2009 period) and within the ANN AOD and Mark-I
AOD expected uncertainties. Furthermore, we observe that there are no significant drifts in the bias time series either before or after this systematic change point at 99 % of confidence level. For the rest of months, August and September, the bias time
se-15
ries have shown neither significant systematic change points nor temporal drifts. These findings indicate that the ANN AOD estimates are consistent over time and, thus, valid to reconstruct the AOD time series at IZO.
5 Comparison of long-term ANN AOD with meteorological records
We have analysed the long-term variability of ANN AOD time series by comparing
20
with long-term meteorological records identifying Saharan dust events at IZO. On one hand, we have compared the number of days in which estimated ANN AOD values
fall within different AOD intervals with the number of days in which the
meteorologi-cal observers reported presence of dust in suspension (05–06 SYNOP codes, WMO, 1998) at IZO during the dust season (July–September) since 1941 (see Fig. 6a and
25
b). On the other hand, locally at the observatory, when haze or dust in suspension is
AMTD
8, 9075–9103, 20151941–2013 AOD time series at IZO from
ANNs
R. D. García et al.
Title Page
Abstract Introduction
Conclusions References
Tables Figures
◭ ◮
◭ ◮
Back Close
Full Screen / Esc
Printer-friendly Version Interactive Discussion
Discussion
P
a
per
|
Discussion
P
a
per
|
Discussion
P
a
per
|
Discussion
P
a
per
|
(Fig. 6c). Therefore, we have analyzed the relation between the monthly AOD medians in July (month with the maximum frequency of Saharan dust events at IZO in the study period) and the monthly percentage of time the wind is blowing from each of the four quadrants for the period 1941–2009. Both analyses provide consistent results. On one hand, we found that the number of days with 05–06 Synop codes time series agrees
5
with the number of days with ANN AOD≥0.20 time series (R=0.89). On the other
hand, a high correlation (R=0.86) between the ANN AOD monthly medians and the
percentage of time the wind blows in the second quadrant is observed, whilst no
cor-relation at all is found in the other three quadrants (R of 0.24, 0.16 and 0.14, for the
first, third and fourth quadrants, respectively) (see Fig. 6c and d). These results show
10
that the reconstructed ANN AOD series correlate well with other series of independent atmospheric parameters, confirming its consistency in this long period (1941–2009), and probing its capability for tracking inter-annual variations of dust-laden Saharan air mass outbreaks. The ANN AOD series is suitable to be used in climate analysis.
6 Summary and conclusions
15
This paper presents, for the first time, the AOD time series of Saharan mineral dust outbreaks over the subtropical North Atlantic between 1941 and 2013. This has been
done at the Izaña Atmospheric Observatory (IZO), frequently affected by the Saharan
Air layer during the summer months, and by combining AOD estimates from artificial neural networks (ANNs) between 1941 and 2001, and AOD measurements during the
20
period 2003–2013.
The ANNs method has proved to be a very useful tool for the reconstruction of daily AOD values at 500 nm from meteorological input data, such as the horizontal visibility, fraction of clear sky, and relative humidity, recorded at IZO. ANN AOD esti-mates adequately captures the day-to-day AOD variations and the long-term trends as
25
AMTD
8, 9075–9103, 20151941–2013 AOD time series at IZO from
ANNs
R. D. García et al.
Title Page
Abstract Introduction
Conclusions References
Tables Figures
◭ ◮
◭ ◮
Back Close
Full Screen / Esc
Printer-friendly Version Interactive Discussion
Discussion
P
a
per
|
Discussion
P
a
per
|
Discussion
P
a
per
|
Discussion
P
a
per
|
values, with Pearson coefficients of 0.97 (AERONET/ANN) and 0.93 (Mark-I/ANN).
At the longest time scale (1941–2009), we found a good agreement between ANN AOD monthly medians and the percentage of time the wind blows from the Sahara
desert (SE) (R=0.86), and also a good correlation between the number of days with
AOD≥0.20 and the number of days in which synoptical observations reported
min-5
eral dust events (R=0.89). These results show the reliability of the reconstructed ANN
AOD series, confirming its consistency in this long period (1941–2009), and capability for tracking inter-annual variations of dust-laden Saharan air mass outbreaks.
Finally, this paper also highlights the potential of ANNs to estimate AOD values and probe its suitability for long-term AOD series reconstruction. Thereby, the ANN
method-10
ology developed here for AOD series reconstruction might be suitable to be applied in Synoptic stations of North Africa, the Middle East and Asia, in which the reduced visibil-ity is primarily due to the presence of mineral dust, and where recent AOD observations are available for validation.
Acknowledgements. This work was developed under the Specific Agreement of Collaboration
15
between the Meteorological State Agency (AEMET) of Spain and the University of Valladolid regarding radiometry, ozone and atmospheric aerosol programmes conducted at Izaña Atmo-spheric Observatory (IZO), and for the adaptation and integration of the AEMET CIMEL net-work following the AERONET-RIMA standards. This study is also part of the activities carried out within the WMO CIMO Testbed for Aerosols and Water Vapor Remote Sensing instruments
20
at Izaña Observatory. The AERONET Cimel sunphotometer at Izaña has been calibrated by AERONET-EUROPE Calibration Service, financed by the Aerosol Cloud and TRace gas In-fraStructure (ACTRIS) European Research Infrastructure Action (FP7/2007-2013 No. 262254). Financial supports from the Spanish Ministry of Economy and Competitiveness (MINECO) and from the “Fondo Europeo de Desarrollo Regional” (FEDER) for project CGL2012-33576
25
is gratefully acknowledged. We thank the AERONET-GSFC, PHOTONS-LOA, RIMA-UVa, and RIMA-CIAI (AEMET) stafffor their scientific and technical support. The authors are grateful to the IZO team and especially all observers who have worked in the past at Izaña Atmospheric Observatory. We also acknowledge our colleague Celia Milford for improving the English lan-guage of the manuscript.
AMTD
8, 9075–9103, 20151941–2013 AOD time series at IZO from
ANNs
R. D. García et al.
Title Page
Abstract Introduction
Conclusions References
Tables Figures
◭ ◮
◭ ◮
Back Close
Full Screen / Esc
Printer-friendly Version Interactive Discussion
Discussion
P
a
per
|
Discussion
P
a
per
|
Discussion
P
a
per
|
Discussion
P
a
per
|
References
Angström, A. K.: On the atmospheric transmission of sun radiation and on the dust in the air, Geogr. Ann., 12, 130–159, 1929. 9085
Barreto, A., Cuevas, E., Pallé, P., Romero, P. M., Guirado, C., Wehrli, C. J., and Almansa, F.: Recovering long-term aerosol optical depth series (1976–2012) from an astronomical
5
potassium-based resonance scattering spectrometer, Atmos. Meas. Tech., 7, 4103–4116, doi:10.5194/amt-7-4103-2014, 2014. 9077, 9080, 9084, 9085
Cazorla, A., Olmo, F. J., and Alados-Arboledas, L.: Using a sky imager for aerosol characteri-zation, Atmos. Environ., 42, 2739–2745, 2008. 9078
Cerdeña, A., González, A., and Pérez, J. C.: Remote sensing of water cloud parameters using
10
neural networks, J. Atmos. Ocean. Tech., 24, 52–63, doi:10.1175/JTECH1943.1, 2006. 9078 Cuevas, E.: Estudio del Comportamiento del Ozono Troposférico en el Observatorio de Izaña (Tenerife) y su Relación con la Dinámica Atmosférica, Thesis, Univ. Complutense de Madrid at Spain, available at: http://www.ucm.es/BUCM/tesis/19911996/X/1/X1023101.pdf, 1996 (in Spanish). 9080
15
Cuevas, E., González, Y., Rodríguez, S., Guerra, J. C., Gómez-Peláez, A. J., Alonso-Pérez, S., Bustos, J., and Milford, C.: Assessment of atmospheric processes driving ozone variations in the subtropical North Atlantic free troposphere, Atmos. Chem. Phys., 13, 1973–1998, doi:10.5194/acp-13-1973-2013, 2013. 9080
Cuevas, E., Milford, C., Bustos, J. J., del Campo-Hernández, R., García, O. E., García, R. D.,
20
Gómez-Peláez, A. J., Ramos, R., Redondas, A., Reyes, E., Rodríguez, S., Romero-Campos, P. M., Schneider, M., Belmonte, J., Gil-Ojeda, M., Almansa, F., Alonso-Pérez, S., Barreto, A., Guirado-Fuentes, C., López-Solano, C., Afonso, S., Bayo, C., Berjón, A., Bethen-court, J., Camino, C., Carreño, V., Castro, N. J., Cruz, A. M., Damas, M., De Ory-Ajamil, F., García, M. I., Fernández-de Mesa, C. M. González, Y., Hernández, C., Hernández, Y.,
25
Hernández, M. A., Hernández, B., Jover, M., Kühl, S. O., Fernández, R., López-Solano, J., Peris, A., Rodríguez-Franco, J. J., Sálamo, C., Sepúlveda, E., and Sierra-Ramos, M.: Izaña Atmospheric Research Center Activity Report 2012–2014, edited by: Cuevas, E. and Milford, C., NIPO: 281-15-004-2, State Meteorological Agency (AEMET), Madrid, Spain, 2015a. 9080
30
AMTD
8, 9075–9103, 20151941–2013 AOD time series at IZO from
ANNs
R. D. García et al.
Title Page
Abstract Introduction
Conclusions References
Tables Figures
◭ ◮
◭ ◮
Back Close
Full Screen / Esc
Printer-friendly Version Interactive Discussion
Discussion
P
a
per
|
Discussion
P
a
per
|
Discussion
P
a
per
|
Discussion
P
a
per
|
and Schulz, M.: The MACC-II 2007–2008 reanalysis: atmospheric dust evaluation and char-acterization over northern Africa and the Middle East, Atmos. Chem. Phys., 15, 3991–4024, doi:10.5194/acp-15-3991-2015, 2015b. 9080
De Bruin, H. A. R., Van den Hurk, B. J. J. M., and Welgraven, D.: A series of global radiation at Wageningen for 1928–1992, Int. J. Climatol., 15, 1253–1272, doi:10.1002/joc.3370151106,
5
1995. 9077
Dirección General del Instituto Geográfico y Estadístico: Observatorio Atmosférico de Izaña, Anual del Observatorio Central Meteorológico, Sumplemento al tomo III, Madrid, 1915. 9079 Demuth, H. and Beale, M.: Neural network toolbox for use with MATLAB, USA, The MathWorks
Inc, 1993. 9081
10
Dorvlo, A. S., Jervase, J. A., and Al-Lawati, A.: Solar radiation estimation using artificial neural networks, Appl. Energ., 71, 307–319, 2002. 9078
Eck, T. F., Holben, B. N., Reid, J. S., Dubovik, O., Smirnov, A., O’Neill, N. T., Slutsker, I., and Kinne, S.: Wavelength dependence o f the optical depth of biomass burning, urban, and desert dust aerosols, J. Geophys. Res., 104, 31333–31349, doi:10.1029/1999JD900923,
15
1999. 9085
Feister, U. and Junk, J.: Reconstruction of daily solar UV irradiation by an Artificial Neural Network, SPIE, 63622H, 6362–94, 1–11, 2006. 9078
Feister, U., Junk, J., Woldt, M., Bais, A., Helbig, A., Janouch, M., Josefsson, W., Kazantzidis, A., Lindfors, A., den Outer, P. N., and Slaper, H.: Long-term solar UV radiation reconstructed by
20
ANN modelling with emphasis on spatial characteristics of input data, Atmos. Chem. Phys., 8, 3107–3118, doi:10.5194/acp-8-3107-2008, 2008. 9078
Foresee, F. D. and Hagan, M. T.: Gauss-Newton approximation to Bayesian learning, in: Pro-ceedings of the 1997 international joint conference on neural networks, Vol. 3, IEEE, Piscat-away, 1930–1935, 1997. 9082
25
Foyo-Moreno, I., Alados, I., Antón, M., Fernández-Gálvez, J., Cazorla, A., and Alados-Arboledas, L.: Estimating aerosol characteristics from solar irradiance measurements at an urban location in southeastern Spain, J. Geophys. Res.-Atmos., 119, 1845–1859, 2014. 9078
García, R. D., Cuevas, E., García, O. E., Cachorro, V. E., Pallé, P., Bustos, J. J.,
Romero-30
AMTD
8, 9075–9103, 20151941–2013 AOD time series at IZO from
ANNs
R. D. García et al.
Title Page
Abstract Introduction
Conclusions References
Tables Figures
◭ ◮
◭ ◮
Back Close
Full Screen / Esc
Printer-friendly Version Interactive Discussion
Discussion
P
a
per
|
Discussion
P
a
per
|
Discussion
P
a
per
|
Discussion
P
a
per
|
García, R. D., García, O. E., Cuevas, E., Cachorro, V. E., Romero-Campos, P. M., Ramos, R., and de Frutos, A. M.: Solar radiation measurements compared to simulations at the BSRN Izaña station, Mineral dust radiative forcing and efficiency study, J. Geophys. Res., 119, 179– 194, doi:10.1002/2013JD020301, 2014b. 9076, 9077, 9083, 9084
Gilgen, H., Wild, M., and Ohmura, A.: Means and trends of shortwave irradiance at the surface
5
estimated from GEBA, J. Climate, 11, 2042–2061, 1998. 9077
González, A., Pérez, J. C., Herrera, F., Rosa, F., Wetzel, M. A., Borys, R. D., and Lowen-thal, D. H.: Stratocumulus properties retrieval method from NOAA-AVHRR data based on the discretization of cloud parameters, Int. J. Remote Sens., 23, 627–645, 2002. 9078 González, Y., Schneider, M., Rodríguez, S., Cuevas, E., Dyroff, C., Christner, E., Andrey, J.,
10
García, O., Sepúlveda, E.: Measurements and interpretation of the water vaporδD variability at Izaña North Atlantic free troposphere site, Symposium on Atmospheric Chemistry and Physics at Mountain Sites, Steamboat Springs, CO, USA, 11–15 August 2014, avalable at: http://izana.aemet.es (last access: 1 September 2015), 2014. 9098
Hao, Y. and Wilamowski, B. M.: Levenberg–Marquardt Training. Industrial Electronics
Hand-15
book, vol. 5, Intelligent Systems, 2nd edn., chapter 12, 12-1–12-15, CRC Press, Boca Raton, 2011. 9082
Holben, B. N., Tanré, D., Smirnov, A., Eck, T. F., Slutsker, I.,Abuhassan, N., New-comb, W. W., Schafer, J. S., Chatenet, B., Lavenu, F., Kaufman, Y. J., Vande Castle, J., Setzer, A.,Markham, B., Clark, D., Frouin, R., Halthore, R., Karneli, A., O’Neill, N. T.,
20
Pietras, C., Pinker, C., Voss, K., and Zibordi, G.: An emerging ground-based aerosol climatol-ogy: Aerosol Optical Depth from AERONET, J. Geophys. Res.-Atmos., 106, 12067–12097, doi:10.1029/2001JD900014, 2001. 9077
Jain, A. K., Mao, J., and Mohiuddin, K. M.: Artificial neural networks: a tutorial, Computer, 3, 31–44, 1996. 9081
25
Junk, J., Feister, U., and Helbig, A.: Reconstruction of daily solar UV irradiation from 1893 to 2002 in Potsdam, Germany, Int. J. Biometeorol., 51, 505–512, 2007. 9078
Kaufman, Y. J., Gitelson, A., Karnieli, A., Ganor, E., and Fraser, R. S.: Size distribution and phase function of aerosol particles retrieved from sky brightness measurements, J. Geophy. Res.-Atmos., 99, 10331–10356, 1994. 9080
30
AMTD
8, 9075–9103, 20151941–2013 AOD time series at IZO from
ANNs
R. D. García et al.
Title Page
Abstract Introduction
Conclusions References
Tables Figures
◭ ◮
◭ ◮
Back Close
Full Screen / Esc
Printer-friendly Version Interactive Discussion
Discussion
P
a
per
|
Discussion
P
a
per
|
Discussion
P
a
per
|
Discussion
P
a
per
|
Kim, D., Chin, M., Yu, H., Eck, T. F., Sinyuk, A., Smirnov, A., and Holben, B. N.: Dust optical properties over North Africa and Arabian Peninsula derived from the AERONET dataset, Atmos. Chem. Phys., 11, 10733–10741, doi:10.5194/acp-11-10733-2011, 2011. 9080 Kudo, R., Uchiyama, A., Yamazaki, A., Sakami, T., and Ijima, O.: Decadal changes in
aerosol optical thickness and single scattering albedo estimated from ground-based
5
broadband radiometers: a case study in Japan, J. Geophys. Res.-Atmos., 116, D03207, doi:10.1029/2010JD014911, 2011. 9077
Lanzante, J. R.: Resistant, robust and nonparametric techniques for the analysis of climate data: Theory and examples including applications to historical radiosonde station data, Int. J. Climatol., 16, 1197–1226, 1996. 9086
10
Linares-Rodríguez, A., Ruiz-Arias, J. A., Pozo-Vázquez, D., and Tovar-Pescador, J.: Generation of synthetic daily global solar radiation data based on ERA-Interim reanalysis and artificial neural networks, Energy, 36, 5356–5365, 2011. 9078
Linares-Rodríguez, A., Ruiz-Arias, J. A., Pozo-Vázquez, D., and Tovar-Pescador, J.: An artificial neural network ensemble model for estimating global solar radiation from Meteosat satellite
15
images, Energy, 61, 636–645, 2013. 9078
López, G., Batlles, F. J., and Tovar-Pescador, J.: Selection of input parameters to model direct solar irradiance by using artificial neural networks, Energy, 30, 1675–1684, 2005. 9078 Mohandes, M., Rehman, S., and Halawani, T. O.: Estimation of global solar radiation using
artificial neural networks, Renew. Energ., 14, 179–184,
doi:10.1016/S0960-1481(98)00065-20
2, 1998. 9078
Ohmura, A.: Observed long-term variations of solar irradiances at the Earth’s surface, Space Sci. Rev., 125, 111–128, 2006. 9077
Ohmura, A. and Lang, H.: Secular variation of global radiation over Europe, in: Current Prob-lems in Atmospheric Radiation, edited by: Lenoble, J. and Geleyn, J. F., A. Deepak, Hampton,
25
Va, 298–301, 1989. 9077
Ohvril, H., Teral, H., Neiman, L., Kannel, M., Uustare, M., Tee, M., Russak, V., Okulov, O., Jo-eveer, A., Kallis, A., Ohvril, T., Terez, E. I., Terez, G. A., Gushchin, G. K., Abakumova, G. M., Gorbarenko, E. V., Tsvetkov, A. V., and Laulainen, N.: Global dimming and brightening ver-sus atmospheric column transparency, Europe, 1906–2007, J. Geophys. Res.-Atmos., 114,
30
AMTD
8, 9075–9103, 20151941–2013 AOD time series at IZO from
ANNs
R. D. García et al.
Title Page
Abstract Introduction
Conclusions References
Tables Figures
◭ ◮
◭ ◮
Back Close
Full Screen / Esc
Printer-friendly Version Interactive Discussion
Discussion
P
a
per
|
Discussion
P
a
per
|
Discussion
P
a
per
|
Discussion
P
a
per
|
Paoli, C., Voyant, C., Muselli, M., and Nivet, M. L.: Solar radiation forecasting using ad-hoc time series preprocessing and neural networks, in: Emerging Intelligent Computing Technology and Applications, Springer, Berlin Heidelberg, 898–907, 2009. 9078
Pallé, E. and Butler, C. J.: Sunshine records from Ireland: Cloud factors and possible links to solar activity and cosmic rays, Int. J. Climatol., 21, 709–729, doi:10.1002/joc.657, 2001. 9076
5
Prospero, J., Ginoux, P., Torres, O., and Nicholson, S.: Environmental characterization of global sources of atmospheric soil dust derived from the NIMBUS7 (TOMS) absorbing aerosol prod-uct, Review Geophys., 40, 1002, doi:10.1029/2000RG000095, 2002. 9080
Retalis, A., Hadjimitsis, D. G., Michaelides, S., Tymvios, F., Chrysoulakis, N., Clayton, C. R. I., and Themistocleous, K.: Comparison of aerosol optical thickness with in situ visibility data
10
over Cyprus, Nat. Hazards Earth Syst. Sci., 10, 421–428, doi:10.5194/nhess-10-421-2010, 2010. 9082
Rodríguez, S., Alastuey, A., Alonso-Pérez, S., Querol, X., Cuevas, E., Abreu-Afonso, J., Viana, M., Pérez, N., Pandolfi, M., and de la Rosa, J.: Transport of desert dust mixed with North African industrial pollutants in the subtropical Saharan Air Layer, Atmos. Chem. Phys.,
15
11, 6663–6685, doi:10.5194/acp-11-6663-2011, 2011. 9080
Rodríguez, S., Cuevas, E., Prospero, J. M., Alastuey, A., Querol, X., López-Solano, J., Gar-cía, M. I., and Alonso-Pérez, S.: Modulation of Saharan dust export by the North African dipole, Atmos. Chem. Phys., 15, 7471–7486, doi:10.5194/acp-15-7471-2015, 2015. 9080 Sanchez-Lorenzo, A., Brunetti, M., Calbo, J., and Martin-Vide, J.: Recent spatial and temporal
20
variability and trends of sunshine duration over the Iberian Peninsula from a homogenized data set, J. Geophys. Res., 112, D20115, doi:10.1029/2007JD008677, 2007. 9076, 9077 Shaw, G. E.: Aerosols at Mauna Loa, optical properties, J. Atmos. Sci., 36, 862–869, 1979.
9077
Stanhill, G. and Cohen, S.: Global dimming: a review of the evidence for a widespread
25
and significant reduction in global radiation, Agr. Forest Meteorol., 107, 255–278, doi:10.1016/S0168-1923(00)00241-0, 2001. 9076, 9077
Thies, C.: Instruction Manual Hygro-thermo transmitter compact, Adolf THIES GmbH & Co. KG, Göttingen, Alemania, 2011. 9084
Wehrli, C.: Calibrations of filter radiometers for determination of atmospheric optical depth,
30
Metrologia, 37, 419–422, 2000. 9082
AMTD
8, 9075–9103, 20151941–2013 AOD time series at IZO from
ANNs
R. D. García et al.
Title Page
Abstract Introduction
Conclusions References
Tables Figures
◭ ◮
◭ ◮
Back Close
Full Screen / Esc
Printer-friendly Version Interactive Discussion
Discussion
P
a
per
|
Discussion
P
a
per
|
Discussion
P
a
per
|
Discussion
P
a
per
|
Wild, M., Gilgen, H., Roesch, A., Ohmura, A., Long, C. N., Dutton, E. G., Forgan, B., Kallis, A., Russak, V., and Tsvetkov, A.: From dimming to brightening: decadal changes in surface solar radiation, Science, 308, 847–850, doi:10.1126/science.1103215, 2005. 9077
Wild, M., Grieser, J., and Schär, C.: Combined surface solar brightening and increasing green-house effect support recent intensification of the global land-based hydrological cycle,
Geo-5
phys. Res. Lett., 35, L17706, doi:10.1029/2008GL034842, 2008. 9077
World Meteorological Organization (WMO): Guide to meteorological instruments and methods of observation, 6th edn., WMO no. 8. Secretariat of the World Meteorol. Organ., Geneva, Switzerland, 1996. 9082
World Meteorological Organization (WMO): Manual on Codes, Regional Codes and National
10
AMTD
8, 9075–9103, 20151941–2013 AOD time series at IZO from
ANNs
R. D. García et al.
Title Page
Abstract Introduction
Conclusions References
Tables Figures
◭ ◮
◭ ◮
Back Close
Full Screen / Esc
Printer-friendly Version Interactive Discussion
Discussion
P
a
per
|
Discussion
P
a
per
|
Discussion
P
a
per
|
Discussion
P
a
per
|
Table 1.Parameters of the least-square fit (Pearson correlation coefficient,R, slope and inter-cept) between the measured PFR AOD and the estimated ANN AOD using different configura-tions of input parameters. The setup selected is highlighted in bold.
Inputs R Slope Intercept
(A)Nd-VIS 0.79 0.61 0.03
(B)Nd-VIS-FCS 0.94 0.90 0.01
AMTD
8, 9075–9103, 20151941–2013 AOD time series at IZO from
ANNs
R. D. García et al.
Title Page
Abstract Introduction
Conclusions References
Tables Figures
◭ ◮
◭ ◮
Back Close
Full Screen / Esc
Printer-friendly Version Interactive Discussion
Discussion
P
a
per
|
Discussion
P
a
per
|
Discussion
P
a
per
|
Discussion
P
a
per
|
Table 2.Statistics of the difference between non-perturbed and perturbed ANN AOD estimates (AOD-(AOD±δ)): Pearson correlation coefficient (R) between the differences and ANN AOD values, standard deviation (SD) and median of the difference time series (systematic bias). “All” represents the error estimation considering the uncertainties of all parameters together (VIS±25 %, FCS±5 and RH±2 %).
AOD Input R SD Systematic
Ranges Bias
RH 0.08 0.02 −0.01
≤0.10 FCS 0.06 0.09 −0.01
(102 days) VIS 0.05 0.04 −0.01
All 0.01 0.12 −0.02
RH −0.26 0.05 0.01
≥0.20 FCS 0.03 0.16 −0.04
(15 days) VIS −0.21 0.07 0.01
All −0.01 0.17 0.03
AMTD
8, 9075–9103, 20151941–2013 AOD time series at IZO from
ANNs
R. D. García et al.
Title Page
Abstract Introduction
Conclusions References
Tables Figures
◭ ◮
◭ ◮
Back Close
Full Screen / Esc
Printer-friendly Version Interactive Discussion
Discussion
P
a
per
|
Discussion
P
a
per
|
Discussion
P
a
per
|
Discussion
P
a
per
|
Table 3.Statistics for the difference between AOD observations and ANN AOD estimates for different AOD ranges. The series of differences between Mark-I AOD and ANN AOD is at 769.9 nm in the period 1984–2009 and between AERONET AOD and ANN AOD at 500 nm in the period 2004–2009.N is the number of data andRis Pearson correlation coefficient.
AOD Data N R Random Systematic
Ranges Bias Bias
≤0.10 AERONET 113 0.73 0.02 −0.01
Mark-I 691 0.62 0.04 −0.02
≥0.20 AERONET 11 0.91 0.05 0.01
Mark-I 187 0.75 0.09 0.03
All AOD range AERONET 154 0.97 0.03 −0.01
AMTD
8, 9075–9103, 20151941–2013 AOD time series at IZO from
ANNs
R. D. García et al.
Title Page
Abstract Introduction
Conclusions References
Tables Figures
◭ ◮
◭ ◮
Back Close
Full Screen / Esc
Printer-friendly Version Interactive Discussion
Discussion
P
a
per
|
Discussion
P
a
per
|
Discussion
P
a
per
|
Discussion
P
a
per
|
A
N
N
A
O
D
(
5
0
0
n
m
)
Jul Aug Sep
AMTD
8, 9075–9103, 20151941–2013 AOD time series at IZO from
ANNs
R. D. García et al.
Title Page
Abstract Introduction
Conclusions References
Tables Figures
◭ ◮
◭ ◮
Back Close
Full Screen / Esc
Printer-friendly Version Interactive Discussion
Discussion
P
a
per
|
Discussion
P
a
per
|
Discussion
P
a
per
|
Discussion
P
a
per
|
AMTD
8, 9075–9103, 20151941–2013 AOD time series at IZO from
ANNs
R. D. García et al.
Title Page Abstract Introduction Conclusions References Tables Figures ◭ ◮ ◭ ◮ Back Close
Full Screen / Esc
Printer-friendly Version Interactive Discussion Discussion P a per | Discussion P a per | Discussion P a per | Discussion P a per | SYNOP N u m b e r o f d a y s w it h 0 5 -0 6 S Y N O P c o d e s (b) N u m b e r o f d a y s w it h A O D 0 . 2 0
Number of days with 05-06 SYNOP codes R 0.89
Slope 1.040.07 Intercept 1.21 0.36
AOD A N N A O D 0 10 20 30 40 W ind % H o u r s w i th w i n d f r o m 2 s t q u a d .
R 0.86 (c)
40 30 20 10 20 40 60 R 0.16 R 0.14 R 0.86 E W S N R 0.24 80 0.0 AOD (500 nm)
0.5 0.4 0.3 0.2 0.1 0.5 0.4 0.30.20.1