ACPD
9, 25523–25564, 2009Synoptic variability of the stratocumulus
deck
D. Painemal and P. Zuidema
Title Page
Abstract Introduction
Conclusions References
Tables Figures
◭ ◮
◭ ◮
Back Close
Full Screen / Esc
Printer-friendly Version
Interactive Discussion Atmos. Chem. Phys. Discuss., 9, 25523–25564, 2009
www.atmos-chem-phys-discuss.net/9/25523/2009/ © Author(s) 2009. This work is distributed under the Creative Commons Attribution 3.0 License.
Atmospheric Chemistry and Physics Discussions
This discussion paper is/has been under review for the journal Atmospheric Chemistry and Physics (ACP). Please refer to the corresponding final paper in ACP if available.
Synoptically-induced variability in the
microphysical properties of the South
East Pacific stratocumulus deck
D. Painemal and P. Zuidema
Rosenstiel School of Marine and Atmospheric Sciences University of Miami, USA
Received: 4 November 2009 – Accepted: 14 November 2009 – Published: 27 November 2009
Correspondence to: D. Painemal ([email protected])
ACPD
9, 25523–25564, 2009Synoptic variability of the stratocumulus
deck
D. Painemal and P. Zuidema
Title Page
Abstract Introduction
Conclusions References
Tables Figures
◭ ◮
◭ ◮
Back Close
Full Screen / Esc
Printer-friendly Version
Interactive Discussion
Abstract
Synoptic variations associated with changes in satellite-derived cloud droplet number concentrations (Nd) for the southeast Pacific stratocumulus deck were examined using a composite analysis applied to daily values from the five October months of 2001, 2005, 2006, 2007 and 2008. MAX and MIN Nd composites were defined by the top
5
and bottom terciles of daily area-meanNd values over the Arica Bight, the region with the largest mean oceanic Nd. Nd and ship-based accumulation mode aerosol con-centrations (Na) correlate well (r=0.65), with a best-fit aerosol activation value dlnNd
dlnNa
of 0.53 for pixels withNd>50 cm
−3
. The adiabatically-derived MODIS cloud depths also correlate well with the ship-based cloud depths (r=0.7), though are consistently
10
higher (mean bias of almost 60 m). The MAX-Nd composite is characterized by a weaker subtropical anticyclone and weaker winds both at the surface and the lower free troposphere than the MIN-Nd composite. The MAX-Nd composite clouds over the Arica Bight are thinner than the MIN-Nd composite clouds, have lower cloud tops, and occur within warmer, drier free tropospheres (as deduced from radiosondes) that imply
15
greater coastal subsidence. The cloud thinning compensates radiatively for increased reflectance from increases in Nd, most apparent near the coast. CloudSat radar re-flectivities do not imply significant aerosol scavenging by precipitation near the coast, indicating that variability in wind transport contributes to the aerosol variability. The co-occurrence of more boundary-layer aerosol/higherNdwithin a more stable atmosphere
20
suggests a boundary layer source for the aerosol, rather than the free troposphere. Along 85◦W, the top-of-atmosphere shortwave fluxes are significantly higher (∼50%) for the MAX-Nd composite than for the MIN-Nd composite, with thicker clouds and higher cloud fractions. The change inNd at this location is small (though positive), so that the composite difference primarily reflects synoptic changes. A one-point spatial
25
ACPD
9, 25523–25564, 2009Synoptic variability of the stratocumulus
deck
D. Painemal and P. Zuidema
Title Page
Abstract Introduction
Conclusions References
Tables Figures
◭ ◮
◭ ◮
Back Close
Full Screen / Esc
Printer-friendly Version
Interactive Discussion tropospheric subsidence. This synoptic impact on offshore cloud properties is arguably
our most radiatively important finding, and draws attention to the free tropospheric meridional flow as a meteorological control.
1 Introduction
The subtropical cloud-capped marine boundary layer has a strong climate impact
5
through the decks’ high solar reflectivity whereas the emitted long-wave radiation re-mains close to that of suface emission under clear skies (Hartmann et al., 1992). A deeper understanding of the processes affecting the radiative properties of maritime warm clouds, both large-scale and microphysical, is necessary for developing confi-dence in future climate predictions. This is becoming particularly important as more
10
aerosol indirect effects become incorporated into climate models. Currently only the cloud albedo effect (∂N∂A
d
lwp,met, or the change in cloud albedo A with cloud droplet
number Nd, all else held constant, Twomey, 1977), is considered in the Intergovern-mental Panel on Climate Change (IPCC) 2007 assessment. Other effects, such as influences on the cloud albedo through changes in liquid water path (LWP) induced by
15
changes inNd(∂(∂Al wp) ∂∂N(lwp)d
met, this includes the cloud lifetime effect, Albrecht, 1989),
are not yet formally included in the IPCC assessment. This acknowledges gaps in our understanding. Current IPCC estimates of a forcing of−1.2 W m−2 for the combined aerosol direct effect and cloud albedo effect alone already exceed an upper-bound residual estimate of −1.1 W m−2 for all aerosol direct and indirect effects combined
20
from a recent observationally-derived energy balance (Murphy et al., 2009).
Examples of how higher aerosol loadings may not necessarily increase cloud re-flectance include Matsui et al. (2006), who associate more aerosol with lower liquid water paths globally, and, similarly, Han et al. (2002). A tenet of the cloud lifetime effect, that higher LWPs are associated with longer cloud lifetimes, has also recently
25
ACPD
9, 25523–25564, 2009Synoptic variability of the stratocumulus
deck
D. Painemal and P. Zuidema
Title Page
Abstract Introduction
Conclusions References
Tables Figures
◭ ◮
◭ ◮
Back Close
Full Screen / Esc
Printer-friendly Version
Interactive Discussion for the observations has come from, among others, Jiang et al. (2002) and Ackerman
et al. (2004), with more discussion in Stevens and Feingold (2009).
Dynamic compensation of aerosol indirect effects, through, for example, changes in the free troposphere conditions, draws attention to the need to control for meteoro-logical forcings, a difficulty in both modeling and observational assessments of
cloud-5
aerosol interactions. Otherwise, large-scale influences that affect both the aerosol and cloud properties can be mistaken as an aerosol influence on clouds. Atmospheric static stability is often chosen as a meteorological control variable, because static stability is known to correlate well with stratocumulus cloud fraction at seasonal scales (Klein and Hartmann, 1993). Matsui et al. (2006) then observed that cloud droplet sizes tend to be
10
the smallest under strong inversions as well as within polluted environments. Mauger and Norris (2007) further examined the static stability of parcel back-trajectories of satellite-derived aerosol and cloud properties, and found that the covaration of aerosol amount and cloud fraction with static stability could be even more significant one to three days previous. Given the typically short time response of clouds to aerosols,
15
however, it is unclear if static stability alone is sufficient as a meteorological control variable (e.g., Klein, 1997).
The southeast Pacific stratocumulus deck is one region where aerosol impacts on cloud microphysics are potentially significant, with Bennartz (2007) and Wood et al. (2008) showing large (>200 cm−3) cloud droplet number concentrations retrieved
20
from MODerate resolution Imaging Spectroradiometer (MODIS) data along the Peru and Chile coast (17◦S–32◦S). Though less clear from satellite imagery, measure-ments taken during the VAMOS Ocean-Coupled-Atmosphere-Land-Study (VOCALS) Regional Experiment provides evidence of anthropogenic emissions as far west as 85◦W (Hawkins et al., 2010). Bennartz (2007) speculated that the downwind
trans-25
Al-ACPD
9, 25523–25564, 2009Synoptic variability of the stratocumulus
deck
D. Painemal and P. Zuidema
Title Page
Abstract Introduction
Conclusions References
Tables Figures
◭ ◮
◭ ◮
Back Close
Full Screen / Esc
Printer-friendly Version
Interactive Discussion though the Andes protect the deck from routine aerosol-laden continental outflow,
high-altitude copper smelters emit sulfate aerosols above the marine boundary layer. The Andes also dictate along-shore winds both at the surface and the lower free tropo-sphere, in principal transporting aerosol from the more developed southern regions to the north. Orography affects the boundary layer depth and increases the difficulty of
5
modeling regional aerosol-cloud interactions accurately, increasing the value of obser-vational analyses (e.g., Zuidema et al., 2009; Wyant et al., 2009).
Holistic regional assessments relying on satellite data, available local data, and re-analyses, such as presented here, can provide a benchmark for modeling efforts with similar goals. In this study, we focus further on the synoptic and microphysical
vari-10
ability of the southeast Pacific stratocumulus region, and attempt to deconvolve the local synoptic impacts on cloud properties from those that are influenced by aerosol variability. Our goal is to address the following questions: 1) what is the meteorol-ogy associated withNd variability? 2) DoNd increases correspond to an enhanced cloud albedo? 3) Do atmospheric conditions favor aerosol incorporation into the cloud
15
through free-tropospheric subsidence, or from within the boundary layer?
We use NCEP/NCAR Reanalysis to depict the large-scale circulation, and assume it is accurate except near the coast, where we also rely on radiosonde data. Cloud properties are derived primarily from MODIS data. Frequently overcast skies, relatively homogenous cloud conditions, and favorable sun-satellite viewing geometries aid the
20
retrievals. Cloud droplet numbers retrieved from satellite serve as an aerosol proxy, taking advantage of frequently overcast skies that make satellite retrievals of clear-sky aerosol properties and its issues (e.g., Loeb and Schuster, 2008) a moot point. The physical connection between aerosol andNd is justified further through comparisons between ship-based aerosol measurements and the satellite retrievals. A composite
25
ACPD
9, 25523–25564, 2009Synoptic variability of the stratocumulus
deck
D. Painemal and P. Zuidema
Title Page
Abstract Introduction
Conclusions References
Tables Figures
◭ ◮
◭ ◮
Back Close
Full Screen / Esc
Printer-friendly Version
Interactive Discussion associated with the largest differences in Nd are likely to reflect synoptic influences,
rather than the effect of cloud-aerosol interactions. Our approach complements more thorough single case studies such as Huneeus et al. (2006) and provides a context for analyses of VOCALS Regional Experiment (VOCALS-Rex, Wood and Mechoso, 2008) data. We selected four October months coincident with NOAA research cruises (2001,
5
2005, 2006 and 2007), while October 2008 coincides with the VOCALS Regional Ex-periment. The dataset, methodology, and ship-satellite comparisons are detailed in Sect. 2, composite results are described in Sect. 3, the regional circulation is discussed in Sect. 4, precipitation characteristics in Sect. 5, and concluding remarks in Sect. 6.
2 Data and methods
10
We combined MODIS Collection 5 cloud effective radius (re) and cloud optical thick-ness (τ) retrievals (Platnick et al., 2003) to produce values for Nd and cloud depth (Hsat), and used a temperature threshold of 273 K to select for warm, liquid-only clouds. Instantaneous swath data (level 2) from both the Terra and Aqua platforms (∼10:30 LT and ∼13:30 LT overpasses, respectively) were used for the validation comparisons
15
shown in Sect. 2.2. These comparisons draw on a more comprehensive database of in-situ observations from six NOAA cruises (October, 2001, 2005, 2006, 2007, and November, 2003 and December, 2004). In contrast the composite analysis relies on daytime Terra level 3 data at 1◦×1◦spatial resolution for only the October months. At this latitude, the daily-mean values for each platform are effectively regridded
individ-20
ual swath data. The daytime Terra overpass was previously found to be the overpass most representative of daily-mean conditions (Zuidema et al., 2009). MODIS cloud top temperatures, derived from separate day and nighttime 11µm equivalent brightness temperatures, were used to estimate a satellite cloud top height, and rely on a depth-varying lapse rate inferred from the cruise radiosondes (Zuidema et al., 2009). These
25
ACPD
9, 25523–25564, 2009Synoptic variability of the stratocumulus
deck
D. Painemal and P. Zuidema
Title Page
Abstract Introduction
Conclusions References
Tables Figures
◭ ◮
◭ ◮
Back Close
Full Screen / Esc
Printer-friendly Version
Interactive Discussion Estimates of the shortwave fluxes (SW) at the top of the atmosphere were obtained
from the Clouds and Earth’s Radiant Energy System (CERES, Wielicki et al., 1996) instrument on board the Terra platform. The CERES data allow a net radiative assess-ment of the combined microphysical and macrophysical changes that is somewhat independent of plane-parallel theory. We used the radiometric measurements from
5
the shortwave channel (0.3–5µm), and spatially averaged Single Scanner Footprint data to a 1◦×1◦ spatial resolution. These data were only available for October 2001, 2005, and 2006. The occurrence of precipitation was determined from CloudSat radar reflectivity data (the Cloud-Geometrical-Profile product; Stephens et al., 2002) from October 2006, 2007 and 2008. Surface winds were provided by the satellite
scatterom-10
eter QuikSCAT at a 0.25◦×0.25◦resolution; we only used the evening pass (18:00 LT) data. Non-satellite data sources are the NCEP/NCAR reanalysis (Kalnay et al., 1996) meteorological fields, with a horizontal resolution of 2.5◦×2.5◦, and daily radiosonde observations at Antofagasta (23.43◦S, 70.43◦W, 120 a m.s.l.) at 12:00 UTC (08:00 LT).
2.1 Basic relationships
15
MODIS retrievals of cloud optical depth and effective radius are routinely available, but small droplet sizes do not unambiguously indicate aerosol loading, becausere is also a function of distance above cloud base (e.g., Schuller et al., 2003). Instead, we esti-matedNd and Hsatfrom a combination ofreandτassuming adiabatic conditions (e.g. Bennartz, 2007; Szczodrak et al., 2001). This allows a separation of macrophysical
20
and microphysical cloud property measures, and in addition facilitates a comparison to the ship-based measurements ofNa andHship.
The aerosol number concentrationNais a direct measurement. We typically rely on data from a Particle Measuring System Lasair-II instrument, which measures all parti-cles greater than 0.1 microns, but does not control for humidity. For the 2004 cruise,
25
ACPD
9, 25523–25564, 2009Synoptic variability of the stratocumulus
deck
D. Painemal and P. Zuidema
Title Page
Abstract Introduction
Conclusions References
Tables Figures
◭ ◮
◭ ◮
Back Close
Full Screen / Esc
Printer-friendly Version
Interactive Discussion a ceilometer cloud base and inversion-derived cloud top. Such a comparison builds
on previous assessments showing good correspondence between liquid water paths (LWPs) derived from MODIS data using the adiabatic approximation (LWP=59ρwre·τ;
ρwis the density of the liquid water) and satellite microwave-derived values for overcast marine stratocumulus (e.g., Borg and Bennartz 2007; Seethala and Horvath, 2009).
5
A satellite-derived cloud depth Hsat also invokes the adiabatic lapse rate for liquid water content,Γad. Evaluation of sounding-derived values forΓadreveal that the lower, warmer coastal clouds have typical values between 2.1–2.3×10⁻³g m−4, while clouds west of 75 ˚ W have values of 1.8–2.0×10⁻³g m−4. Near-coastal liquid water content profiles in VOCALS-REx aircraft data often show diminished values near cloud top
10
because of cloud top entrainment, which reduces the effectiveΓad, while profiles from further offshore are close to adiabatic (see also Zuidema et al., 2005). With this in mind, we rely on a constantΓad value of 2.0×10
−3
g m−4, and approximate its uncertainty at
10%. Hsat is then estimated from the adiabatically-derived LWP using LWP=ΓadHsat2
2 as
Hsat=
s
2
Γad 5
9ρw·re·τ (1)
15
and cloud droplet concentration through
Nd= Γ1ad/2 10 1/2
4πρ1w/2k
·τ 1/2
re5/2
(2)
following Szczodrak et al. (2001). The parameterk corresponds to the ratio between the volume mean radius and the effective radius and is assumed constant at 0.8.
For overcast, opaque, mostly unbroken, warm cloud pixels, the error inHsatfrom its
20
ACPD
9, 25523–25564, 2009Synoptic variability of the stratocumulus
deck
D. Painemal and P. Zuidema
Title Page
Abstract Introduction
Conclusions References
Tables Figures
◭ ◮
◭ ◮
Back Close
Full Screen / Esc
Printer-friendly Version
Interactive Discussion most suspect in broken cloud conditions, whererecan be systematically overestimated
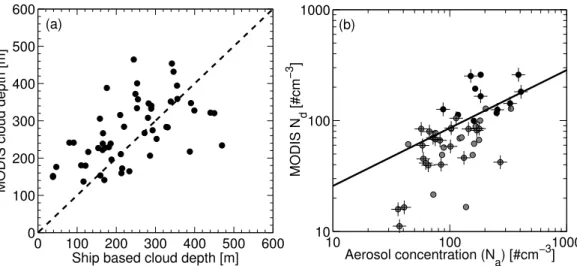
(e.g., Marshak et al., 2006). We observed that lowNd values tended to be associated with high-LWP clouds (not shown), which are more likely to precipitate and be inho-mogeneous, and also observed a poor correspondence to the surface-based aerosol measurements for the lower values ofNd (e.g., Fig. 1b). We attempt to minimize the
5
impact of cloud inhomogeneities upon theNd retrieval by limiting our quantitative anal-ysis toNd values>50 cm−3for overcast (or nearly so) pixels. We estimate the error in thisNd subsample at 25% based on the input errors inτ,re andΓad. This is less con-servative than the uncertainty estimate of 50% within Bennartz (2007), but is justified by our more restricted, regional dataset.
10
2.2 Satellite-ship comparisons
Hsat and Nd derived from instantaneous level 2 data were spatially averaged over an area of 25 km by 25 km, corresponding to a 7 m s−1“frozen turbulence” advective speed
over one hour. The ship-based cloud depth (Hship) is computed as the difference be-tween the radiosonde inversion base height (placed at the temperature minimum;
ra-15
diosondes were launched at either 4 or 6 h intervals) and hourly-averaged ceilometer cloud base heights. Comparisons were restricted to the one-hour time periods span-ning the radiosondes.
HsatandHshipvalues correlate well with each other (r=0.54), increasing to 0.7 when restricting the sample toHship<400 m and to overcast periods (ceilometer hourly cloud
20
fractions>90%) (Fig. 1a; only overcast periods are shown). Hsat values often exceed
Hship, with a mean bias of 59 m forHship<400 m, seemingly indicating superadiabatic LWPs. Schuller et al. (2003) also found a similar bias between remote sensed and in-situ cloud depth; an explanation is currently lacking. Further cloud depth values shown here rely on Eq. (1) as given and do not correct for this bias.
25
ACPD
9, 25523–25564, 2009Synoptic variability of the stratocumulus
deck
D. Painemal and P. Zuidema
Title Page
Abstract Introduction
Conclusions References
Tables Figures
◭ ◮
◭ ◮
Back Close
Full Screen / Esc
Printer-friendly Version
Interactive Discussion cloud fractions towards increasing the data sample. Most of the aerosol concentration
measurements were taken near 85◦W and 20◦S, with a limited sampling near the coast. Nd and Na show an obvious correlation (r=0.65, increasing to 0.8 for hourly-mean ceilometer cloud fractions>0.9), withNd typically< Na, demonstrating physical consistency. The values of both Nd and Na are higher when sampled closer to the
5
coast (east of 80◦
W, black filled circles in Fig. 1b).
A quantitative assessment of the observedNd−Narelationship can be done through its measure of aerosol activation, expressed through an aerosol cloud index dlnNd
dlnNa
(Mc-Comiskey et al., 2009). We restrict the data samples to Nd >50 cm−3 as a proxy for non-precipitating clouds and to control for overestimates in the effective radius
re-10
trievals caused by cloud inhomogeneities. We find a best-fit value for dlnNd
dlnNa of 0.53. For comparison, Pruppacher and Klett (1997) suggest a value of 0.7 for dlnNd
dlnNa based on droplet activation theory, while McComiskey et al. (2009) find an empirical value of 0.48 using cloud microphysical retrievals from surface-based remote sensors of marine stratocumulus clouds at Pt. Reyes, CA. Quaas et al. (2009) find a sensitivity of
MODIS-15
derivedNd to the aerosol optical depth at Pt. Reyes that is close to the corresponding surface-based value.
Comparison to other published values of dlnNd
dlnNa must take many factors into account.
McComiskey et al. (2009) document a strong reduction with increasing scale, for ex-ample. Nevertheless, our value is fairly high despite the field-of-view differences and
20
the large scale. Moreover, 42% of our variation inNd is explained by the aerosol con-centration variability, compared to 15% for McComiskey et al. (2009). Some of the ex-planation is provided by Fig. 2, for which daily maps of TerraNd and LWP values were averaged over the five October months. Many of the higherNd values are associated with thinner clouds (LWP<90 g/m2, contours in Fig. 2) that are less likely to be drizzling
25
(e.g., Leon et al., 2008) and more likely to be adiabatic if offshore (e.g., Zuidema et al., 2005). For such clouds, values of dlnNd
dlnNa are typically higher (McComiskey et al.,
ACPD
9, 25523–25564, 2009Synoptic variability of the stratocumulus
deck
D. Painemal and P. Zuidema
Title Page
Abstract Introduction
Conclusions References
Tables Figures
◭ ◮
◭ ◮
Back Close
Full Screen / Esc
Printer-friendly Version
Interactive Discussion thereby Nd retrieval, which will be more pronounced for thicker, more broken clouds
with naturally higher re, may also contribute to a higher value for dlnNd
dlnNa by artificially
lowering low values ofNd even further.
3 Observational composites
The instantaneous satellite-ship comparisons of cloud depth and cloud droplet
num-5
ber in Sect. 2, and for satellite-derived cloud top heights within Zuidema et al. (2009), provide confidence in the ability of the MODIS retrievals to represent the stratocu-mulus macro- and microphysics. The random error is further reduced by averaging over many samples within the composite. Our composite analysis is based on the Terra-daytime-overpass, one degree spatial resolution (level 3)Nd variability over the
10
apparently most-polluted region, the Arica Bight, defined here to span 71.5◦W–75.5◦W and 18.5◦S–25.5◦S (box in Fig. 2). Only scenes deemed overcast over the Arica Bight were used, defined through at least 70% overcast satellite pixels. Such overcast days occurred on 77% (120 days) of the total days. As seen in Fig. 2, mean LWP values are small (<70 g m−2) over the region with the largestN
d.
15
Days are composited by the spatial-meanNdover the Arica Bight into the MAX (Nd> 215.8 cm−3) and MIN (Nd<161.6 cm−3) highest and lowest terciles of total overcast days (40 and 42 each) respectively. For the October, 2008, VOCALS-REx time period, the NCAR C-130 research flights RF01 and RF02 (15 and 18 October) occurred within the only MAX composite case lasting six days, and RF03 occurred one day later (21
20
October). C-130 research flights RF04 (23 October), RF05 (25 October), and RF06 (28 October) were within one day of MIN-Nd composite days, and RF07 (31 October) coincided with a MIN-Nd composite day. Of the Twin Otter flights, the first three (16, 18, and 19 October) coincided with MAX cases, and the 24 and 29 October flights coincided with MIN cases.
ACPD
9, 25523–25564, 2009Synoptic variability of the stratocumulus
deck
D. Painemal and P. Zuidema
Title Page
Abstract Introduction
Conclusions References
Tables Figures
◭ ◮
◭ ◮
Back Close
Full Screen / Esc
Printer-friendly Version
Interactive Discussion MAX-MINNd composite differences (Fig. 3, colors) are a maximum by construction
between 18◦S–27◦S with values higher than 120 cm−3, and a westward extension of about 8◦. The climatological-meanNd values are a maximum further north near 20◦S, but the changes are smaller. Cloud droplet number concentrations along the Peruvian coast (north of 15◦S) are slightly higher within the MIN-Nd composite than the MAX-Nd
5
composite (negative values in Fig. 3). Near Antofagasta (23.43◦S; small black square) the Nd changes reach their maximum value of 160 cm−3. MAX-MIN Nd composite differences in LWP reveal decreased LWPs east of 85◦W (∼20 g m−2) during the
MAX-Nd composite, along with increased LWPs (10–30 g m−2) west of 85◦W (Fig. 3). Time series of surface winds, cloud top heights, and geopotential height indicate the
10
synoptic timescale of MAX/MINNd composite days and anticipate general differences (Fig. 4). Mean surface wind speeds (20◦S–30◦S, 70◦W–100◦W), mean cloud top heights alongshore (20◦S–30◦S, 70◦W–80◦W), and mean offshore 500 hPa geopo-tential height (15◦S–35◦S, 70◦W–100◦W, approximately the location of the climato-logical anticyclone) are shown along with the occurrence of MAX (dark triangles) and
15
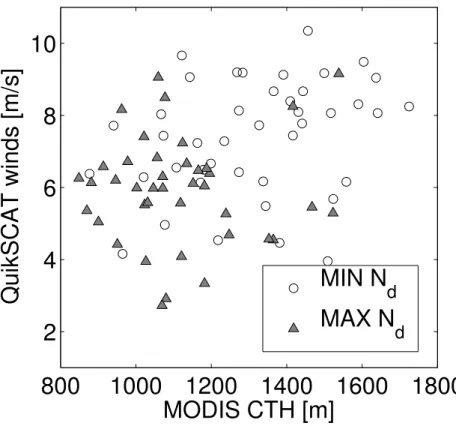
MIN (open triangles) Nd days. About one-half (two-thirds) of the MIN/MAX Nd days occur in groups of three or more days. MAXNd days are more likely to be associated with weaker winds (Fig. 4a), shallower coastal boundary layers (Fig. 4b) and enhanced offshore mid-tropospheric geopotential heights (Fig. 4c). This synoptic grouping and its variability is further evident in Fig. 5: MAX (MIN) Nd days co-occur with weaker
20
(stronger) coastal winds and lower (higher) cloud tops near shore. Some interannual variability is evident as well, with more MINNd cases occurring during 2007, coinciding with a weak cool ENSO phase, and more MAX Nd cases than MIN Nd cases occur-ring duoccur-ring 2001 and 2008, when more intense observational campaigns, the Eastern Pacific Investigation of Climate (Bretherton et al., 2004) and VOCALS-REx, visited the
25
ACPD
9, 25523–25564, 2009Synoptic variability of the stratocumulus
deck
D. Painemal and P. Zuidema
Title Page
Abstract Introduction
Conclusions References
Tables Figures
◭ ◮
◭ ◮
Back Close
Full Screen / Esc
Printer-friendly Version
Interactive Discussion
3.1 Satellite
The regional circulation patterns associated with each composite are shown in Fig. 6 (panels a and b, respectively). The anticyclone is strengthened offshore (85◦W–95◦W) during the MINNd composite, with stronger surface winds and a strengthened coastal jet near 33◦S (Fig. 6b). Surface winds are light within both composites at the northern
5
end of the Arica Bight, where changes inNd are also modest. Mean October values along with MAX-MINNd composite difference values are shown for the MODIS-derived cloud top height (Fig. 6c), cloud depth (Fig. 6d), cloud fraction (Fig. 6e), and top-of-atmosphere CERES shortwave fluxes (Fig. 6f). These reveal shallower boundary layer depths for the MAXNd composite, by 200 m to 350 m, over a broad domain extending
10
beyond the Arica Bight (Fig. 6c). Over the Arica Bight and along 80◦W, these changes are associated with thinner clouds for the MAXNd composite (Fig. 6d), by up to 50 m. West of 80◦W, the pattern reverses, and clouds are slightly thicker for the MAX Nd composite than for the MINNd composite.
The mean MODIS cloud fraction is a maximum parallel to the Peruvian coast
(con-15
tours, Fig. 6e), with the mean values in the top-of-atmosphere shortwave fluxes fol-lowing a similar spatial pattern (Fig. 6f). The composite differences show that cloud fractions are diminished by about 5% over the Arica Bight for the MAX composite rel-ative to the MIN composite, remain approximately the same offthe coast of Peru, and increase significantly elsewhere – by up to 20% near 85◦
W, 25◦
S. The variation in
20
the top-of-atmosphere shortwave fluxes (Fig. 6f) are broadly consistent with the cloud fraction changes. Over the Arica Bight, the MAX-MIN composite change in top-of-atmosphere SW fluxes is negative near the coast, and increases 500 km offshore. This reflects the compensation between increased brightening due to a higherNd, and de-creased brightening from a thinner cloud. Near the coast the cloud thinning ends up
25
ACPD
9, 25523–25564, 2009Synoptic variability of the stratocumulus
deck
D. Painemal and P. Zuidema
Title Page
Abstract Introduction
Conclusions References
Tables Figures
◭ ◮
◭ ◮
Back Close
Full Screen / Esc
Printer-friendly Version
Interactive Discussion albedo. Further south, the increase in cloud fraction over the Chilean coastal jet for
the MAXNd composite corresponds with an increase of approximately 50 W m
−2
in the top-of-atmosphere shortwave fluxes, but over a region with small mean cloud fraction. The most dramatic changes in the fluxes are observed away from Arica Bight along 85◦W, however, and are primarily associated with cloud fraction differences, with only
5
small changes in the cloud droplet numbers.
3.2 Radiosonde
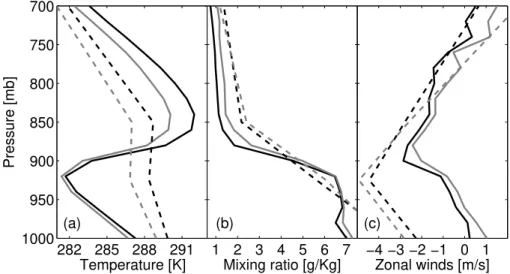
Composites of radiosondes from Antofagasta (23.43◦S, 70.43◦W; 12:00 UTC or 08:00 LT) help us interpret the satellite composites near the location of maximumNd variability (Fig. 7). This is particularly valuable because the NCEP/NCAR Reanalysis
10
is deemed less reliable near the South American coastline. At the Antofagasta loca-tion, the MAX Nd composite satellite-derived cloud top heights are lower, the cloud are thinner, and the MODIS cloud fraction is decreased. The changes at Antofagasta are broadly representative of the Arica Bight region (Fig. 6). The radiosonde tempera-ture profiles confirm that the MAXNd cases are typically associated with a shallower
15
boundary layer (Fig. 7a, solid black line). The main difference between the profiles occurs in the free troposphere, with the MAXNd radiosonde composite possessing a warmer, drier free troposphere than the MINNd composite.
The implication of increased subsidence for the MAXNd composite is supported by the structure of the observed zonal winds. While the zonal winds are weak for both
20
cases, offshore easterlies above the inversion are slightly stronger for the MAX com-posite (Fig. 7c, solid lines), consistent with increased subsidence and divergence at the inversion. The corresponding Reanalysis profiles, shown for a location approxi-mately 500 km offshore, depict the boundary layer weakly. The vertical placement of the temperature and moisture inversion is approximately correct, but the underestimate
25
ACPD
9, 25523–25564, 2009Synoptic variability of the stratocumulus
deck
D. Painemal and P. Zuidema
Title Page
Abstract Introduction
Conclusions References
Tables Figures
◭ ◮
◭ ◮
Back Close
Full Screen / Esc
Printer-friendly Version
Interactive Discussion MAX and MIN ReanalysisNd zonal wind composites differs from the radiosonde
com-posites, with greater offshore lower-tropospheric flow for the MIN Renalysis composite, while the radiosondes show greater offshore lower-tropospheric flow for the MAX com-posite.
4 Regional circulation
5
The synoptic conditions associated with the two composites provides insight into the spatial extent of the subsidence changes identified in the radiosonde composites, and into the cloud property changes shown in Figs. 2–7. The important meteorological parameters governing stratocumulus cloud behavior at daily/synoptic time scales are not well-established (e.g., Klein, 1997; Zhang et al., 2009), although Reanalysis lower
10
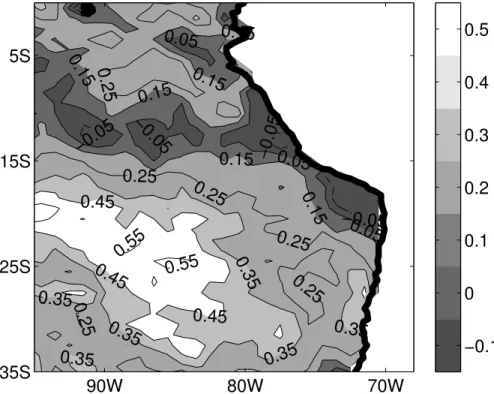
tropospheric stability is an often-used proxy (e.g., Mauger and Norris, 2007; Matsui et al., 2006). Here we defined the static stability through the difference between potential temperature (θ) at 850 hPa and 1000 hPa. This estimate was found to correlate better with MODIS cloud fraction than a static stability difference based on θ700hPa, as can be intuited from Fig. 7a. A spatial map of the correlation at daily time scales between
15
θ850hPa –θ1000hPa and MODIS cloud fraction (Fig. 8) shows the highest positive corre-lation at 85◦W and 25◦S (r=0.55), which is higher than that reported for the northeast Pacific at 30◦
N, 140◦
W usingθ700hPa –θsurface(r=0.22; Klein, 1997). The correlation is insignificant over the Arica Bight, also expected based on Fig. 7.
Figure 9 shows mean values ofθ850hPa–θ1000hPa(contours) along with the
compos-20
ite differences (greyscale). Higher mean static stabilities occur approximately where mean MODIS cloud fractions (Fig. 6e) are higher. The largest static stability difference between the two composites occurs near the southern boundary of the stratocumulus deck, at approximately 30◦
S, 75–77◦
W, near if slightly east of the highest compos-ite differences in cloud fraction (Fig. 6e). The stability changes are large in the same
25
ACPD
9, 25523–25564, 2009Synoptic variability of the stratocumulus
deck
D. Painemal and P. Zuidema
Title Page
Abstract Introduction
Conclusions References
Tables Figures
◭ ◮
◭ ◮
Back Close
Full Screen / Esc
Printer-friendly Version
Interactive Discussion One approach to identifying meteorological influences on cloud-aerosol interactions
is to use back-trajectories (e.g., Mauger and Norris, 2007), but these are fraught for the southeast Pacific by the poor reanalysis representation of the coastline. Instead, we performed a one-point linear correlation analysis using the 850 hPa temperature time series at 20◦S and 75◦W as the reference point (Fig. 10 filled square; note this is
5
approximately 300 km west of the Twin Otter point Alpha destination during VOCALS-REx). This essentially substitutesθ850hPa variability for the static stability variability at short time scales, justified by the strong influence of the sea surface temperature upon
θ1000hPa. The 850 hPa temperature time series at 20◦S and 75◦W was correlated with the 850 hPa geopotential height, subsidence and wind field time series at all other
re-10
analysis grid points (Fig. 10). The one-point correlation analysis reveals an anomalous trough to the west of South America, with enhanced subsidence near the coast and weakened subsidence offshore. Increases in the 850 hPa geopotential height between 75◦–85◦W are associated with anomalous northerly winds allowing the 850 hPa tem-perature to increase (i.e., free tropospheric cold temtem-perature advection from the south
15
is reduced), elevating the static stability and increasing cloud coverage. An example of the opposite behavior is discussed in Wyant et al. (2009) for mid-October, 2006, when enhanced southerly winds above the inversion corresponded to a decrease in cloud coverage and increase in a boundary-layer deepening at 85◦W, 20◦S. Apparent in Fig. 10 is that the disturbances are associated with mid-latitude intrusions as
op-20
posed to equatorial intrusions, with the composite analysis preferentially selecting for different lifestages of baroclinic intrusions.
Figure 10 would suggest that warmer 850 hPa temperatures at 20◦S and 75◦W are correlated to increased subsidence at point Alpha (20◦
S and 72◦
W) and near the coast, as is confirmed by the Antofagasta radiosondes. The spatial structure of the 700 hPa
25
ACPD
9, 25523–25564, 2009Synoptic variability of the stratocumulus
deck
D. Painemal and P. Zuidema
Title Page
Abstract Introduction
Conclusions References
Tables Figures
◭ ◮
◭ ◮
Back Close
Full Screen / Esc
Printer-friendly Version
Interactive Discussion with the changes in the climatological anticyclone shown in Fig. 6. Perhaps
coun-terintuitively, the increased cloud coverage at 85◦W during the MAX-Nd composite is associated with weaker subsidence. While an increased subsidence-decreased cloud fraction relationship is not necessary surprising at short time scales (e.g., Zhang et al., 2009), it does run counter to intuition built from monthly-mean analyses (e.g., Bony and
5
Dufresne, 2005). Figure 11 allows the reduction in subsidence to be interpreted in its larger context, and highlights the meteorological importance of the 850 hPa meridional winds to the southeast Pacific stratocumulus coverage.
Previous studies have associated weaker surface winds at 33◦S and 73◦W with reduced cold surface temperature advection, in turn reducing cloud liquid water path
10
and cloud fraction north of 20◦S (Xu et al., 2004; Mu ˜noz and Garreaud, 2005; Wood et al., 2008). This contrasts with our finding that weaker alongshore winds cooccur with an increase in offshore cloud cover. The explanation may lie in our greater focus on submonthly synoptic activity and analysis of only October months, whereas the previous studies examined longer time spans that probably also captured seasonal
15
changes. Our compositing appears to preferentially select for lifestages of mid-latitude baroclinic waves intruding upon the stratocumulus deck.
Our October 2008 MAXNd cases ended when a mid-latitude trough moved through the region, while the October 2008 MIN Nd cases loosely coincided with baroclinic troughs (R. Garreaud, 2nd VOCALS Meeting). Warmer temperatures during the MAX
20
Ndcomposite relative to the MINNd composite extend fully throughout the troposphere (not shown), indicating a quasi-barotropic structure with an anomalous anticyclonic circulation. We investigated how this related to other synoptic phenomena besides troughs, in particular the coastal lows and cut-offlows previously documented for this region. The stronger coastal subsidence and slightly stronger coastal easterlies during
25
ACPD
9, 25523–25564, 2009Synoptic variability of the stratocumulus
deck
D. Painemal and P. Zuidema
Title Page
Abstract Introduction
Conclusions References
Tables Figures
◭ ◮
◭ ◮
Back Close
Full Screen / Esc
Printer-friendly Version
Interactive Discussion coastal-low easterlies identified in Huneeus et al. (2006), and the region south of 25◦S
is marked by an increase in cloud coverage, rather than a decrease. In addition, al-though more of our MIN Nd episodes last only one day compared to the MAX Nd
cases, the number of episodes lasting three or more days is the same for both com-posites (five) – longer than for typical coastal low events. Nevertheless, our high/low
5
Nd composites in some ways resemble the ending/leading edge of coastal lows, and the common occurrence of both suggests there must be some common associations.
In contrast to coastal lows, cutoff-lows are upper-level low pressure centers with a quasi-barotropic structure (e.g., Fuenzalida et al., 2005) and thus seem similar to our MINNd composite. In addition, cutoff-lows can be preceeded by quasi-stationary
10
ridging reminiscent of our MAX Nd composite, with a duration exceeding that of the coastal lows. Cutoff-lows could be considered more intense manifestations of the upper-tropospheric potential vorticity perturbations identified through our composites. Although beyond the scope of the current work, the connection between cut-off lows and our composites seems worthy of further investigation.
15
5 Precipitation characteristics
We further examined CloudSat radar reflectivities for insight into precipitation impacts on an aerosol budget. Reflectivity-height distributions were constructed for both com-posites for all Cloudsat data within 17◦–27◦S and 70◦–80◦W, an area slightly broader than the Arica Bight. The MAXNd reflectivity-height distribution is narrower, centered
20
near−25 dBZ and 1000 m, than the MIN Nd distribution (Fig. 12 a and b). For both composites, however, the most frequently occurring reflectivities are around−25 dBZ with heights between 800 m and 1200 m. Few pixels have reflectivities>0 dBZ, equiv-alent to a cloudbase rain rate of∼2 mm day−1 (Comstock et al., 2004). Approximately one-sixth and one-third of the MAX/MIN Nd pixels exceed −17 dBZ (Table 1),
equiv-25
alent to a cloudbase rainrate of 0.01 mm day−1. The low radar reflectivities for both
ACPD
9, 25523–25564, 2009Synoptic variability of the stratocumulus
deck
D. Painemal and P. Zuidema
Title Page
Abstract Introduction
Conclusions References
Tables Figures
◭ ◮
◭ ◮
Back Close
Full Screen / Esc
Printer-friendly Version
Interactive Discussion (Fig. 6d, contours). The slightly higher reflectivity values for the MIN Nd distribution
are consistent with the deeper clouds and higher cloud tops and do indicate some drizzle, but for the MAX Nd distribution, hypotheses for cloud thinning based on de-pletion through precipitation seem discouraged (by the lack of observed precipitation). For the coastal clouds, little cloud thinning from precipitation is anticipated, based on a
5
finding that offshore clouds do not become sub-adiabatic until liquid water paths reach ∼150 g/m3and the frequency of occurrence of cloud radar reflectivities>0 dBZ reaches 20% (Zuidema et al., 2005; Fig. 10). This finding will need to be modified for coastal conditions, however, to account for higherNd and stronger cloud top entrainment.
A CloudSat reflectivity-height distribution was also constructed for the offshore
re-10
gion with the most pronounced change in cloud fraction between the two composites, defined by 20◦
–30◦
S and 80◦
–90◦
W (Fig. 12c and d). A greater percentage of the off -shore pixels are precipitating (reflectivities higher than−17 dBZ), consistent with Leon et al. (2008). The substantial increase in offshore cloud fraction for the MAXNd com-posite is associated with only a slight shift towards lower radar reflectivities (Table 1).
15
Fewer of the MAXNd CloudSat pixels have reflectivities >−17 dBZ than the MINNd
CloudSat pixels, but the discrepancy is less than between the near-shore CloudSat composites. In addition, the percentage of pixels>0 dBZ is approximately the same for both offshore composites. Instead, since theNd difference is small between the two offshore composites, the more pronounced differences in the reflectivity distributions
20
between the near-shore and off-shore composites could be indicative of the impact of aerosols as well as changes in liquid water path (Kubar et al., 2009). In addition, we note the minor change in cloud top height between the offshore MAX and MINNd com-posites, in spite of the large change in large fraction. There is a strong east-west spatial gradient to the cloud top height changes (Fig. 6c), but overall is consistent with some
25
ACPD
9, 25523–25564, 2009Synoptic variability of the stratocumulus
deck
D. Painemal and P. Zuidema
Title Page
Abstract Introduction
Conclusions References
Tables Figures
◭ ◮
◭ ◮
Back Close
Full Screen / Esc
Printer-friendly Version
Interactive Discussion
6 Conclusions and discussion
We have applied satellite retrievals to understand how synoptic conditions can change cloud droplet number concentrations. We focused on October months only, to reduce influences from the seasonal cycle. Several of the MAX/MIN cases occurred within a day of VOCALS-REx C-130 flights (RF01-03 15–21 October/RF04-RF07 23–28
Octo-5
ber, respectively); our analysis can provide context for the VOCALS-REx observations. Comparisons between ship-based and MODIS-derived cloud depth estimates, and of ship-based aerosol concentration to MODIS-derived Nd values establish faith in the satellite retrievals and suggest the aerosol present are readily activated.
Episodes with highNdover the Arica Bight are associated with a weaker anticyclone,
10
weaker surface and free-tropospheric winds, and thinner clouds, also shown by Wood et al. (2008). We also find higher cloud droplet numbers are associated with more stable atmospheres, similar to Mauger and Norris (2007) and Matsui et al. (2006). In addition, we show that higher Nd values over the Arica Bight are concurrent with lower cloud top heights, consistent with greater subsidence (Fig. 7) and/or a weaker
15
mesoscale convergence in the boundary layer (Zuidema et al., 2009). The horizon-tal temperature advection reinforces the vertical temperature advection of subsiding, adiabatically-warming air (as deduced from Fig. 10). Smaller differences in Nd occur near 18◦S, where the wind speeds are smaller and less variable, allowing aerosols to stagnate. Changes in top-of-atmosphere shortwave fluxes show a spatial gradient, with
20
thinner clouds near the coast dominating a reduction in shortwave reflectance, while 500 km offshore, the increase in cloud droplet number accounts for a slight increase in shortwave reflectance (Fig. 6f). CloudSat cloud radar reflectivity distributions differ between the MAX and MINNd composites, with the MAXNd composite in particular indicating little precipitation (Table 1).
25
ACPD
9, 25523–25564, 2009Synoptic variability of the stratocumulus
deck
D. Painemal and P. Zuidema
Title Page
Abstract Introduction
Conclusions References
Tables Figures
◭ ◮
◭ ◮
Back Close
Full Screen / Esc
Printer-friendly Version
Interactive Discussion deck. In addition, the stronger subsidence associated with the higher boundary layer
aerosol concentrations will discourage entrainment of free-tropospheric aerosol (Jiang et al., 2002). Rather, the radiosondes suggest that advection of warmer, drier free tropospheric continental air by slightly stronger easterlies during the MAX Nd cases strengthens the cloud top temperature inversion and decreases the boundary layer
5
height. This discourages entrainment and traps aerosols already in the boundary layer, with remaining entrainment promoting cloud thinning (e.g., Ackerman et al., 2004). On a 3–4 day synoptic timescale, the enhanced stability furthers multi-day aerosol trans-port within the boundary layer from the south, in evidence in Wood et al. (2008), and highNd conditions can be expected to correlate with enhanced stability from previous
10
days, similar to Mauger and Norris (2007). The aerosol source may then be more likely to be situated in the more developed southern region of Chile, and could in-clude non-point-source pollution from Santiago, Chile (33.3◦S and 70.5◦W) that has been brought out to sea. Consistent with this, higher aerosol loadings were sampled between 27◦S–30◦S during VOCALS-REx C130 flights RF11 and RF12 than further
15
north, and in general the highest variability in the cloud droplet concentration is found between 25◦S–28◦S (Fig. 3). Wind transport appears important forNd variability.
Approximately one-fourth of potential daily cases were excluded because they did not satisfy our criteria for overcast conditions over the Arica Bight. Given that thinner clouds are associated with the high-Nd composite, the days with low cloud cover over
20
the Arica Bight are more likely to resemble the high-Nd cases. Further south, around 30 ˚ S, these days are associated with increased cloud cover, a deeper boundary layer and deeper clouds, and resemble the aftermath of the coastal lows described by Gar-reaud et al. (2002) and GarGar-reaud and Rutllant (2003). The leading edge of the∼2 day coastal low events encourage conditions conducive to pollution trapping in Santiago,
25
un-ACPD
9, 25523–25564, 2009Synoptic variability of the stratocumulus
deck
D. Painemal and P. Zuidema
Title Page
Abstract Introduction
Conclusions References
Tables Figures
◭ ◮
◭ ◮
Back Close
Full Screen / Esc
Printer-friendly Version
Interactive Discussion doubtedly impact the southerly manifestation of the high/lowNd composites discussed
here.
Huneeus et al. (2006) analyzed strong easterly events at Antofagasta (700 hPa zonal winds >5 m s−1) during austral winter, finding a connection between one episode of upper-level easterlies and the increase of Nd. This suggested a connection to two
5
important copper smelters, Chuquicamata (22.3◦S, 68.9◦W) and Potrerillos (26.4◦S, 69.5◦W), that are both above the boundary layer (2700 m and 2850 m a.s.l. respec-tively). In this study we did not find any event with easterly winds of that magnitude; possibly they are sporadic during austral spring when the midlatitude weather distur-bances are less intense.
10
Further offshore along 85◦W, a large increase in cloud fraction and top-of-atmosphere shortwave fluxes is evident in the MAXNd composite. This is synoptic, driven by mid-latitude baroclinicity rather than from the equator. As revealed in a one-point correlation map (Fig. 10), an anomalously warm 850 hPa temperature near the coast is associated with an offshore trough-like pattern that enhances coastal
sub-15
sidence but encourages free-tropospheric ascent offshore. The pattern reflects that of an intrusion by a mid-latitude baroclinic wave, rather than an equatorial source. Anomalous northerly winds along 85◦
W allow the above-inversion temperature to in-crease and inin-crease the static stability, which is well-correlated with cloud fraction at this location. A similar synoptic episode is discussed in Wyant et al. (2009), but with
20
a reduction of offshore cloud fraction associated with a deeper boundary layer and stronger southerlies. Our more comprehensive analysis indicates that the behavior of the free-tropospheric meridional wind at 85◦W is dominant in establishing the south-east Pacific stratocumulus cloud coverage at synoptic timescales. This points to the importance of mid-latitude synoptic intrusions into the subtropical stratocumulus deck,
25
ACPD
9, 25523–25564, 2009Synoptic variability of the stratocumulus
deck
D. Painemal and P. Zuidema
Title Page
Abstract Introduction
Conclusions References
Tables Figures
◭ ◮
◭ ◮
Back Close
Full Screen / Esc
Printer-friendly Version
Interactive Discussion cloud cover is associated with widespread decreases in cloud top height, because the
anomalous horizontal warm temperature advection above the inversion is more than compensating for the decrease in subsidence. The albedo increase from the increase in cloud cover, along with an albedo decrease from near-coastal cloud thinning, means that a spatial gradient in albedo along 20◦S will be difficult to detect in some
VOCALS-5
REx aircraft flights.
The most significant features of the circulations associated with the two composites are highlighted in a schematic (Fig. 13).
Several avenues for further work present themselves. The implications of our data for albedo susceptibilityd(A)/d(Nd) still need to be assessed. New reanalyses (e.g.,
10
Year of Tropical Convection; ERA-Interim; NCEP Climate Forecast System Reanalysis and Reforecast) with better resolution of the orography and of the physical processes will allow for more confident investigations of near-coastal aerosol-cloud interactions. Further investigation of the connection of our composites to the synoptic climatology of the southeast Pacific will also help us better determine the impact of future climates
15
upon this region, arguably the largest subtropical stratocumulus deck on the planet.
Acknowledgements. Funding support from the NOAA Climate Prediction Program for the Americas (Grant NA06OAR4310056) and from the National Science Foundation (Grant ATM-0745470) is gratefully acknowledged.
References
20
Ackerman, A., Kirkpatrick, M., Stevens, D., and Toon, O.: The impact of humidity above strati-form clouds on indirect aerosol climate forcing, Nature, 432, 1014–1017, 2004.
Albrecht, B.: Aerosol, clouds microphysics, and fractional cloudiness, Science, 245, 1227– 1230, 1989.
Bennartz, R.: Global assessment of marine boundary layer cloud droplet number concentration
25
ACPD
9, 25523–25564, 2009Synoptic variability of the stratocumulus
deck
D. Painemal and P. Zuidema
Title Page
Abstract Introduction
Conclusions References
Tables Figures
◭ ◮
◭ ◮
Back Close
Full Screen / Esc
Printer-friendly Version
Interactive Discussion Bony, S. and Dufresne, J.-L.: Marine boundary layer clouds at the heart of
tropi-cal cloud feedback uncertainties in climate models, Geophys. Res. Lett., 32, L20806, doi:10.1029/2005GL023851, 2005.
Borg, L. A. and Bennartz, R.: Vertical structure of stratiform marine boundary layer clouds and its impact on cloud albedo, Geophys. Res. Lett., 34, L05807, doi:10.1029/2006GL028713,
5
2007.
Brenguier, J. L., Pawlowska, H., Sch ¨uller, L., Preusker, R., Fischer, J., and Fouquart, Y.: Ra-diative properties of boundary layer clouds: Droplet effective radius versus number concen-tration, J. Atmos. Sci., 57, 803–821, 2000.
Brenguier J.-L., Pawlowska, H., and Sch ¨uller, L.: Cloud microphysical and radiative properties
10
for parameterization and satellite monitoring of the indirect effect of aerosol on climate, J. Geophys. Res., 108(D15), 8632, doi:10.1029/2002JD002682, 2003.
Bretherton, C. S., Uttal, T., Fairall, C. W., Yuter, S., Weller, R., Baumgardner, D., Comstock, K., Wood, R., and Raga, G.: The EPIC 2001 stratocumulus study, B. Am. Meteor. Soc., 85, 967–977, 2004.
15
Christensen, M. W., Coakley, J. A., and Tahnk, W. R.: Morning-to-Afternoon evolution of marine stratus polluted by underlying ships: Implications for the relative lifetimes of polluted and unpolluted clouds, J. Atmos. Sci., 66, 2097–2106, 2009.
Comstock, K. K., Wood, R., Yuter, S. E., and Bretherton, C. S.: Reflectivity and rain rate in and below drizzling stratocumulus, Q. J. Roy. Meteorol. Soc., 130, 2891–2918, 2004.
20
Comstock, K. K., Bretherton, C. S., and Yuter, S. E.: Mesoscale variability and drizzle in south-east Pacific stratocumulus, J. Atmos. Sci., 62, 3792–3807, 2005.
Fuenzalida, H. A., Sanchez, R., and Garreaud, R. D.: A climatology of cutofflows in the South-ern Hemisphere, J. Geophys. Res., 110, D18101, doi:10.1029/2005JD005934, 2005. Garreaud, R., Rutllant, J., and Fuenzalida, H.: Coastal lows along the subtropical west coast
25
of south America: Mean structure and evolution, Mon. Weather Rev., 130, 75–88, 2002. Garreaud, R. and Rutllant, J: Coastal lows along the subtropical west coast of south America:
Numerical simulation of a typical case, Mon. Weather Rev., 131, 891–908, 2003.
Han, Q., Rossow, W. B, Zeng, J., and Welch, R.: Three different behaviors of liquid water path of water clouds in aerosol-cloud interactions, J. Atmos. Sci., 59, 726–735, 2002.
30
ACPD
9, 25523–25564, 2009Synoptic variability of the stratocumulus
deck
D. Painemal and P. Zuidema
Title Page
Abstract Introduction
Conclusions References
Tables Figures
◭ ◮
◭ ◮
Back Close
Full Screen / Esc
Printer-friendly Version
Interactive Discussion Hawkins, L. N., Russell, L. M., Covert, D. S., Quinn, P. K., and Bates, T. S.: Carboxylic acids,
sulfates, and organosulfates in processed continental organic aerosols over the southeast Pacific ocean during VOCALS-Rex 2008, J. Geophys. Res., submitted, 2009.
Huneeus, N., Gallardo, L., and Rutllant, J. A.: Offshore transport episodes of anthropogenic
5
sulfur in northern Chile: Potential impact on the stratocumulus cloud deck, Geophys. Res. Lett., 33, L19819, doi:10.1029/2006GL026921, 2006.
Jiang, H., Feingold, G., and Cotton, W. R.: Simulations of aerosol-cloud-dynamical feed-backs resulting from entrainment of aerosol into the marine boundary layer during the Atlantic Stratocumulus Transition Experiment, J. Geophys. Res., 107(D24), 4813,
10
doi:10.1029/2001JD001502, 2002.
Kalnay, E., Kanamitsu, K., Kistler, R., et al: The NCEP/NCAR 40-years Reanalysis project, B. Am. Meteor. Soc., 77, 437–471, 1996.
Kim B.-G., Miller, M. A., Schwartz, S. E., Liu, Y., and Min, Q.: The role of adiabaticity in the aerosol first indirect effect, J. Geophys. Res., 113, D05210, doi:10.1029/2007JD008961,
15
2008.
Klein, S. A. and Hartmann, D. L.: The seasonal cycle of low stratiform clouds, J. Climate, 6, 1587–1606, 1993.
Klein, S. A.: Synoptic variability of low-cloud properties and meteorological parameters in the subtropical trade wind boundary layer, J. Climate, 10, 2018–2039, 1997.
20
Kubar, T., Hartmann, D. L., and Wood, R.: Understanding the importance of microphysics for warm rain in marine low clouds: Part I. Satellite observations, J. Atmos. Sci., 66, 2953–2972, 2009.
Leon D. C., Wang, Z., and Liu, D.: Climatology of drizzle in marine boundary layer clouds based on 1 year of data from CloudSat and Cloud-Aerosol Lidar and Infrared Pathfinder
Satel-25
lite Observations (CALIPSO), J. Geophys. Res., 113, D00A14, doi:10.1029/2008JD009835, 2008.
Loeb, N. and Schuster, G.: An observational study of the relationship between cloud, aerosol and meteorology in broken low-level cloud conditions. J. Geophys. Res., 113, D14214, doi:10.1029/2007JD009763, 2008.
30
Marshak, A., Platnick, S., Varnai, T., Wen, G., and Cahalan, R. F.: Impact of 3D radia-tive effects on satellite retrievals of cloud droplet sizes. J. Geophys. Res., 111, D09207, doi:10.1029/2005JD006686, 2006.
ACPD
9, 25523–25564, 2009Synoptic variability of the stratocumulus
deck
D. Painemal and P. Zuidema
Title Page
Abstract Introduction
Conclusions References
Tables Figures
◭ ◮
◭ ◮
Back Close
Full Screen / Esc
Printer-friendly Version
Interactive Discussion Kaufman, Y. J.: Satellite-based assessment of marine low cloud variability associated
with aerosol, atmospheric stability, and the diurnal cycle, J. Geophys. Res., 111, D17204, doi:10.1029/2005JD006097, 2006.
Mauger, G. S. and Norris, J. R.: Meteorological bias in satellite estimates of aerosol-cloud relationships, Geophys. Res. Lett., 34, L16824, doi:10.1029/2007GL029952, 2007.
5
McComiskey, A., Feingold, G., Frisch, A. S., Turner, D. D., Miller, M. A., Chiu, J. C., Min, Q., and Ogren, J. A.: An assessment of aerosol-cloud interactions in marine stratus clouds based on surface remote sensing, J. Geophys. Res., 114, D09203, doi:10.1029/2008JD011006, 2009.
Mu ˜noz, R. and Garreaud, R.: Dynamics of the low-level jet offthe coast of subtropical South
10
America, Mon. Weather Rev., 133, 3661–3677, 2005.
Murphy, D. M., Solomon, S., Portmann, R. W., Roselof, K. H., Forster, P. M., and Wong, T.: An observationally-based energy balance for the Earth system since 1950, J. Geophys. Res., 114, D17107, doi:10.1029/2009JD012105, 2009.
Painemal, D., Garreaud, R., Rutllant, J., and Zuidema, P.: Southeast Pacific stratus:
High-15
frequency variability and mesoscale structures over San Felix Island, J. Appl. Meteor. Cli-mate, accepted, 2009.
Platnick, S., King, M., Ackerman, S., Menzel, W., Baum, B., Riedi, J., and Frey, R.: The MODIS cloud products: Algorithms and examples from Terra, IEEE T. Geosci. Remote, 41, 459–473, 2003.
20
Pruppacher H. R. and Klett, J. D.: Microphysics of Clouds and Precipitation, Kluwer Academic, 954 pp., 1997.
Quaas, J., Ming, Y., Menon, S., Takemura, T., Wang, M., Penner, J. E., Gettelman, A., Lohmann, U., Bellouin, N., Boucher, O., Sayer, A. M., Thomas, G. E., McComiskey, A., Feingold, G., Hoose, C., Kristj ´ansson, J. E., Liu, X., Balkanski, Y., Donner, L. J., Ginoux, P. A., Stier, P.,
25
Feichter, J., Sednev, I., Bauer, S. E., Koch, D., Grainger, R. G., Kirkev ˚ag, A., Iversen, T., Seland, Ø., Easter, R., Ghan, S. J., Rasch, P. J., Morrison, H., Lamarque, J.-F., Iacono, M. J., Kinne, S., and Schulz, M.: Aerosol indirect effects – general circulation model intercom-parison and evaluation with satellite data, Atmos. Chem. Phys. Discuss., 9, 12731–12779, 2009,
30
http://www.atmos-chem-phys-discuss.net/9/12731/2009/.
ACPD
9, 25523–25564, 2009Synoptic variability of the stratocumulus
deck
D. Painemal and P. Zuidema
Title Page
Abstract Introduction
Conclusions References
Tables Figures
◭ ◮
◭ ◮
Back Close
Full Screen / Esc
Printer-friendly Version
Interactive Discussion 108(D15), 8631, doi:10.1029/2002JD002680, 2003.
Seethala, C. and Horv ´ath, ´A.: Global Assessment of AMSR-E and MODIS Cloud Liquid Water Path Retrievals in Warm Oceanic Clouds, J. Geophys. Res., submitted, 2009.
Stevens, B. and Feingold, G.: Untangling aerosol effects on clouds and precipitation in a buffered system, Nature, 461, 607–613, doi:10.1038, 2009.
5
Szczodrak, M., Austin, P. H., and Krummel, P. B.: Variability of optical depth and effective radius in marine stratocumulus clouds, J. Atmos. Sci., 58, 2912–2926, 2001.
Stephens G. L., Vane, D. G., Boain, R. J., et al.: The CloudSat mission and the A-Train: A new dimension of space-based observations of clouds and precipitation, B. Am. Meteor. Soc., 83, 1771–1790, 2002.
10
Tomlinson J. M., Li, R., and Collins, D. R.: Physical and chemical properties of the aerosol within the southeastern Pacific marine boundary layer, J. Geophys. Res., 112, D12211, doi:10.1029/2006JD007771, 2007.
Twomey, S.: The influence of pollution on the shortwave albedo of clouds, J. Atmos. Sci., 34, 1149–1152, 1977.
15
Wielicki, B. A., Barkstrom, B. R., Harrison, E. F., Lee III, R. B., Smith, G. L., and Cooper, J. E.: Clouds and the Earth’s Radiant Energy System (CERES): An Earth Observing System Experiment, B. Am. Meteor. Soc., 77, 853–868, 1996.
Wood, R., Comstock, K. K., Bretherton, C. S., Cornish, C., Tomlinson, J., Collins, D. R., and Fairall, C.: Open cellular structure in marine stratocumulus sheets, J. Geophys. Res., 113,
20
D12207, doi:10.1029/2007JD009371, 2008.
Wood, R. and Mechoso, C. R.: Southeastern Pacific Coupled Climate Field Experiment, EOS, Transactions American Geophysical Union, 89(33), 303, doi:10.1029/2008EO330003, 2008. Wyant, M. C., Wood, R., Bretherton, C. S., Mechoso, C. R., Bacmeister, J., Balmaseda, M. A.,
Barrett, B., Codron, F., Earnshaw, P., Fast, J., Hannay, C., Kaiser, J. W., Kitagawa, H., Klein,
25
S. A., Khler, M., Manganello, J., Pan, H.-L., Sun, F., Wang, S., and Wang, Y.: The PreVOCA experiment: modeling the lower troposphere in the Southeast Pacific, Atmos. Chem. Phys. Discuss., 9, 23909–23953, 2009,
http://www.atmos-chem-phys-discuss.net/9/23909/2009/.
Xu, H., Wang, Y., and Xie, S.-P.: Effects of the Andes on eastern Pacific climate: A regional
30
atmospheric model study, J. Climate, 17, 589–602, 2004.
ACPD
9, 25523–25564, 2009Synoptic variability of the stratocumulus
deck
D. Painemal and P. Zuidema
Title Page
Abstract Introduction
Conclusions References
Tables Figures
◭ ◮
◭ ◮
Back Close
Full Screen / Esc
Printer-friendly Version
Interactive Discussion Zuidema, P., Westwater, E., Fairall, C., and Hazen, D.: Ship-based liquid water path estimates in
marine stratocumulus, J. Geophys. Res., 110, D20206, doi:10.1029/2005JD005833, 2005. Zuidema, P., Painemal, D., de Szoeke, S., and Fairall, C.: Stratocumulus cloud top height
ACPD
9, 25523–25564, 2009Synoptic variability of the stratocumulus
deck
D. Painemal and P. Zuidema
Title Page
Abstract Introduction
Conclusions References
Tables Figures
◭ ◮
◭ ◮
Back Close
Full Screen / Esc
Printer-friendly Version
Interactive Discussion Table 1. Number and percentage of CloudSat pixels below two km of height, at two separate
regions, above two different reflectivity thresholds.
Domain dBZ≥−17 dBZ>0
MAXNd 17◦
–27◦
S and 70◦
–80◦
W 973 pixels/13.6% 44 pixels/0.6%
MINNd 17◦
–27◦
S and 70◦
–80◦
W 13 611 pixels/37.4% 1168 pixels/3.2%
MAXNd 20◦
–30◦
S and 80◦
–90◦
W 11 596 pixels/43.9% 2589 pixels/9.8% MINNd 20◦
–30◦
S and 80◦
–90◦
ACPD
9, 25523–25564, 2009Synoptic variability of the stratocumulus
deck
D. Painemal and P. Zuidema
Title Page
Abstract Introduction
Conclusions References
Tables Figures
◭ ◮
◭ ◮
Back Close
Full Screen / Esc
Printer-friendly Version
Interactive Discussion
0 100 200 300 400 500 600 0
100 200 300 400 500 600
MODIS cloud depth [m]
Ship based cloud depth [m] (a)
10 100 1000
10 100 1000
MODIS N
d
[#cm
−3
]
Aerosol concentration (N
a) [#cm −3
] (b)
Fig. 1. (a) MODIS-derived cloud depth versus ship-based cloud depth (hourly averaged; ceilometer cloud fraction>0.9), and(b)MODIS-derivedNd versus ship-based accumulation-mode (r >0.1 mm) aerosol concentrations (hourly-averaged; no restriction on ceilometer cloud fraction). Blacks dots indicate samples east of 80◦
W and crosses are samples for which the bias-corrected MODISHsat is within 70 m ofHship. The black solid line represents the best-fit line for all values withNd>50 cm−3
. Sampling domain covers 0◦
–30◦
S, 72◦
W–90◦