First EISCAT measurement of electron-gas temperature
in the arti®cially heated D-region ionosphere
A. Kero1, T. B oÈsinger1, P. Pollari1, E. Turunen2, M. Rietveld3 1 University of Oulu, Department of Physical Sciences, FIN-90401 Oulu, Finland 2 Geophysical Observatory, FIN-9960SodankylaÈ, Finland
3 EISCAT, 9027 Ramfjordbotn, Norway; also at Max-Planck-Institut fuÈr Aeronomie, D-37191 Katlenburg-Lindau, Germany
Received: 14 February 2000 / Revised: 14 June 2000 / Accepted: 15 June 2000
Abstract. The ionospheric electron gas can be heated arti®cially by a powerful radio wave. According to our modeling, the maximum eect of this heating occurs in the D-region where the electron temperature can increase by a factor of ten. Ionospheric plasma param-eters such as Ne;Te and Ti are measured by EISCAT incoherent scatter radar on a routine basis. However, in the D-region the incoherent scatter echo is very weak because of the low electron density. Moreover, the incoherent scatter spectrum from the D-region is of Lorentzian shape which gives less information than the spectrum from the E- and F-regions. These make EISCAT measurements in the D-region dicult. A com-bined EISCAT VHF-radar and heating experiment was carried out in November 1998 with the aim to measure the electron temperature increase due to heating. In the experiment the heater was switched on/o at 5 minute intervals and the integration time of the radar was chosen synchronously with the heating cycle. A system-atic dierence in the measured autocorrelation functions was found between heated and unheated periods.
Key words: Ionosphere (active experiments; plasma temperature and density; wave propagation)
1 Introduction
At ®rst glance it looks surprising that there are ± to our knowledge ± no reports on EISCAT measurements devoted to one of the most dramatic eects of ``heating experiments'', the heating of the electron gas in the D-region ionosphere. There was an EISCAT experiment back in 1985 (E. Turunen in EISCAT Annu Rep 1985, EISCAT Sci Assoc, Kiruna, 1985) where this issue was
addressed in passing. This experiment was, however, designed and carried out for a dierent purpose.
It also looks surprising from a general point of view, that the electron temperature belongs to the ionospheric parameters readily derived by routine EISCAT mea-surements, such as the CP (common program) measure-ments, at least above 90km, and it is often referred to as the uniqueness of the HF heating facility at Tromsù that an incoherent scatter radar, EISCAT, is operating in parallel to the device, just at the same spot. There were several attempts at doing D-region electron-temperature measurements in the early 1990s but without success. Quite in contrast, there are in fact many reports on strong heating of electron gas in the F-region (Robinson
et al., 1996; Honary et al., 1993; Stocker et al., 1992; Jones et al., 1986). Reasons why the heating-induced electron temperature enhancement at D-region heights has not yet been measured may be: (1) too short an integration time; (2) wrong conditions or time of day; (3) non-optimum HF parameters (see our discussion). The negative outcome so far is still a surprise, since the heating-induced electron temperature enhancements always exhibit a maximum in D-region heights, and this maximum can be quite substantial (up to a factor of ten) and may often be associated with the largest wave-energy absorption. Here we report our ®rst successful attempt at doing this measurement.
The heating eect is caused by collisions between neutral particles and electrons accelerated by the radio wave. The D-region is an ideal place for this wave-electron-neutral interaction because of already sucient electron densityNeand still high collision frequencymen between electrons and neutrals. In these collisions a part of the energy of the radio wave is transferred to thermal energy of electrons. By this absorption the wave is, of course, diminished and thereby the heating eect is usually weakened above the D-region. Below the D-region the collision frequency is too high for the wave to accelerate electrons between the collisions. Unfortunately the D-region is also the most dicult target for the incoherent scatter radar technique because of low electron density, high collision frequency and
exotic ion chemistry. Therefore, arti®cial heating is not used to a great extent in D-region studies and in most cases scientists try to investigate eects in the E- or F-regions. This is done by choosing the radio wave parameters (frequency, radiative power and polariza-tion) so as to minimize the interaction between the wave and the electrons for the D-region. In our case, the parameters were chosen with the opposite intention.
2 Description of the experiment
The EISCAT heating facility provides various methods for carrying out heating experiments (Rietveld et al., 1993). Basically, the user must choose the antenna ®eld (out of three arrays), frequency and polarization of the radio wave and various modulation schemes of these parameters during the heating. In our experiment, the largest antenna ®eld (array 1) was used to produce as narrow a beam as possible and thereby the maximum radiated power in the heated area. All 12 transmitters were used with 75 kW each. Antenna array 1 has a gain of 30dB at the chosen fequency of 5.423 MHz so that the eective radiative power, ERP1 was 900 MW. The
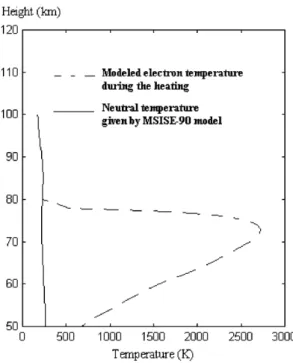
polarization (X-mode) and the frequency of the wave were chosen to create the main eect somewhere between 70and 80km altitudes. This was estimated by our theoretical heating model described in section 3.
The experiment was started on 19 November 1998, at 20.30 UT and lasted three and a half hours. In order to see the dierence between heated and unheated plasma, the heater was switched on/o every 5 minutes. The EISCAT VHF-radar (224 MHz) was looking at the same region in the sky with a special D-region program GEN-11 (Turunen, 1986). The post-integration time of the radar was chosen synchronously with the heating cycle.
3 Theoretical heating model
As mentioned already the experiment was designed by using our own heating model. The approach is very much the same as in Belovaet al.(1995).
3.1 Absorption of the radio wave
Radio wave propagation in the ionospheric D-region is described by the well known Appleton-Lassen disper-sion relation
n21 X
1 iZ 2 1 YsinXhiZ2
Ysinh
4
4 1 X iZ2 Ycosh
2
r ;
1
which describes the refractive indexnof the plasma as a function of normalized frequenciesX;Y;Z, de®ned as
X x2
pe x2
Nee2
e0mex2 ; 2
Y xge x
eB mex
3
and
Zmen
x : 4
Symbols e;e0;me;x and B stand for unit charge, permitivity of vacuum, mass of electron, angular frequency of the radio wave and external magnetic ®eld respectively. The angle between the wave vector and the direction of the magnetic ®eld is denoted by the symbol h. The B-®eld is the magnetic ®eld of the Earth that is obtained within a dipole ®eld approximation. The electron-neutral collision frequency men is calculated from Dalgarnoet al., (1967)
men1:7 10 11N2Te3:8 10 10O2pTe 1:4 10 10O Te
p
; 5
where neutral densities (constituents with square brack-ets) and the electron temperature must be given in units cm 3 and Kelvin. It can be shown that the refractive
index is a complex number with a negative imaginary part Im n<0when electron-neutral collisions are involved in the plasma (Z >0), so the imaginary part ofndescribes the damping of the wave. The physical interpretation of the damping is that part of the wave energy is absorbed into the plasma. This energy is actually divided between electrons and neutrals but because of the huge mass dierence the electrons take practically all of it. By using an ideal gas approximation for the electron gas, the electron temperature variation due to the absorption is described by the non-linear dierential equation
dTe dt
2 3kBNe
Im n2xI
c L
; 6
whereI is the intensity of the wave andLis the sum of all electron energy loss-functions (Stubbe and Varnum, 1972; Prasad and Furman, 1973). When this equation is solved numerically for D-region conditions, it turns out that the electron temperature achieves an equilibrium dTe=dt0on tens of microseconds timescale. The rapid response of the plasma is due to the high collision frequency men and it is experimentally veri®ed when heating is used to produce arti®cial magnetic distur-bances (Rietveldet al., 1986). The electron temperature is thereby considered to achieve its maximum immedi-ately when the heater is switched on, and it stays constant until the heater is switched o.
3.2 Algorithm
The equilibrium state can be determined by solving numerically Eq. (6) as a function of Te with initial
1ERP is the power from an isotropically radiating antenna which
condition dTe=dt0. The parameters for this calcula-tion from Eqs. (1)±(6) are h;x;Ne;B;N2;O2;O and
Tn. In our model the electron density pro®le is given by the SodankylaÈ Ion Chemistry SIC model (Turunen
et al., 1996) and the neutral atmosphere parameters are taken from MSISE90-model (Hedin, 1991).
The intensity of the wave I must be calculated for each altitude (see Eq. 6) by taking into account the absorption below. Using the ERP, the intensity at height
his given by
I ERP 4ph2exp
Zh
0
2x
c Im ndh
0
@
1
A : 7
In practice, the integral is approximated by a sum over 1 km layers below the altitude h. After calculating the intensity and solving the Te in equilibrium, the model goes on to the next layer.
By introducing the input parameters corresponding to our experiment on 19 November 1998, the model gives the electron temperature pro®le in the heated D-region as shown in Fig. 1). The maximum heating eect appears to be somewhere around 75 km and there is a strong decay above it. This can be understood in the way that practically all of the wave is absorbed in the D-region. It turns out that a similar decrease of the heating eect showed up in the data of the EISCAT GEN-11 experiment. This indicates that our absorption estimates are realistic as compared to the actually occurring heating eect.
4 The data and the analysis of it
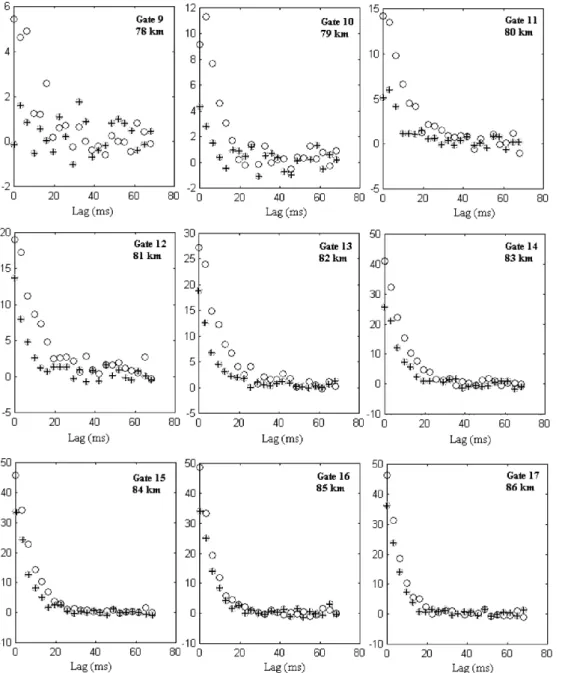
The incoherent scatter radar measurement output is ®rst a set of autocorrelation functions (ACF). For the GEN-11 experiment the ACF is measured for 42 gates corresponding to altitudes from 70to 113 km in 1.05 km steps. Each ACF contains 22 values in the time domain. The shortest time lag is 112ls (later called
lag0) and the longer lags (lag1 ± lag21) come in multiples of 3.24 ms. The measured ACFs are the product of the
autocorrelation function of the target plasma and the radarambiguity function. The latter contains the eect of the receiver impulse response and the transmitter modulation. The purpose is to separate the measure-ment device eects (ambiguity function) from the pure ACF of the plasma. This ambiguity correction is done here with the method described in Pollari et al.(1989). Practically, the correction is signi®cant only for the lag0+ and lag1 values.
4.1 Measured autocorrelation functions
Ambiguity corrected data points are shown in Fig. 2. The results shown here are the averages over the whole experiment so that each crossed ball represents the average of all 21 heating-on periods and the open balls heating-o periods. Note that the ACFs in the lower gates are rather noisy and thereby the post-integration over long timescales is unavoidable in our data analysis. One can see a systematic dierence between the ACFs measured during heated as compared to unheated time periods. In the heated periods the average ACFs are decaying more rapidly as a function of lag, and the absolute values of the ®rst lags are smaller as compared to the unheated ones. Note also, that the dierence is reduced in higher gates, which is in agreement with the predicted decrease of the heating in¯uence above the maximum altitude (see Fig. 1).
4.2 Data analysis
Plasma parameters (Ne;Te=Ti;vi, etc.) are obtained by ®tting a theoretical ACF to the measurement points, so that some parameters are used as free variables and the rest of the quantities are assumed to be constant. This ®tting can be done automatically with GUISDAP for most of the EISCAT experiments. Unfortunately, GUISDAP cannot handle pulse-to-pulse correlation programs such as GEN-11 by its very design. The method used in this paper should be considered as a preliminary data-analysis approach. More work has to be done to reach routine data analysis of the given type. The theoretical plasma ACF is inverse Fourier transform of the power spectral density function. The full formulation of the power spectrum is given by Dougherty and Farley (1963) and several approxima-tions are also used in some special cases. In the D-region ionosphere the incoherent scatter spectrum can be as-sumed to be of Lorentzian shape and the corresponding
ACF is thereby exponential. By taking into account the eect of negative ions (Fukuyama and Kofman, 1980), the actual electron density and the temperature of the plasma can successfully be obtained by this approach. The approximation of the exponential ACF is often used in the GEN-11 data analysis. However, in the following ®tting, the ACF is obtained by using the full spectrum form. Hence, one can be sure that the dependence of the ACF shape on the electron temper-ature is correct in circumstances of the heated iono-sphere, where TeTi.
The incoherent scatter spectrum is a function of all plasma constituents. This is a challenge for the spectrum model especially in the D-region where the ion chemistry is very complex. Here the calculation of the power spectral density function is based on the SIC-model so that concentration of all 33 positive and 18 negative ion species to the spectrum are taken into account. Theo-retical ACF is calculated by using the inverse fast
Fourier transform (IFFT) algorithm to the power spectral density function. Electron temperature esti-mates are obtained by using Te as a free parameter in ®tting the theoretical ACF to the measured one in a least squares fashion. In order to scale the measured and the theoretical ACFs in a similar way, the measurement points are normalized so that all of the lag values are divided by the unheated lag1 value. The theoretical curve is normalized correspondingly, so that the ACF (for every Te=Ti-ratio) is divided by the ACF value at point 3.24 ms (=lag1) in the TeTi condition. The value of lag1 was chosen to be the normalization point, instead of lag0, because lag1 is less noisy.
5 Discussion
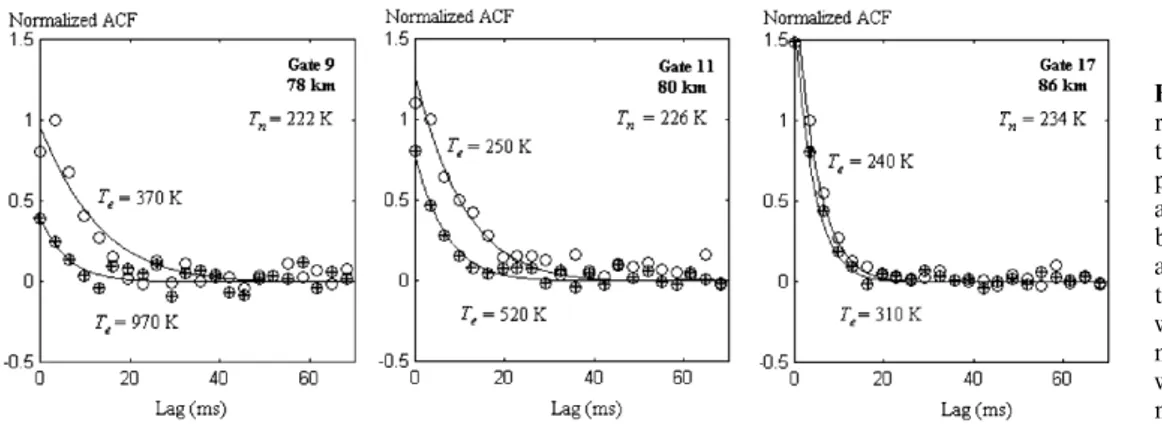
The best-®tting ACFs (gates 9, 11 and 17) are shown in Fig. 3). One can see that the theoretical ACFs can
successfully be ®tted to the averaged measurement points as a function of Te. Though the ®tting in gate 9 seems to be imperfect, especially in the unheated case, a rough estimation of the average electron temperatures can nevertheless be obtained also in that altitude. One possible error source in the ®tting is the electron density, which is not obtained from the analysis, but taken directly from the SIC-model. However, the average heated electron temperature measured by EISCAT and analyzed based on the SIC-model seems to be reason-ably well in agreement with the theoretical radio wave absorption calculation (see Fig. 4). The main heating eect appears to be somewhere below the best altitude range for the EISCAT GEN-11 type experiment. Nevertheless, the predicted decay of the eect due to the strong absorption is clearly visible in the measured data. The original aim was naturally to measure the maximum eect, but this time the radio wave parame-ters were such that the absorption turned out to be at too low D-region altitudes. The design of the heating experiment is dicult mainly due to variable electron density, which should be known in advance. The SIC-model gives a very detailed view of the D-region and it
seems to be a usable tool, not only for predicting the electron density pro®le, but also for calculating the realistic incoherent scatter spectrum for the D-region.
Note that our results re¯ect in the best case a time average over an hour or so of the heating eect. No doubt, especially during sun rise, sun set or particle precipitation events, the D-region parameters may change on a much shorter timescale aecting the eciency of the heating in a direct way. This experiment was meant to demonstrate that the heating eect can indeed be measured. By optimizing our tools and methods we are con®dent that in the near future we will also be able to demonstrate the variablity in the heating eciency in accord to changing ionospheric conditions.
6 Conclusions
By our experiment we have succeeded to demonstrate that it is in fact possible to measure by EISCAT the heating-induced electron temperature increase in the D-region, in spite of the fact that our experiment design and the geophysical conditions were not fully optimal for our purpose. With the experience gained by this experiment there are good reasons to believe that it will be possible in the near future to carry out still more accurate measurements of this kind. The D-region is geophysically a very interesting and in many respects an important layer where the collision-dominated neutral atmosphere and the plasma-dominated ionosphere intersect. Moreover, the D-region has an exotic ion chemistry including negative ions.
Newly designed EISCAT measurements and more extensive data-analysis including dierent local times and geophysical conditions will make it possible, espe-cially in application with heating, to verify and improve existing D-region models. After such long operation of EISCAT and the Tromsù HF heating facility it was a surprise for us that the missing link of D-region electron temperature measurement in conjunction with heating could ®nally be found with relative ease.
Acknowledgements. We are indebted to the director and sta of EISCAT for operating the radar and heating facilities and greatly acknowledge the support of all the individuals and personnel of the institutions who contributed to the Finnish EISCAT heating experiment. EISCAT is an international association supported by
Fig. 3. Best ®ttings of the theo-retical plasma ACFs (solid line) to the ambiguity corrected data points (balls) for the gates 9, 11 and 17. Thecrossedandopen
balls stand for the heating-on and heating-o periods, respec-tively. The neutral temperature was taken from the MSISE-90 model, and the ion temperature was assumed to be equal to the neutral temperature
Finland (SA), France (CNRS), the Federal Republic of Germany (MPG), Japan (NIPR), Norway (NFR), Sweden (NFR) and the United Kingdom (PPARC). The author and student A.K. acknowledges ®nancial support by the Academy of Finland.
Topical Editor M. Lester thanks J. Silen and another referee for their help in evaluating this paper.
References
Belova, E. G., A. B. Pashin, and W. B. Lyatsky, Passage of a powerful HF radio wave through the lower ionosphere as a function of initial electron density pro®les, J. Atmos. Terr. Phys.,57,265±272, 1995.
Dalgarno, A., M. B. McElroy, and J. C. G. Walker,The diurnal variation of ionospheric temperatures, Planet. Space Sci., 15,
331±345, 1967.
Doughetry, J. P., and D. T. Farley, A theory of incoherent scattering of radio waves by a plasma, J. Geophys. Res., 68,
5473±5486, 1963.
Fukuyama, K., and W. Kofman, Incoherent scattering of an electromagnetic wave in the mesosphere: a theoretical consid-eration,J. Geomagn. Geoelectr. Kyoto,32,67±81, 1980.
Hedin, A. E.,Extension of the MSIS Thermosphere model into the middle and lower atmosphere,J. Geophys. Res.,96,1159±1172, 1991.
Honary, F., A. J. Stocker, T. R. Robinson, T. B. Jones, N. M. Wade, P. Stubbe, and H. Kopka, EISCAT observations of electron temperature oscillations due to the action of high power HF radio waves, J. Atmos. Terr. Phys.,55,1433±1448, 1993.
Jones, T. B., T. R. Robinson, P. Stubbe, and H. Kopka,EISCAT observations of the heated ionosphere,J. Atmos. Terr. Phys.,
48,1027±1035, 1986.
Pollari, P., A. Huuskonen, E. Turunen, and T. Turunen, Range ambiguity eects in a phase coded D-region incoherent scatter radar experiment,J. Atmos. Terr. Phys.,51,937±945, 1989.
Prasad, S. S., and D. R. Furman,Electron energy transfer rates in the ionosphere,J. Geophys. Res.,78,6701±6707, 1973.
Rietveld, M. T., H. Kopka, and P. Stubbe,D-region characteristics deduced from pulsed ionospheric heating under auroral elec-trojet conditions,J. Atmos. Terr. Phys.,45,311±326, 1986.
Rietveld, M. T., H. Kohl, H. Kopka, and P. Stubbe,Introduction to ionospheric heating at Tromsù, I. Experimental overview,
J. Atmos. Terr. Phys.,55,577±599, 1993.
Robinson, T. R., F. Honary, A. J. Stocker, T. B. Jones, and P. Stubbe,First EISCAT observations of the modi®cation of F-region electron temperatures during RF heating at harmonics of the electron gyrofrequency,J. Atmos. Terr. Phys., 58,385± 395, 1996.
Stocker, A. J., F. Honary, T. R. Robinson, T. B. Jones, P. Stubbe, and H. Kopka, EISCAT observations of large scale electron temperature and electron density perturbations caused by high power HF radio wave,J. Atmos. Terr. Phys., 54, 1555±1572, 1992.
Stubbe, P., and W. S. Varnum,Electron energy transfer rates in the ionosphere,Planet. Space Sci.,20,1121±1126, 1972.
Turunen, T.,GEN-SYSTEM ± a new experimental philosophy for EISCAT radars,J. Atmos. Terr Phys.,48,777±785, 1986.