Resumo
Nesse trabalho, é apresentada a classiicação de 110 amostras de minério de cobre da Mina do Sossego, com base nas técnicas de difração de raios X e análise estatística por agrupamento (cluster analysis). A comparação, baseada na posição e intensidade dos picos difratados, permitiu a distinção de sete tipos de minérios, cujas diferenças referem-se às proporções dos principais minerais constituintes: quartzo, feldspato, actinolita, óxidos de ferro, mica e clorita. Observou-se forte correlação entre os grupos com a localização das amostras nos corpos Sequeirinho e Sossego. Essa relação deve-se aos diferentes tipos e intensidades das alterações hidrotermais atuantes em cada corpo, que reletem na composição mineralógica e, consequentemente, nos difratogramas de raios X das amostras.
Palavras-chave: Análise por agrupamento, difração de raios X, minério de cobre,
Mina do Sossego.
Abstract
This paper presents the classiication of 110 copper ore samples from Sossego Mine, based on X-ray diffraction and cluster analysis. The comparison based on the position and the intensity of the diffracted peaks allowed the distinction of seven ore types, whose differences refer to the proportion of major minerals: quartz, feldspar, actinolite, iron oxides, mica and chlorite. There was a strong correlation between the grouping and the location of the samples in Sequeirinho and Sossego orebodies. This relationship is due to different types and intensities of hydrothermal alteration prevailing in each body, which relect the mineralogical composition and thus the X-ray diffractograms of samples.
Keywords: Cluster analysis, X-ray diffraction, copper ore, Sossego Mine.
Copper ore type deinition
from Sossego Mine using
X-ray diffraction and cluster
analysis technique
Deinição de tipos de minérios de cobre
da Mina do Sossego por difração de raios X
e análise por agrupamento
Viviane Kotani Shimizu
Mestre,
Programa de Pós-Graduação em Engenharia Mineral, Escola Politécnica da USP
Henrique Kahn
Prof. Dr., Escola Politécnica da USP, Departamento de Engenharia de Minas e de Petróleo [email protected]
Juliana L. Antoniassi
Doutoranda,
Programa de Pós-Graduação em Engenharia Mineral, Escola Politécnica da USP
Carina Ulsen
Doutora,
Pesquisadora da Escola Politécnica da USP, Departamento de Engenharia
de Minas e de Petróleo [email protected]
1. Introduction
The Sossego mine in the mineral province of Carajás (state of Pará) is the second largest copper deposit in Brazil and the irst of several IOCG (iron-oxide-copper-gold) mines in this province to go into operation. Projects related to other deposits, such as Igarapé Bahia, Alemão, Cristalino, Gameleira and Alvo 118, are currently under development (Silva Rodrigues; Heider, 2009) while the Salobo project is in its inal stage before operation.
Although genetically related, these deposits contain distinct valuable minerals and mineral assemblages which depend on the composition of the host rocks and the mineralizing luids (Monteiro et al., 2008). Besides, mineralogical complex-ity deriving from superimposition of
hydrothermal alterations and complex structural control are factors that obscure sample classiication.
This paper presents a deinition of the ore types from the Sossego Mine us-ing X-ray diffraction and cluster analysis techniques. The comparison is based on the position and intensity of the diffracted peaks, which are equivalent to the main mineral phases of the samples.
X-ray diffraction (XRD) technique which may be coupled to chemical analysis, is applied at distinct stages of a mining enterprise, such as: assisting geological exploration, feasibility studies, ore blending, mineral processing, as well as mineralization control and ore genetic studies (Antoniassi et al., 2008).
Cluster analysis is primarily
em-ployed to assess chemical analysis results and widely used in the search for patterns of correlation between objects (Tan, Stein-bach, Kumar, 2006). Currently this tool can also directly process X-ray diffrac-tograms without requiring any previous treatment or identiication/knowledge of the mineral assemblage, which permits the classiication of hundreds to thou-sands of samples in just a few minutes, drastically reducing processing time and assisting data analysis (Macchiarola K. et al., 2007).
The resulting clusters show varia-tions, not only in the mineral assemblage but also in the mineral content of the ore, thus displaying different geological environments with potential impact on the ore explotation.
Description of the Sossego Mine
At the Sossego Mine copper miner-alization is comprised in ive orebodies: Pista, Sequeirinho, Baiano, Sossego and Curral. Sequeirinho and Sossego are the most important ones; differences between them rely on distinct types and intensities of hydrothermal alteration and host rocks. Sodic and calcic-sodic alterations are well developed at Sequeirinho, whereas at Sos-sego these are not expressive or nearly absent, prevailing the potassic, chloritic
and hydrolytic alterations (Monteiro et al., 2008).
Sodic alteration is characterized by albitization in veins and fractures, whereas calcic-sodic alteration is dis-tinguished by the presence of actinolite and albite; massive magnetite-(apatite) bodies and actinolite-rich zones occur in regions where the calcic-sodic altera-tion is more intense. Potassic alteraaltera-tion is associated with the presence of
biotite, potassium feldspar, magnetite and quartz. Chloritic alteration forms chlorite-rich zones that are associated with calcite and epidote. Mineralization is characterized by sulides, primarily chalcopyrite, as well as smaller amounts of pyrite, siegenite, millerite and vae-site. Finally, hydrolytic alteration is represented by the muscovite-hematite-quartz-chlorite-calcite assemblage (Monteiro et al., 2008).
2. Methods and materials
One hundred and ten ore samples from Sequeirinho and Sossego orebod-ies provided by Vale were studied. They correspond to the counterpart of mining planning drill core samples and were subject of a previous milling geometallurgical study presented by Bergerman (2009) and are also detailed by Shimizu (2012).
The experimental procedure is il-lustrated in Figure 1 and comprised the following activities:
• Sample preparation:
- Repeated comminution stages (crush-ing and grind(crush-ing), homogenization and
sampling in order to take a representa-tive around 30 gram aliquot.
- Planetary mill pulverization using Pulverizette 5 (Fritsch brand), under controlled conditions to obtain a sample with size particles bellow 40 µm (average size of 10 to 15 µm). - Manual back loading sample mounting for powder XRD.
• Acquisition of X-ray diffractograms using a X’Pert Pro diffractometer, with position sensitive X’Celerator detector (PSD) and Cu tube. The experimental conditions were:
- Cu Ka radiation, 45 kV and 40 mA,
diffracted beam with Ni ilter. - ½º ixed incident beam path and 15 mm mask.
- 2 rps rotation (spinner).
- 3 to 70 º angle range, 0.02º step. - 10 s time per step, for a total of 5 minutes per diffractogram.
• Diffractograms cluster analysis usi ng Highsc ore Plu s sof t ware from the PANalytical brand. The clustering process considered a Euclidean distance measure with average linkage method, comparing peak position and intensities a 40% threshold comparison.
Figure 1
Experimental procedure.
Sample (3 to 4kg)
Crushing (jaw & roll crushers)
Grinding (disc mill) Representative sampling Representative sampling Pulverization
(planetary mill) (X’Pert Pro diffractometer)X-ray diffraction
Cluster analysis XRD scans (X’Pert Highscore Plus software) Manual sample press
(back loading) Alíquot
(~200-250g)
3. Results and discussion
Cluster analysis
Cluster analysis is a statistical meth-od that greatly simpliies the analysis of large amounts of data, establishing simi-larity and dissimisimi-larity relations between samples (Tan, Steinbach, Kumar, 2006). This technique deines samples as dots de-scribed in the multidimensional space by variables chosen in the study; the distance
between these dots is equivalent to their similarities/dissimilarities (Moita Neto, Moita, 1998).
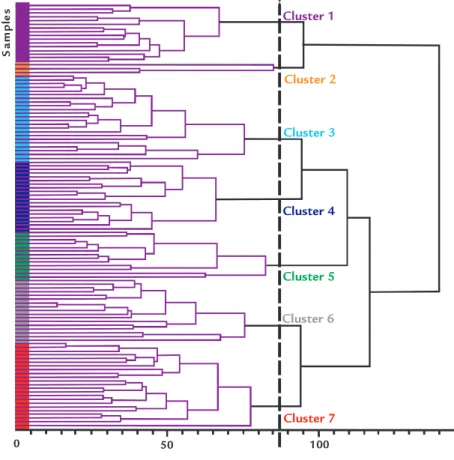
Samples were clustered according to hierarchical agglomerative algorithm. In this method objects are initially treated as single subgroups that are grouped into new subgroups after every step until there
is only one group left. A dendogram is the best way to illustrate the cluster result, since it displays information about dis-tances of all merged objects and subgrups formed. The result depends on the adopted cut-off criteria, which is in this case rep-resented by a vertical dotted line on the dendogram of Figure 2 (cut off of 87).
Figure 2 Dendogram indicating the sample clustering groups.
Principal component analysis
Principal component analysis (PCA) is a different way to verify cluster result. Here, original variables are rewritten into new ones named principal components. Coordinated transformation aims to reduce the di-mensionality of a data set, condensing
the information on the irst principal components (Moita Neto, Moita, 1998).
Studied samples show that the irst three principal components de-scribe about 85% of the PCA data set. Sample positioning according to these
variables from different points of view is presented in Figure 3. It is possible to verify that the groups occupy different regions of the 3 axis (3D representa-tion), indicating that the clustering satisfactorily individualized distinct ore types.
Sample distribution
The sample distribution of each group in Sequeirinho and Sossego orebod-ies are presented in Table 1. There is a
strong relation between clustering results and sample origin: clusters 1, 2, 6 and 7 are mainly composed of samples from
Se-queirinho, while clusters 3 and 5 comprise samples from Sossego. Cluster 4 gathers samples from both orebodies.
Figure 4 presents comparative graphs of all X-ray diffractograms which are classiied according to the group to which they belong displaying the major
mineral phases.
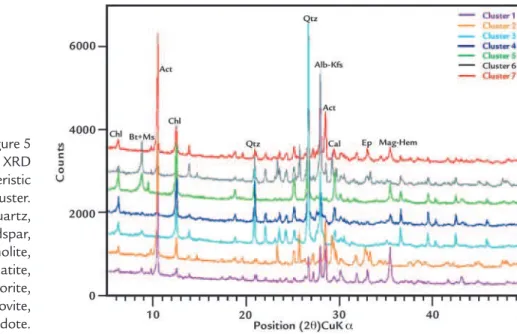
The diffractometry pattern char-acteristic to each cluster can also be seen in Figure 5, based on the diffractogram
of the most representative sample from each group (automatically selected by the software).
Due to the dificulty in estimating
X-ray diffractograms analysis
Cluster 1
S
a
m
p
le
s
Cluster 2
Cluster 3
Cluster 4
Cluster 5
Cluster 6
Cluster 7
Figure 3
Tridimensional representation of the samples according to principal component analysis. Legend: magenta (cluster 1), orange (cluster 2), cyan (cluster 3), dark blue (cluster 4), green (cluster 5), grey (cluster 6) and red (cluster 7).
Figure 4
Comparison of XRD patterns according to the clustering groups. Legend: Qtz = quartz,
Ab-Kfs = albite and potassic feldspar, Act = actinolite,
Mag-Hem = magnetite-hematite, Chl = chlorite,
Bt-Ms = biotite-muscovite. Table 1
Sample distribution among the deined clusters from Sequeirinho and Sossego oreb.
Number of samples
Sequeirinho Sossego No source ID Total
Cluster 1 15 0 1 16
Cluster 2 3 0 0 3
Cluster 3 2 19 2 23
Cluster 4 6 11 1 18
Cluster 5 0 11 2 13
Cluster 6 8 0 7 15
Cluster 7 18 2 2 22
10 -10 -9-8
-7-6-5 -4-3
-2-1 012
345 6
-11 -14 -12-10
-8-6 -4 -2 0 2
4 6 8 1011 10 9 8 7 6 5 4 3 2 1 0 -1 -2 -3 -4 -5 -6 8 6 4 2 0 -2
P rincipal c om
ponent 1
Prin cipa
lc om pone
nt 3
Princ ipa
l c ompone
Figure 5 Comparison between the XRD patterns from the characteristic sample of each cluster. Legend: Qtz = quartz, Ab-Kfs = albite and potassic feldspar, Act = actinolite, Mag-Hem = magnetite-hematite, Chl = chlorite, Bt-Ms = biotite- muscovite, Cal = calcite, Ep = epidote. the mineral content of phases with similar crystalline structures by XRD,albite and potassium feldspar are presented as a single phase (Ab-Kfs), as well as magnetite and hematite (Mag-Hem) and biotite and muscovite (Bt-Ms).
XRD patterns of clustered groups shows that samples from clusters 1 and 2 have the same high proportions of
ac-tinolite and a small amount of quartz and feldspar; samples from group 1 also pres-ent magnetite, which is abspres-ent in group 2. Samples from groups 3, 4 and 5 are richer in quartz. Cluster 5 distinguishes itself by presenting smaller feldspar pro-portions, whereas clusters 3 and 4 differ for their relative proportions of quartz and actinolite.
Samples from clusters 6 and 7 con-tain mainly actinolite, quartz and feldspar, although group 6 differs from group 7 in the quantities of mica (biotite/muscovite) and chlorite.
Variations in the mineral proportion of samples from the same group (peak intensity differences) are compatible with the genesis of the deposit (hydrothermal).
Relation between the cluster and hydrothermal alterations of the Sossego Mine
There are some dificulties to es-tablish full relationships between cluster mineralogy classiication and ore geology in part because of the complexity of the deposit (superimposed events) and also due to of the XRD undifferentiated pro-portions of Ab-Kfs, Mag-Hem and Bt-Ms, Some associations such as actinolite-magnetite as present in cluster 1 are easily interpreted as typical results of intense calcic-sodic alteration.
Actinolite and feldspar (in this case albite) association, as observed in clusters 6 and 7, are also characteristic of the calcic-sodic alteration stage, however, less intense. Possibly, larger proportions of chlorite ± epidote in cluster 7 are due to the inluence of chloritic alteration, whereas the mica in cluster 6 may be associated to both the potassic alteration (biotite) as well as the hydrolytic alteration (muscovite).
The low proportion of actinolite
in samples from groups 3 and 5 (Sos-sego orebody) indicates little inluence of calcic-sodic alteration. In cluster 5, the association of quartz, mica, magnetite-hematite, chlorite and calcite characterizes a hydrolytic alteration assemblage.
Samples from cluster 4 were prob-ably formed in a transitional environment under the inluence of several hydrother-mal alterations, which explains why it gathers samples from both orebodies.
4. Conclusions
Seven ore-types where identified in the Sossego Mine. The classiication properly individualized the deined groups from a principal components analysis standpoint. A strong relation was ob-served between the XRD groups and spatial localization of the samples in the mineralized orebody: clusters 1, 2, 6 and 7 are essentially represented by samples from Sequeirinho, while clusters 3 and 5 by samples from Sossego. This relation-ship is due to different types and intensi-ties of the hydrothermal alterations that prevail in each orebody, which relect on the mineralogy and, consequently, on the samples X-ray diffractograms patterns.
The lack of distinction between the proportions of some minerals, such as albite /K feldspar, magnetite/hematite and biotite/muscovite partially hindered the geological interpretation of the cluster results. Nevertheless it was possible to establish relationships between the XRD groups and hydrothermal alteration stages or geological ore environments as well as the deined ore-types.
The established procedure allowed a quick and objective identiication and classiication of the main ore-types of present in the Sossego mine. The adopted method of sample classiication or type deinition, independent of the need to
phase’s identiication, drastically reduces the time required for data analysis and minimizes the subjectivity involved in geological logging as well as interpretation of XRD patterns.
5. Acknowledgements
T h e au t h o r s g r a t e f u l l y a c -knowledge Vale and their Sossego and geometallurgical teams for the development of this research, to
Fundação de Apoio à Pesquisa no Estado de São Paulo (FAPESP, pro-cess 09/54007- 0) for the financial support and to the technical team
of the Laboratório de Caracteriza-ção Tecnológica - LCT from Escola Politécnica da USP for their analyti-cal support.
6. Bibliographical references
ANTONIASSI, J.L. et al. Análise grupal por difratometria de raios X em apoio à
exploração e geometalurgia. In: CONGR. BRAS. GEOL., 44. Anais... Curitiba:
SBG, 2008.
BERGERMAN, M. G. Modelagem e simulação do circuito de moagem do Sossego.
São Paulo: Departamento de Engenharia de Minas e de Petróleo, Escola Politécnica da Universidade de São Paulo, 2009. (Dissertação de Mestrado). http://www. teses.usp.br/teses/disponiveis/3/3134/tde-21102009-100600/publico/Dissertacao_ Otimizacao_sossego.pdf
MACCHIAROLA, K. et alii. Modern X-ray diffraction techniques for exploration and analysis of ore bodies. In: DECENNIAL INTERN. CONF. MINERAL EXPLOR., 5. Toronto, Canada. 2007.
MOITA NETO, J. M., MOITA G. C. Uma introdução à análise exploratória de dados multivariados. Química Nova, São Paulo, v. 21, n. 4, p. 467-469, 1998.
MONTEIRO, L. V. S. et al. Spatial and temporal zoning of hydrothermal alteration and mineralization in the Sossego iron oxide–copper–gold deposit, Carajás Mineral Province, Brazil: paragenesis and stable isotope constraints. Mineralium Deposita, v. 43, p. 129-159, 2008b. http://rd.springer.com/article/10.1007/s00126-006-0121-3
SILVA RODRIGUES, A. F., HEIDER, M. Cobre. In: Economia mineral do Brasil. DNPM – Departamento Nacional de Produção Mineral. Brasil, 2009. cap. 4.3, p. 216-235. 764p.
TAN, P. N., STEINBACH, M., KUMAR, V. Cluster Analysis: Basic Concepts and Algorithms. In: Introduction to data mining. Pearson Addison-Wesley, Cap. 8, p.125-146, 2006.
SHIMIZU, V. K. Classiicação e caracterização de tipos de minérios de cobre da
mina do Sossego - região de Carajás. São Paulo: Departamento de Engenharia de Minas e de Petróleo, Escola Politécnica da Universidade de São Paulo, 2012. (Dissertação de Mestrado).