Abstract— This paper presents a theoretical and experimental comparison of two techniques of optical fiber current sensors (OFCS) based on the Faraday Effect: the power and the degree of polarization (DOP) methods. The DOP method is shown to be insensitive to state of polarization (SOP) changes induced by environmental conditions. A maximum variation of 0.4% in the DOP value in the entire range of applied current from 0 to 100 A was measured. It is the first time to our knowledge that this fact was experimentally verified. Also, for the first time known it is reported that zero current response, DOP = 0.996, is in agreement with the theoretical expected value of unitary DOP. Besides, the theoretical and experimental normalized DOP is shown to have a maximum difference of 0.33% in the entire range of applied current. On the other hand, the power method OFCS is greatly affected by SOP changes. In order to be used in a practical application, its complexity must be increased by the use, for example, of polarization maintaining fibers instead of standard fibers used in the DOP method, increasing the cost of the sensor element.
Index Terms—current sensor, Faraday effect, light polarization, optical fiber.
I. INTRODUCTION
Electric power systems have become more sophisticated over the last years leading to an urgent need of advanced measurement and control devices. Many kinds of sensors to attend systems such as electrical substations and transmission lines have been developed [1]. Nowadays, the electric power industries have invested in sensors which are suitable to measure needful parameters without been affected by environmental disturbances [2].
One essential parameter to be measured and monitored in those systems is the electrical current. It is important to know the amount of current that flows through an electric power system and to detect possible flaws and losses in its path [3,4]. A praiseworthy current sensor must present some specific
Theoretical and experimental comparison
between power and degree of polarization
based optical fiber current sensors
Carolina Franciscangelis, Fabiano Fruett,
State University of Campinas, School of Electrical and Computer Engineering, Av. Albert Einstein, 400, Barão Geraldo, Campinas-SP, Brazil, CEP:13083-970.
[email protected], [email protected]
Claudio Floridia, Edson W. Bezerra, Ariovaldo A. Leonardi, Alexandre S. Cunha and Valentino Corso
characteristics and attend some requests. It has to be immune to electromagnetic interferences; it also must present fast and practical operation and reliable responses. Furthermore, low cost and small size are desirable features. Considering those specifications, optical fiber current sensors based on the Faraday effect were extensively studied in literature [5] due to its inherent isolate characteristic.
The Faraday Effect causes a rotation of the propagating light plane of polarization which is linearly proportional to the component of the magnetic field in the direction of propagation induced by the current flowing through the conductor.
Several methods based in this technique have been proposed in the literature [6, 7]. One typical setup is presented, for example in [8] where power variations as a function of current are measured, however in such systems the response is very sensitive to the State Of Polarization (SOP) of the light of the Optical Fiber Current Sensors (OFCS). To overcome such difficulties, it was proposed different setups based on interferometric measurements which use polarization maintaining fibers [9]. However these kinds of solutions are more complex and require special fibers and design. In [10] it was proposed a simple scheme based on Degree Of Polarization (DOP) measurements which enables the use of standard fibers and it is expected to be insensitive to SOP changes due to environmental influences.
In this paper we compare both: theoretically and experimentally techniques of OFCS based on the Faraday Effect, the power method [8] and DOP method [10]. We clearly show the influence of SOP changes due to environmental influences on both methods by simulating these effects by means of a polarization controller inserted in a proper position on the experimental setups.
We also provided theoretical fits to both methods. Specifically we fitted the experimental results of the power method measurement setup for three different SOP by using Stokes formalism and Mueller matrices. We also demonstrate, for the first time to our knowledge, the environmental independence due to SOP changes in the DOP method and also provide theoretical fits to our DOP experimental results. Although the theoretical expression were obtained in [10], for the first time the experimental results for this method were fitted with the theoretical expectation, especially when no current is applied to the conductor and unitary DOP is expected.
II. FARADAY EFFECT
The Faraday effect causes a rotation of the propagating light plane of polarization which is linearly proportional to the component of the magnetic field in the direction of propagation. Equation (1) shows the relation between the polarization angle of rotation, θ, and the magnetic field, B, where d is the length of the path where light and magnetic field interact and υ is the Verdet constant [11,12].
Bd (1)expression presented in Equation (2).
r I B
2
0
(2)
Where r is the distance between the conductor and the measurement point and µ0 is the vacuum
magnetic permeability, µ0=4π10 -7
T m/A. Even whether Verdet constant is comparatively small for silica optical fibers [12], Equation (1) shows that the polarization angle can be large enough due to fiber length. Thus a typical setup of OFCS is to wrap the optical fiber around the conductor in order to achieve sufficient interaction length, d. One of the simplest experimental setup to observe Faraday Effect response is the optical power method which will be discussed, theoretically and experimentally, in the next section.
III. THE OPTICAL POWER METHOD
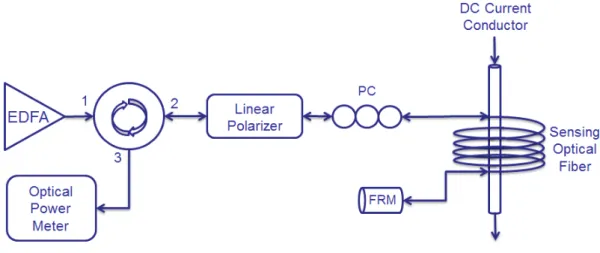
This method allows measuring DC current that flows through a conductor by analyzing the system optical power behavior when the current value is changed [8]. The setup scheme is presented in Fig.1.
A. Setup and Description of the Method
In this scheme, a depolarized light provided by an EDFA ASE, passes through a circulator and goes through a polarizer, which insertion loss and extinction ratio are, respectively, 0.31dB and 30dB, before entering in a standard fiber coil whose length is 7.89 km, which is wrapped around a DC current conductor. At the end of the fiber length, the light is reflected by a Faraday rotator mirror, FRM, and the reflected light travels the entire path back until it optical power is measured in a power meter. Also a manual Polarization Controller, PC, is added in the setup to simulate external disturbances such as mechanical stress, temperature changes and bend.
Fig. 1. Setup for DC current measurement based on the optical power change.
B. Theoretical Analysis
Extended Malus’ Law, deduced using Stokes formalism and Mueller matrices as presented in the following.
The Stokes vector of the light just after the polarizer, that enters the
sensor,
S
0inS
1inS
2inS
3in
T, and the Stokes vector of the light detected by the power
meter,
S
0outS
1outS
2outS
3out
T, are related by Equation (3).
in in in in rot pol out out out outS
S
S
S
S
S
S
S
3 2 1 0 3 2 1 0M
M
(3)Where,Mpol, defined by Equation (4), is the Mueller matrix of the polarizer and
M
rot, shown inEquation (5), is the Mueller matrix which give the rotation angle,
, of the polarization, described, in this case, by Equation (6). 0 0 0 0 0 0 0 0 0 0 1 1 0 0 1 1 2 1 pol
M (4)
1 0 0 0 0 ) 2 cos( ) 2 ( 0 0 ) 2 ( ) 2 cos( 0 0 0 0 1
sen sen rotM (5)
N I (6) Where, ϑ=μfυ and μf is the fiber magnetic permeability constant, I is the DC current flowingthrough the conductor and N is the number of turns around the optical fiber . The combination of Equation (4) and Equation (5) with Equation (3) may deduce the expression presented in Equation (7).
0 0
[1
1cos(2 )
2(2 )]
2
in
out
S
in inS
s
s sen
(7)The normalized Stokes parameters presented in Equation (7) are described by Equation (8) and Equation (9). in in in
S
S
s
0 11
(8)
in in in
S
S
s
0 22
(9)C. Experimental Tests and Results Analysis
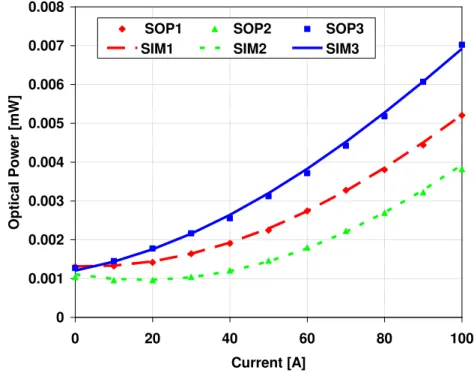
Tests were made by applying a DC current in the conductor, varying from 0 to 100A for three different states of polarization, SOP, and measuring the optical power in the power meter. The results are shown in Fig.2. It is possible to notice the dependence between optical power and light state of polarization. Therefore a SOP change due to stress bend or any external disturbance may mask the SOP change due solely to the current change. Thereat, the results may be imprecise as shown in Fig. 2, where three different SOP results in three different optical powers responses named as SOP1, SOP2 and SOP3 for the same applied current. In a practical application, power method must be modified. Indeed, it has been proposed by the literature different setups, based, for example, in more complex arrangements such as interferometric measurements and also on the use of polarization maintaining fibers [9]. A simple modification in order to minimize the environmental disturbances is the use of polarization maintaining fibers, but this strategy would increase the system cost.
In Fig. 2, we also show the theoretical curve fit for three characterizations intending to verify the application of the Extended Malus Law shown in Equation (6). It is possible to observe that the experimental results match with the theoretic curves, which validates the proposed scheme. To fit these curves we let the parameters,
s
1in,s
1in, S0in andk
2
N
to be adjusted by a nonlinear curve fit method, for the SOP1 case. After these parameters were obtained, we fixed S0in andk 2
N ,and applied the fit again for SOP2 and SOP3, and the results are shown in Fig. 2. As can be seen in the figure, the theoretical fits (dashed and solid lines) well reproduce the measured (symbols) values.
0 0.001 0.002 0.003 0.004 0.005 0.006 0.007 0.008
0 20 40 60 80 100
Current [A]
O
pt
ical P
ow
er [mW]
SOP1 SOP2 SOP3
SIM1 SIM2 SIM3
IV. THE DOPMETHOD
The DOP method, first proposed by Feng Liu et al [10] has the advantage of being a priori insensitive to the SOP changes due to environmental disturbances. However, this fact was not experimentally verified, according to our knowledge, until now. Moreover, theoretical expressions reported in [10] were not fitted to any experimental data. Indeed, the presented zero current response is not in agreement with the theoretical expected value of unitary DOP.
This method is applied to measure DC current flowing through a conductor. Unlike the optical power method, this one is less affected by external disturbances and presents therefore more reliable results [10]. As the DOP is a quantity insensitive to SOP changes, a standard fiber can be employed in the setup.
A. Setup and Description of the Method
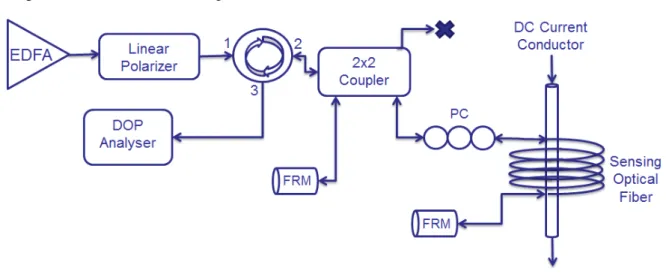
Fig. 3 describes the sensor setup structure.
Fig. 3. Experimental setup of the current sensor based on the DOP technique.
The DOP method also uses a depolarized light source provided by the Amplified Spontaneous Emission, ASE, of an Erbium Doped Fiber Amplifier, EDFA. The incident light is also polarized by a polarizer which insertion loss and extinction ratio are, respectively, 0.31dB and 30dB, and is directed to a 2x2 coupler by a circulator. Then, it experiences a polarization rotation when it passes through the X-shaped cavity formed by the coupler and the two Faraday Rotator Mirrors, FRM. A standard fiber coil is wrapped around the current conductor. After, the optical signal is directed by the circulator to a DOP meter. The FRM are used because they are non reciprocal elements, what means that the SOP changes due to the magnetic field will not be annulled when the light pulse is reflected.
B. Theoretical Analysis
In this section, the relations between DOP and polarization state angle will be explained by theoretical analysis. Assuming that the Stokes component is S3=0. As light travels back and forth in the fiber under test, the Faraday rotation angle for each value of DC current is still given by Equation (6) for each double pass in the optical fiber coil that surrounds the conductor.
The expressions of the Stokes components and the DOP in respect to the output light can be deduced in function of the coupler ratio, K, and the plane of polarization rotation angle, ϴ, as shown in the subsequent equations.
2 2 0 1 (1 ) M n in n
S P K K
(10)2 2
1
1
(1 ) cos( )
M n in
n
S P K K n
(11)2 2
2
1
(1 ) ( )
M n in
n
S P K K sen n
(12)2 0 2 3 2 2 2 1 S S S S
DOP
(13)
Where, in Equations (10), (11) and (12), n is the number of times that light travels back and forth in the X-shaped cavity and M is the maximum number of those travels which the reflected beam optical power is high enough to contribute with the sum of different states of polarization in the cavity. This deduction is a new contribution presented in this article and differs from the mathematical model proposed by [10] for in this new method the successive reflections are trunked in a value that depends on the used sensing fiber length. In this experiment, M=4. Equation (13) shows the DOP relation with the Stokes components and, consequently, a function of K and ϴ.
C. Experimental Tests and Results Analysis
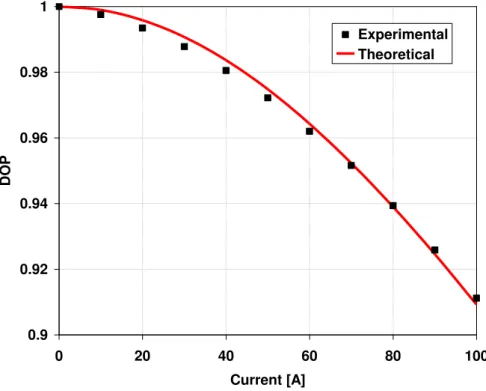
The first experience made using this method and presented here is the comparison between a theoretical and an experimental curve. For that purpose, the current in the conductor were varied from 0 to 100A. The optical fiber coil has 12711 turns around the conductor and its length is 7.99 km. The Verdet constant of the fiber is 0.02057µA/m and the coupler ratio, K, is 0.95. The results are presented in Fig.4, where we plotted the DOP normalized by the zero current value in order to better fit to theoretical results. We stress, however, that the value of DOP for zero current, the initial system’s DOP, before normalization is 0.996, very close to unitary theoretical values of Equation (13).
0.9 0.92 0.94 0.96 0.98 1
0 20 40 60 80 100
Current [A]
DO
P
Experimental Theoretical
Fig. 4. Experimental and theoretical results using the DOP method.
Also a table was made comparing the measured current by DOP with the applied current. The results are shown in Table I.
TABLE I.EXPERIMENTAL VALUES OF APPLIED AND MEASURED CURRENT
Applied Current (A) Measured Current (A)
0 0
10 12
20 20
30 35
40 42
50 52
60 62
70 70
80 78
90 87
100 98
The average relative error between the applied and measured current is 4.8%.
0.9 0.92 0.94 0.96 0.98 1
0 20 40 60 80 100
Current (A)
DO
P
SOP1
SOP2
SOP3
Fig. 5. Current measurement using DOP method for three different SOPs. Dotted lines are guides for the observer.
Based on Fig. 5, we can observe the stability of the DOP method over the SOP fluctuations. For each characterization, the current versus DOP curve changed below 0.4% which corresponds to an absolute DOP variation of 0.0033 for the entire excursion of current from 0 to 100 A. It is the first time to our knowledge, that this insensitivity of the DOP method to SOP variations due to environmental conditions is demonstrated experimentally. Also, for the first time, the DOP value for zero current is reported to be close to the theoretical predicted unitary values of Equation (13). These results make the DOP method a trustworthy and sturdy method, which are desirable features in a sensor.
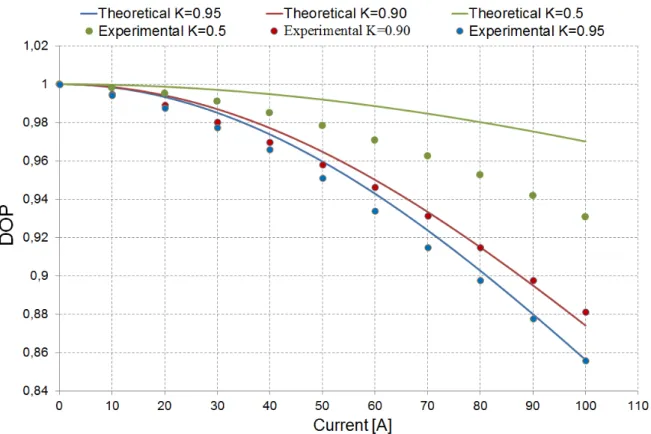
Fig. 6. Theoretical (full traces) and experimental (dots) comparison between the DOP versus Current curves for three different couple rates.
Analyzing Fig. 6 shows us that increasing the couple rate results in a more sensitive sensor and in an increase in the signal excursion. Thus, we may infer that, for lower the current we want to measure, higher must be the couple rate, K. Also, we observed that the theoretical traces were coherent to the experimental results for all the couple rates tested except to the 50% one. We still are not able to explain that, but it will be part of our next studies.
V. CONCLUSION
We also made, for the first time know, a theoretical and experimental comparison between the signal behavior when changing the coupler rate in the DOP method and we verified that the signal excursion is higher for higher couple rates
REFERENCES
[1] Keith Malmedal, P. K. Sen, “Potential of massively deployed sensors applications in substation engineering,” IEEE 2007.
[2] J. D. P. Hrabliuk, “Optical current sensors eliminate CT saturation,” NxtPhase Corporation, IEEE 2002.
[3] E. MacLean, V. K. Jain, “A Power Transmission Line Fault Distance Estimation VLSI Chip: Design and Defect
Tolerance,” IEEE International Symposium on Defect and Fault Tolerance in VLSI and Nanotechnology Systems,
2011.
[4] Ferry A. Viawan, Jianping Wang, Zhao Wang and Winnary-Ying Yang, “Effect of current sensor technology on
distance protection,” IEEE 2009
[5] H. Guerreiro, R. Pérez del Real, R. Fernández de Caleya and G. Rosa, “Magnetic fiel biasing in Faraday effect sensors,” Applied Physics Letters, vol. 74, Nº 24, June 1999.
[6] Xiao-Jing Ni, Min Huang, “Faraday effect optical current/magnetic field sensors based on cerium-substituted yttrium
iron garnet single crystal,” IEEE 2010.
[7] Farnoosh Ramatian, James N. Blake, “Applications of high-voltage fiber optic current sensors,” IEEE Power Engineering Society General Meeting, 2006.
[8] C. C. Kato, A. M. B. Braga, L. C. G. Valente, L. P. Salvini, C. Fortier, M. M. Nogueira, “Sensor à fibra óptica para medição de correntes elevadas em linhas de transmissão,” ANEEL P&D programm.
[9] K. Bohnert, P. Garbus, H. Brändle and P. Guggenbach, “Fiber-optic dc current sensor for the electro-winning
industry,” 17th Int. Conference on Optical Fibre Sensors, Bruges, Belgium, May 2005.
[10]Feng Liu, Qing Ye, Jianxin Geng, Ronghui Qu and Zujie Fang, “Study of fiber-optic current sensing based on degree of
polarization measurement,” Chinese Optics Letters, vol. 5, Nº 5, May 2007.
[11]He Wen, Matthew A. Terrel, Hyang Kyun Kim, Michel J. F. Digonnet and Shanhui Fan, “Measurements of the birrefringence and Verdet constant in an air-core fiber,” Journal of Lightwave and Technology, vol. 27, Nº 15, August 2009.