PROTEIN EXTRACTION AND COMPARISON OF STAIN
PROTOCOLS FOR ANALYSIS OF TWO-DIMENSIONAL
ELECTROPHORESIS GELS
Joana Silva 1, Ana Sofia Carvalho 1, Rui Vitorino 2, Pedro Domingues 2, Paula Teixeira 1, * and Paul Gibbs1
1
Escola Superior de Biotecnologia, Universidade Católica Portuguesa Rua Dr. António Bernardino de Almeida, 4200-072 Porto, Portugal.
Corresponding author: [email protected]
2
Universidade de Aveiro, Departamento de Química, Campus Ap. Universitário de Santiago, 3810 Aveiro, Portugal
Abstract: Protein extraction and the proteome of Lactobacillus delbrueckii subsp. bulgaricus were studied using different stains. The reversible silver staining technique was shown to be more sensitive than the irreversible silver stain. Coomassie colloidal was demonstrated to be as sensitive as reversible silver stain; however, the Coomassie colloidal blue solution developed a higher background and for sample preparation was more time-consuming.
Keywords: Lactobacillus bulgaricus, protein extraction, 2-DE electrophoresis, staining, sensitivity.
INTRODUCTION
Lactobacillus bulgaricus is commonly used as a starter organism in the production of yoghurt
and Swiss-type cheeses. During dairy processes cultures suffer a variety of stresses that interfere with their viability, activity and resistance to other adverse conditions [5, 16, 17]. Previous work had suggested the involvement of stress proteins in cell adaptation to the environmental stress conditions imposed by these stresses [1, 6, 10]. Lactic acid bacteria produce lactic acid during sugar fermentation, which implies a frequent exposure of the cells with acid stress [4, 10]. As a response to acid stresses, bacteria have evolved a variety of adaptive strategies [3, 6, 9, 14]. The best studied stress response in bacteria is heat shock (HS), which, like other stress responses, is characterized by the transient induction of specific proteins and physiological changes that generally enhance the ability of an organism to withstand more adverse environmental conditions.
To date, there is no in-depth understanding of the general proteome of L. bulgaricus grown under controlled pH. In this work, sample preparation, separation and staining techniques of L. bulgaricus were studied in terms of resolution, sensitivity and further analyses. An efficient technique to extract proteins of
L. bulgaricus (a bacterium very difficult to lyse) and high-resolution separation by 2DE is described. This
study only used 2D gel electrophoresis comparison and protein expression maps, and built a single composition image using landmarking, alignment and warping algorithms and software.
1. MATERIALS AND METHODS 1.1. Bacterial Cultures
Lactobacillus delbrueckii ssp. bulgaricus, hereafter termed L. bulgaricus, originally isolated
from yoghurt, was used. Working cultures were grown on MRS (De Man, Rogosa, Sharpe broth, Biokar Diagnostics, Beauvais France) plus 1.5% agar, as agar slants (37ºC, 24h). Slopes were maintained at 4ºC and sub-cultured every month.
MRS broth was inoculated from the MRS agar slopes and incubated at 37ºC for 24 h. This cell suspension was then used to inoculate another MRS broth (1% v/v). The cultures were incubated under agitation by a magnetic stirrer bar at 37ºC with pH controlled to pH 6.5 (automatic addition of 1M sodium hydroxide) during 24 h. Cells were harvested by centrifugation at 7000 × g for 15 min. (4ºC).
1.2. Protein Extraction for 2-DE
Harvested cells were washed twice with Tris-Acetate-EDTA buffer (TAE, pH 7.0) and were incubated with 100 mg/ml of lysozyme (Sigma, St. Louis, USA; 20µl lysozyme:20 ml buffer) at 37ºC for 2.5h. The cell suspension was then disrupted by grinding in a vortex with glass beads (150-212 µm diameter, Sigma). Between each disruption cycle cells were cooled on ice. The disrupted suspension was then centrifuged (4ºC) at 7000 × g for 15 min and the supernatant was stored at –80ºC until use. Protein concentration in the supernatant was determined according to Lowry, Rosenbrough, Farr and Randall (1951).
1.3. Two-Dimensional Polyacrylamide Gel Electrophoresis (2-DE)
Prior to 2-DE analyses, sample quality and protein concentration were assayed by analytical one-dimensional SDS polyacrylamide gel electrophoresis on a 12.5% v/v mini gel. Supernatant aliquots (no more than 50µL) containing a total protein content of 60 µg were diluted appropriately to make 250µL of a rehydration solution containing 4% w/v CHAPS, 12.9mM DTT, 0.1% v/v IPG ampholytes 4-7, 9M urea, 2M thiourea, 0.01% Bromophenol Blue [12] and loaded onto an immobilized pH 4-7 gradient strip (IPG) 13 cm (Pharmacia Biotech, Buckinghamshire, UK). Rehydration occurred during 12 hours applying 50 µA per IPG strip. Following rehydration, the voltage was increased to 500V during the first hour and to 1000V during the second hour, followed by 8000V for an additional period of 2 hours (Hoefer 2100, Pharmacia). After this isoelectric separation, the IPG gel strips were transferred onto vertical slab gels with a Laemmli-SDS-discontinuous system (12.5% acrylamide gels of 1mm thickness) during 5 h at 200 V (Hoefer 600, Pharmacia). After silver and Coomassie colloidal staining (detailed protocols in Table 1), gels were scanned with a laser densitometer (BioRad) and analysed with PDQuest Software (BioRad). At least two independent experiments were performed.
Table 1. The stain silver protocols.
Reversible silver stain Irreversible silver stain
Step Solution (250ml per gel) Time (min) Solution (250ml per gel) Time (min)
Fix 250ml acetic acid, 100 mlmethanol 30 100 ml methanol, 33.75 mlformalin 10
Wash 250 ml water 5 Wash 250 ml water 5 Sensitization 75ml methanol, 10ml sodium thiosulphate 5%, 17g sodium acetate 30
Thiosulphate 0.05g sodium thiosulphate 0.02% 1
Wash 250 ml water 7
Wash 250 ml water 7
Silver 0.625g silver nitrate 20 0.25g silver nitrate 10
Developing solution 6.25g sodium carbonate, 0.1ml formalin 1 or 3 7.5g sodium carbonate, 0.251ml formalin, 0.2ml sodium thiosulphate
Stop 3.65g EDTA 10 6g citric acid 10
Wash 250 ml water 250 ml water
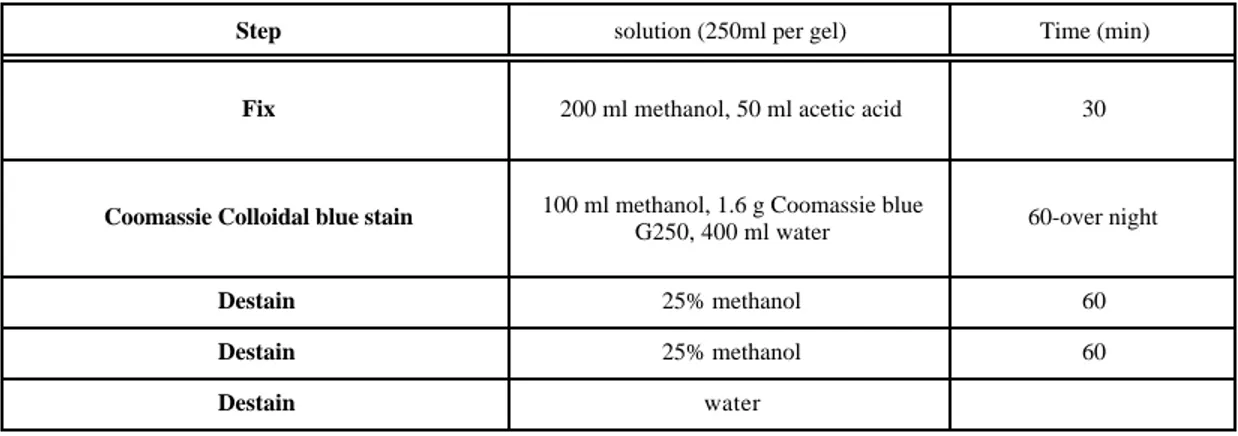
Table 2. Coomassie colloidal blue protocol.
Step solution (250ml per gel) Time (min)
Fix 200 ml methanol, 50 ml acetic acid 30
Coomassie Colloidal blue stain 100 ml methanol, 1.6 g Coomassie blue
G250, 400 ml water 60-over night
Destain 25% methanol 60
Destain 25% methanol 60
2. RESULTS
The standard procedure for the extraction of proteins of Gram-positive microorganisms involves prolonged lysozyme treatment, adding SDS and then boiling for 10 min, due to the extreme lysozyme resistance of the cells. This method was performed for L. bulgaricus and considerable interference with the Lowry assay was shown, resulting in problems determining the exact protein concentration and further analyses by SDS page. With the extraction method described in the present work, no problems were observed in determining the protein concentration of the samples.
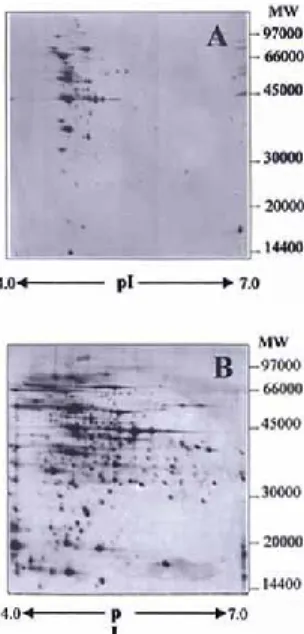
Two silver staining methods, an irreversible silver stain (Fig. 1A) and a reversible silver stain (Fig. 1B) were compared. When reversible silver staining compatible with mass spectrometry, was used, a greater number of different spots was observed than when using the irreversible silver stain (Fig. 1A and 1B); 487 spots and 122 spots, respectively, were observed by reversible silver stain and by the irreversible stain. A comparison of the visualisation of proteins of L. bulgaricus grown at controlled pH by Coomassie colloidal blue staining and reversible silver stain after 2-DE was performed (data not shown). When Coomassie colloidal blue stain was used, a protein pattern similar to that observed by the reversible silver stain was obtained. Coomassie colloidal blue stains are typically not used because of poor sensitivity and therefore high levels of protein. The main limitations of this method are heavily stained backgrounds, which makes quantification difficult and poor detection limits [13].
Figure 1. Gel images of L. bulgaricus grown under controlled pH; A- irreversible silver stain and B-reversible silver stain.
3. DISCUSSION
Prior to 2-DE analyses, the method of extracting proteins from cells of L. bulgaricus (a Gram-positive bacterium, very difficult to lyse) had to be optimised, since over-estimated values were obtained
by Lowry assay. Total protein extraction was obtained when just enzymic (lysozyme) and mechanical (glass beads) methods were used in conjunction. A diverse range of substances has been found to interfere with Lowry estimation of proteins. These compounds include amine derivatives, amino acids, buffers, detergents, drugs, lipids, sugars, nucleic acids, salts and sulphydryl reagents. One alteration to the protocol was the removal of sodium dodecyl sulphate as this compound interferes strongly with protein determination by the Lowry method. SDS is a detergent that binds strongly to proteins and causes the folded proteins to become denatured into extended “rods” coated with SDS and the separation of the denatured detergent-coated polypeptide chains will be due almost exclusively to the size of the polypeptide chains.
Initially, in order to obtain some spots we had used a higher protein concentration that interferes with iso-electrofocusing (IEF), the first dimension, however, high protein concentrations contribute to losses and over-focusing of proteins. To avoid these problems and to increase the sensitivity of the two-dimensional gels, silver staining was studied. To increase the sensitivity of the method, a solution containing urea and thiourea was used. These modifications result in higher solubility of proteins during IEF, thereby increasing the resolution, avoiding losses of proteins by precipitation at their isoelectric points and overfocusing [12]. Silver staining is a multistep process utilizing numerous reagents, the quality of which is critical. What makes a silver stain highly sensitive is the strong autocatalytic character of silver reduction. This condition is achieved by using a very weak developer and sensitizers between fixation and silver impregnation [18]. We report here two silver staining methods, one of which is compatible with subsequent in-gel digestion, matrix-assisted laser desorption/ionization (MALDI), and electrospray spectrometry ionization (ESI) analysis. The methods are based on that of Haeukeshoven and Dernick (1985), but omit the sensitisation step and formaldehyde in the silver impregnation step.
Protocols using fixation with an aldehyde (reversible silver stain) are more sensitive, more linear and uniform from protein to protein, and more reproducible. Protocols using short steps (< 1 min.) are less reproducible than protocols using longer steps. The aldehyde-free fixation is more prone to negative staining phenomena (hollows or doughnuts), suggesting the importance of the reversible silver stain method to visualize low concentration of proteins (in the low-nanogram range) [12]. The sensitization treatment with sodium thiosulphate was found necessary to obtain a completely transparent gel background and was harmless toward protein molecules [14].
It has been reported by [2] that band patterns produced by Coomassie blue G-250 and reversible silver stain showed similarities. In the current study, a comparison of both staining methods showed this behaviour, however, with a higher background in Coomassie blue staining and with different detection limits of protein concentration; 50-100 ng in Coomassie staining method and 1-10 ng in reversible silver stain. Both Coomassie Colloidal blue stain and reversible silver stains can be used in MALDI and ESI analysis, nevertheless, in the reversible silver stain the pieces of gel before in-gel digestion are easier to wash, reducing the washing steps and easing the subsequent analysis [14]. To promote efficient enzymatic cleavage and to reduce the background for subsequent mass spectrometric analysis, any excess Coomassie blue must be carefully removed. The staining and destaining slows down the procedure and limits its throughput, and the extensive washing steps could lead to protein losses.
When cell extracts were stained with the irreversible silver stain, 22.6% of the total spots were obtained as compared with cell extracts stained with the reversible silver stain. A lower protein concentration was visualized more readily by the reversible silver stain. The improved sensitivity of the reversible silver stain might be useful in studies of stress responses of microorganisms, since the proteins synthesised in response to stresses appear in areas of gels where many normal proteins are also present.
ACKNOWLEDGEMENTS
Financial support for authors Silva and Carvalho was provided respectively by PhD fellowships issued by PRAXIS XXI (JNICT – BD – 19713 - 99 and JNICT – BD - 18512 - 98, respectively).
REFERENCES
[1] Bâati, L., Fabre-Gea, C., Auriol, D. and Blanc, P.J. (2000) Int. J. Food Microbiol., 59 , 241-247. [2] Beeley, J. A., Newman, F., Wilson, P. H., Shimmin, I. C. (1996) Electrophoresis, 17 , 505-506. [3] Broadbent, J. R. and Lin, C. (1999) Cryobiology, 39 , 88-102.
[4] De Angelis, M., Bini, L., Pallini, V., Cocconcelli, P. S. And Gobbetti, M. (2001) Microbiology, 147, 1863-1873.
[5] Gouesbet, G., Jan, G. and Boyaval, P. (2001) Lait, 81 , 301-309.
[6] Gouesbet, G., Jan, G. and Boyaval, P. (2002) Appl. Environ. Microbiol., 68 , 1055-1063. [7] Haeukeshoven, J. and Dernick, R. (1985) J. Chromatogr., 326, 91-101.
[8] Laemmli U. K. (1970) Nature, 15 , 680-5.
[9] Lim, E. M., Lafon, A., Dridi, L., Boudebbouze, S., Ehrlich, S. D. and Maguin. (2001) Lait, 81 , 317-325. [10] Lorca, G. L. and de Valdez, F. (2001) Cur. Microbiol., 42 , 21-25.
[11] Lowry O. H., Rosenbrough N. J., Farr A. L. and Randall J. L. (1951) J. Bio. Chem., 193, 265-75 [12] Rabillou, T. (1998) Electrophoresis, 19 , 758-760.
[13] Rabillou, T. (2000) Anal. Chem., 1, 48-55.
[14] Rechinger, K. B., Siegumfeldt, H., Svendsen, I. and Jakobsen, M. (2000) Electrophoresis, 21 , 2660-2669.
[15] Shevchenko. A., Wilm, M., Vorm, O. and Mann, M. (1996) Anal. Chem., 68, 850-858. [16] Teixeira, P., Castro, H. and Kirby, R. (1995a) J. Appl. Microbiol., 78 , 456-462. [17] Teixeira, P., Castro, H. and Kirby, R. (1995b) J. Dairy Sci., 78 , 1025-1031.
[18] Yan, J.X., Wait R., Berkelman, T., Harry, R., Westbrook, J., Wheeler, C., Dunn, M. (2000)