D
O FINANCIAL LIBERALIZATION AND DEVELOPMENT MATTER FORCOUN-TRIES
’
INCOME INEQUALITY?
T
HE MEDIATING EFFECT OF CORRUPTIONFrancisco Luís Marques de Queirós Reis e Melo
Dissertation
Master in Economics
Supervised by Aurora Teixeira
Bio
Francisco Melo is 23 years old. Born in Porto in 1995, he began his early studies at Escola do Carvalhal before attending Colégio Luso-Francês. After finishing high school, Francisco started the Management Bachelor’s degree at Faculdade de Economia da Universidade do Porto, where he also enrolled in the Master in Economics.
While studying Management and Economics, Francisco had two professional experiences in start-ups at UPTEC, where he developed business model and market analyses, and took a three-year German language course.
Acknowledgments
To Professor Aurora Teixeira, my supervisor, for all the support, help, availability and pa-tience on advising and teaching me. Without her knowledge, this work would not have been possible to accomplish, and I would not be the student I am today.
To my family, for all the motivation, support, interest and enthusiasm and for being by my side whenever I needed. Undoubtedly, I owe them this successful path.
To my friends and colleagues, for all the good moments, for all I learnt from them and for the comprehension for not being present in several moments for the last two years.
Abstract
In recent years, income inequality has become a major topic of analysis. Several factors, such as quality of institutions, corruption, labour markets, technological change or financial liberalization and financial development, have been suggested as possible causes. Regarding the latter two factors the empirical literature is still scarce and not conclusive. Moreover, the potential mediating effect of corruption on the relation between financial liberalization and financial development and income inequality has been overlooked.
Thus, in order to fill in these gaps, the focus of the present study is on assessing the impact of financial liberalization and financial development on countries’ inequality and on evalu-ating how this impact is mediated by countries’ corruption levels. For pursuing such en-deavour, we resort to panel data estimation techniques on a sample of 127 countries be-tween 2000-2017.
We found three main results. First, financial development unambiguously contributes to decrease countries’ income inequality. Second, financial liberalization has not a clear-cut impact on income inequality; it decreases income inequality when financial liberalization indicator is measured by the net foreign direct investment inflows (in percentage of the GDP) but it aggravates income inequality when the proxy for financial liberalization is the countries’ degree of capital account openness. Third, corruption emerges as a significant mediator for the relationship between financial liberalization/ development and income inequality. Albeit, as expected, corruption jeopardizes more equal income distribution, it was found that in contexts characterized by high levels of corruption (or low transparency), the decreasing effect of financial development on income inequality is leveraged. In con-text paved by middle degree of corruption, when statistically significant, both financial development and financial liberalization reduces income inequality. For highly transparent/ low corruption contexts, neither financial liberalization nor financial development matters for explaining income inequality.
Summing up, if the aim of public authorities in high and middle corruption contexts is to reduce income inequality, their efforts should be directed towards attracting more foreign direct investment and/or developing financial markets by improving the private credit lev-els and the monetization ratio.
JEL Codes: D31; D63; D73; O11; O15
Resumo
Nos últimos anos, a desigualdade de rendimentos tem sido um tópico importante de análi-se. Vários factores têm sido sugeridos como causas, tais como a qualidade das instituições, a corrupção, o mercado de trabalho, mudanças tecnológicas, liberalização financeira ou desenvolvimento financeiro. Relativamente aos dois últimos tópicos, a literatura é escassa e inconclusiva. Para além disso, o potencial efeito mediador da corrupção na relação entre as variáveis liberalização e desenvolvimento financeiro e a desigualdade de rendimentos tem sido negligenciado.
Deste modo, para preencher as lacunas da literatura, o objetivo deste estudo passa por ana-lisar o impacto da liberalização e do desenvolvimento financeiros na desigualdade de ren-dimentos dos países e por avaliar como o impacto é mediado pelo contexto de corrupção. Para pôr esta análise em prática, recorremos a técnicas de estimação de dados em painel para uma amostra de 127 países, no período 2000-2017.
Com esta análise, alcançámos três principais resultados. Em primeiro lugar, o desenvolvi-mento financeiro contribui inequivocamente para a redução da desigualdade de rendimen-tos dos países. Em segundo, a liberalização financeira não tem um impacto claro na desi-gualdade de rendimentos; diminui-a quando é medida pelas entradas líquidas de investi-mento directo estrangeiro (em percentagem do PIB), mas aumenta-a quando a proxy é o grau de abertura da conta de capital dos países. Em terceiro, a corrupção é uma variável mediadora na relação entre liberalização/ desenvolvimento financeiros e a desigualdade de rendimentos. Apesar de, como esperado, a corrupção ter impacto negativo na distribuição de rendimentos, os nossos resultados apontam para o facto de, em contextos de alta cor-rupção (baixa transparência), o efeito redutor do desenvolvimento financeiro na desigual-dade de rendimentos ser exacerbado. Em contextos de média corrupção, quando estatica-mente significativo, tanto o desenvolvimento financeiro como a liberalização financeira reduzem a desigualdade de rendimentos. Em contextos de baixa corrupção (alta transpa-rência), nem a liberalização financeira nem o desenvolvimento financeiro são relevantes para explicar a desigualdade de rendimentos.
Em suma, no caso de as autoridades públicas terem o objectivo de reduzir as divergências de rendimentos, em contextos de alta e média corrupção, os esforços devem ser direccio-nados para atrair investimento directo estrangeiro e/ ou para desenvolver os mercados fi-nanceiros melhorando os níveis de crédito privado e o rácio de monetização.
Index Bio ... i Acknowledgments ... ii Abstract ... iii Resumo ... iv Index of Tables ... vi
Index of Figures ... vii
1. Introduction ... 1
2. The impact of financial liberalization and financial development on countries’ income inequality: a literature review ... 4
2.1. Relevant concepts ... 4
2.1.1. Financial liberalization ... 4
2.1.2. Financial development ... 5
2.1.3. Income inequality ... 7
2.2. Mechanisms that link financial liberalization to income inequality ... 8
2.3. Mechanisms that link financial development to income inequality ...11
2.4. Financial liberalization/ development and income inequality: the mediating factor of corruption ...13
2.5. Empirical evidence ...16
2.5.1. Financial liberalization ...16
2.5.2. Financial development ...17
3. Methodology ...20
3.1. Main hypotheses and the choice of the methodology ...20
3.2. Econometric specification ...21
3.3. Data sources and variables’ main proxies...21
4. Empirical results ...24
4.1. Descriptive statistics ...24
4.2. The impact of financial liberalization and development on income inequality: empirical results ...32
5. Conclusion ...39
5.1. Main contributions...39
5.2. Policy implications ...41
5.3. Limitations and paths for future research ...41
Index of Tables
Table 1: Financial Liberalization definitions and indicators ... 5
Table 2: Financial Development definitions and indicators ... 6
Table 3: The impact of financial liberalization/development on income inequality: empirical evidence ...18
Table 4: Descriptive statistics ...24
Table 5: Countries by groups of transparency ...26
Table 6: Correlation matrix ...31
Index of Figures
Figure 1: Mechanisms that link financial liberalization/development to income inequality and the
mediating effect of corruption ...15
Figure 2: Gini index, global and by countries’ transparency group, 2000-2017 ...27
Figure 3: Financial liberalization, 2000-2017 ...28
Figure 4: Financial development, 2000-2017 ...29
Figure 5: GDP per capita growth, 2000-2017 ...30
Figure 6: Trade openness, 2000-2017 ...30
1. Introduction
In the last decades, governments of both developed and less developed countries targeted the reduction of income inequalities as a top priority, especially after the financial crisis (OECD, 2018a). In 2013, former US President Barack Obama reported rising income ine-quality as the “defining challenge of our time”, adding that his administration would focus all efforts on it during his presidency.1 According to the World Bank (2018),2 income
dis-parities reduction is fundamental in order to guarantee opportunities and mobility for today and upcoming generations. Presently, within country inequality is higher than it was in the beginning of the 90s, undermining sustained economic growth, poverty reduction, social stability and opportunities’ access (World Bank, 2018).3
According to the World Inequality Lab (2018), rising income disparities might lead to catas-trophes in the political and social fields. Between 1980 and 2016, the income of the richest 1% increased the double of the poorest 50%, resulting in a shrinkage of the middle class in EU and USA. The income growth of the individuals of the bottom 50% of the world population was nearly 0% for the same period. In 2016, according to OECD (2018a), in-come inequality in OECD countries reached its highest level from the last fifty years with “the average income of the richest 10% of the population [being] about nine times that of the poorest 10% across the OECD, up from seven times 25 years ago”.4
Income inequality is generally associated with economic inefficiency and lower economic growth (OECD, 2017), perceived as socially unfair, weakening social stability and solidarity (Todaro and Smith, 2015).
Recent literature (see Bumann and Lensink, 2016) suggests several causes for income ine-quality, namely financial liberalization and financial development, the quality of institutions, corruption, labour markets, and technological change. Regarding the two first determinants - financial liberalization (that is, reduction in the government’s role in financial markets)
1 In https://www.theguardian.com/world/2013/dec/04/obama-income-inequality-minimum-wage-live, in
The Guardian, accessed on the 9th October 2018.
2 In https://www.worldbank.org/en/topic/isp/overview#1, accessed on the 20th October 2018.
3 However, according to Peterson (2017), there is a common agreement that total income distribution equality
is not fair nor desirable. As individuals make different contributions to the output, having different approach-es and attitudapproach-es towards work, in a market economy it is a natural rapproach-esult to have different rewards based in the citizen’s contribution (Mankiw, 2013). According to Mankiw (2013) and Watson (2015), having equality of opportunities is the key to a fair income inequality as it is a result of personal endeavour. In fact, countries with the greatest degree of divergences in opportunities are the ones with higher income inequality levels (Deaton, 2013).
and financial development (increase in the volume of financial activity) –, extant theoretical and empirical studies have produced ambiguous results, leaving an open debate.
At the theoretical level, some authors (e.g., Bumann and Lensink, 2016) contend that finan-cial liberalization reduces income disparities through an increase in the efficiency of banks and a decrease in borrowing costs, whereas others (e.g., de Haan, Pleninger, and Sturm, 2017) suggest that financial liberalization might lead to market volatility and consequently uncertainty, leading low income individuals to increase their savings, which cause a decline in interest rates, and amplify income inequalities. Additionally, Beck, Demirgüç-Kunt and Levine (2007) and de Haan and Sturm (2017) underline that on the one hand, the poorer, which lack collateral and credit histories, may be benefited by the relaxation of credit con-straints, that is, by financial development; but, on the other hand, an increase in the quality and quantity of the financial services tend to benefit the richer (Greenwood and Jovanovic, 1990; de Haan and Sturm, 2017).
At the empirical level, the debate about whether financial liberalization/development in-crease/ decrease income inequality is also intense. Concerning financial liberalization, ex-tant evidence for several parts of the globe, namely India (Ang, 2010), Africa (Batuo and Asongu, 2015), and large panels of countries (Bumann and Lensink, 2016; de Haan and Sturm, 2017) show that financial liberalization worsens income inequality. On the contrary, Bumann and Lensink (2016) found that it has the opposite impact on income disparities, but only in countries where financial depth- private credit over GDP- is high. With respect to financial development, Ang (2010) proved that financial development reduces income inequalities in India, while de Haan and Sturm (2017) reached the opposite result for a pan-el of 121 countries between 1975 and 2005.
Besides the absence of consensus regarding the impact of financial liberalization and fi-nancial development on income disparities, the relation between these set of variables is likely to be influenced by the quality of the institutions. Indeed, according to Delis, Hasan, and Kazakis (2014)and de Haan and Sturm (2017), in a strong institutional environment, financial development might allow the poorer to invest more in human and physical capital, reducing income disparities; in contrast, when institutions are weak, only the richer and more powerful have privileged access to financing and so financial development will prob-ably harm the poorer.
2011). Very few studies (e.g., Batabyal and Chowdhury, 2015; Adams and Klobodu, 2016) addressed the mediating effect of corruption on the relation between financial develop-ment and income inequality having concluded that corruption eroded the positive impact of financial development on income distribution in 21 Sub-Saharan African countries be-tween 1985-2011 (Adams and Klobodu, 2016) and in 30 Commonwealth countries during 1995-2008 (Batabyal and Chowdhury, 2015).Nevertheless, there has been no attempt in the literature to investigate the mediating effect of corruption on the relation between financial liberalization and income inequality.
Trying to contribute to the above literature gaps, the present study has two main aims: 1) to empirically assess the impact of financial liberalization and financial development on in-come inequality; 2) to analyse the mediating effect of corruption on these relations. For pursuing such endeavour, it will resort to fixed effects panel data model, for a sample of 127 countries over the period 2000-2017.
The remainder of this study is structured as follows. The next section details the main con-cepts, followed by a brief analysis of the mechanisms that link financial liberalization/ de-velopment to income inequality and the mediating impact of corruption, as well as an anal-ysis of the empirical evidence on the topic. Section 3 details the methodological approach, explaining the choice of the methodology, the econometric specification, the data sources and the proxies of the main variables. Section 4 presents the descriptive statistics and the empirical results of this study and the last section concludes.
2. The impact of financial liberalization and financial development on
countries’ income inequality: a literature review
2.1. Relevant concepts 2.1.1. Financial liberalization
Many studies investigate the issue of financial liberalization. However, no clear-cut defini-tion of such concept exists, with most studies referring the indicator of financial liberaliza-tion instead of its concept (see Table 1).
Starting with the studies that provide a conceptual definition of financial liberalization, Abiad, Oomes, and Ueda (2008) define it as a reduction in the government’s role and an increase in the role of financial markets. More recently, Abiad, Detragiache, and Tressel (2010), and Bumann and Lensink (2016) suggest that financial liberalization encompasses a set of government interventions in the financial sector in order to, for instance, remove entry barriers for new financial institutions, reduce reserve requirements, lift restrictions on capital accounts or privatize financial institutions. Agnello, Mallick, and Sousa (2012) add that financial liberalization entails the decline of the control of the financial sector by the government.
In those studies that do not present a specific definition for financial liberalization provid-ing instead a measure, the most frequent measure used is the Abiad, Detragiache, and Tres-sel (2010) financial liberalization index (Agnello, Mallick, and Sousa, 2012; Delis, Hasan, and Kazakis, 2014; Li and Yu, 2014; Christopoulos and McAdam, 2017; de Haan and Sturm, 2017; de Haan, Pleninger, and Sturm, 2017). This index encompasses the de jure changes in interest rate and credit controls, privatizations, international financial transac-tions restrictransac-tions and banks entry barriers (Abiad, Detragiache, and Tressel, 2010; de Haan and Sturm, 2017). Other alternatives, but less frequently used measures include the de jure Chinn and Ito (2008) capital account openness index (KAOPEN) (Batuo and Asongu, 2015; Bumann and Lensink, 2016; de Haan, Pleninger, and Sturm, 2017) or the de facto capi-tal account openness - foreign direct investment: FDI as percentage of GDP (Batuo and Asongu, 2015, Bumann and Lensink, 2016).
Table 1: Financial Liberalization definitions and indicators
Author Definition Measure/Indicator
Abiad, Detragiache, and Tres-sel (2010);
Bumann and Lensink (2016).
Set of government interventions in the financial sector in order to, for instance, remove entry barriers for new financial institutions, reduce reserve requirements, lift restrictions on capital accounts or privatize financial institutions.
Chinn and Ito (2008) capital account openness index (KAOPEN).
Abiad, Oomes, and Ueda
(2008). Reduction in government’s functions and an increase in financial markets’ role. Abiad and Mody (2005) financial liberalization index. de Haan, Pleninger, and Sturm
(2017). Reduction in the role of government and an increase in the role of financial markets.
Abiad, Detragiache, and Tressel (2009) financial liberalization index and Chinn and Ito (2008) capital account open-ness index.
Agnello, Mallick, and Sousa
(2012). Decline of the control of the financial sector by the government.
Abiad, Detragiache, and Tressel (2009) financial liberalization index.
Delis, Hasan, and Kazakis (2014).
No definition. Li and Yu (2014).
Christopoulos and McAdam (2017).
de Haan and Sturm (2017).
Ang (2010). Demetriades and Luintel (1996, 1997) Financial liberalization measure.
Batuo and Asongu (2015).
De jure Chinn and Ito (2008) capital
account openness index (KAOPEN) and de facto capital account openness (foreign direct investment: FDI as percentage of GDP).
Source: Own elaboration.
2.1.2. Financial development
In Levine’s (2005) broader concept, financial development includes an improvement in the quality of five key financial functions: information regarding possible investments and allo-cating capital; monitoring after alloallo-cating capital; easing diversification, trading and risk management; mobilizing and gathering savings; facilitate the exchange of financial instru-ments, goods and services. Also underlying the aspect of improvement, Adams and Klobodu (2016) contend that financial development involves an upgrading in several finan-cial intermediaries’ characteristics such as efficiency, quality and quantity, whereas Čihák, Feyen, Kunt and Levine (2012) sustain that it occurs when the effects of costs of transac-tion, limited enforcement and asymmetric and imperfect information are reduced by finan-cial intermediaries, instruments and markets. Finally, and in a simpler way, Abiad, Oomes, and Ueda (2008); de Haan and Sturm (2017) define financial development as an increase in the financial activity’s volume.
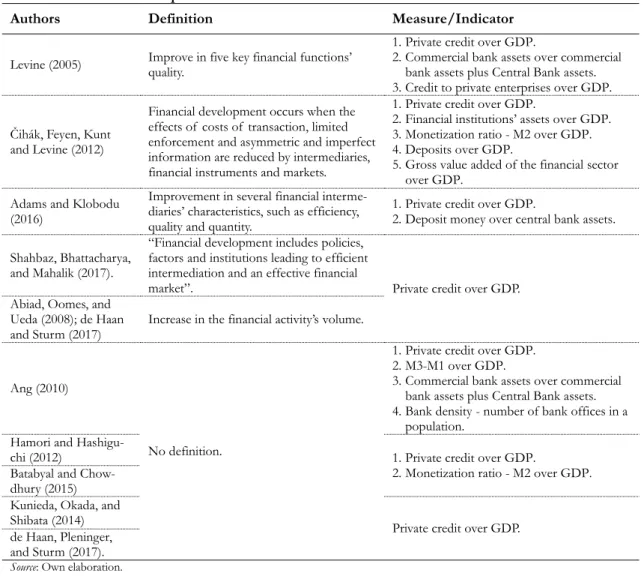
Again, as in the case of financial liberalization, some studies do not present a definition for financial development. Instead, they simply provide proxies or indicators for this variable, namely (see Table 2) the ratio of private credit over GDP (Ang, 2010; Hamori and Hashiguchi, 2012; Kunieda, Okada, and Shibata, 2014; Batabyal and Chowdhury, 2015; de Haan, Pleninger, and Sturm, 2017), which is also used by studies that conceptually define financial development. The ratio of private credit over GDP analyses the credit that goes from savers to private firms through financial intermediaries, which means that credit to the central bank, development banks, credit to state owned enterprises and the public sec-tor are not included in this measure.
Table 2: Financial Development definitions and indicators
Authors Definition Measure/Indicator
Levine (2005) Improve in five key financial functions’ quality.
1. Private credit over GDP.
2. Commercial bank assets over commercial bank assets plus Central Bank assets. 3. Credit to private enterprises over GDP. Čihák, Feyen, Kunt
and Levine (2012)
Financial development occurs when the effects of costs of transaction, limited enforcement and asymmetric and imperfect information are reduced by intermediaries, financial instruments and markets.
1. Private credit over GDP.
2. Financial institutions’ assets over GDP. 3. Monetization ratio - M2 over GDP. 4. Deposits over GDP.
5. Gross value added of the financial sector over GDP.
Adams and Klobodu (2016)
Improvement in several financial interme-diaries’ characteristics, such as efficiency, quality and quantity.
1. Private credit over GDP.
2. Deposit money over central bank assets. Shahbaz, Bhattacharya,
and Mahalik (2017).
“Financial development includes policies, factors and institutions leading to efficient intermediation and an effective financial
market”. Private credit over GDP.
Abiad, Oomes, and Ueda (2008); de Haan and Sturm (2017)
Increase in the financial activity’s volume.
Ang (2010)
No definition.
1. Private credit over GDP. 2. M3-M1 over GDP.
3. Commercial bank assets over commercial bank assets plus Central Bank assets. 4. Bank density - number of bank offices in a
population. Hamori and
Hashigu-chi (2012) 1. Private credit over GDP.
2. Monetization ratio - M2 over GDP. Batabyal and
Chow-dhury (2015) Kunieda, Okada, and
Shibata (2014) Private credit over GDP.
de Haan, Pleninger, and Sturm (2017).
Source: Own elaboration.
Although the monetization ratio (M2 over GDP) emerges as a commonly used indicator (Hamori and Hashiguchi, 2012; Čihák, Feyen, Kunt and Levine, 2012; Batabyal and Chow-dhury, 2015), private credit over GDP has the advantage of capturing the society’s savings that are received by private firms (de Haan and Sturm, 2017).
2.1.3. Income inequality
According to United Nations Development Programme (UNDP, 2013), development theo-ry has been studying inequality mainly in the material dimension, that is in income, wealth, wage, health, nutrition, and education.
Inequality is an embracing concept, usually prone to confusion, as it might be studied from different perspectives. Indeed, as stated in UN (2015), ‘economic inequality’ is often used as synonyms of ‘monetary inequality’, ‘income inequality’, ‘wealth inequality’ or, in a more comprehensive perspective, ‘living conditions inequality’.
The debate around economic inequality, as a broader definition of an economic disad-vantage, has been analysed between two main strands (UN, 2015). On the one hand, the inequality of outcomes consists in inequalities in several dimensions of human well-being that individuals might control through their effort and talent (for instance, educational at-tainment or level of income). On the other hand, the inequality of opportunities entails that some society segments face less social, economic and political opportunities due to circumstances people cannot control and are beyond personal choices as result of their life background (for example, gender, race, place of birth), such as access to education or ac-cess to employment (UN, 2015).
As reported by UNDP (2013), income inequality is a particular dimension of inequality of outcomes that influences several dimensions of human well-being, as there is a strong rela-tion between income inequality and health, educarela-tion or nutrirela-tion inequalities. Measuring a country’s overall income inequality is a fundamental way to analyse its welfare levels and its ability to face poverty reduction.5
Income inequality has been a very discussed topic in the recent decades (World Inequality Lab, 2018). Most studies do not provide a concrete definition on the topic and the ones that do suggest rather short and identical explanations when comparing among studies. According to OECD (2016, p.102), “[i]ncome inequality is an indicator of how material resources are distributed across society”, being a starting point to analyse equity among citizens (OECD, 2011). In another perspective, Todaro and Smith (2015) define income inequality as the total national income disproportionately distributed by all citizens or, more specifically, according to Ngamaba, Panagioti, and Armitage (2018), it is the unbalanced
5 In http://www.worldbank.org/en/topic/poverty/lac-equity-lab1/income-inequality, accessed on the 20th
distribution of household disposable income. In other words, it is how uneven income is divided across a population in an economy.6
The household disposable income represents the sum of earnings, self-employment, capital income and public transfers, deducted by income taxes and social security contributions (OECD, 2018b). According to Haughton and Khandker (2009), it is mainly influenced by three effects. First, the endowment effects, i.e., by the household and people’s characteris-tics (job, gender, education, geographic factors or capital accumulation). Second, the price effect, whether there are modifications in the return of the assets or their characteristics (for instance, wage and profit rate). Finally, the occupational choice effects, that is, the way people fund their assets (for example, if by work, what type of job). To correctly analyse income inequality, one should not separate income inequality earned from labour or from capital (money obtained from rents, dividends and interests) (UNDP, 2013).
As income inequalities are partly due to a rise in capital incomes (World Inequality Lab, 2018), there is a flourishing interest in analysing wealth inequality. Wealth inequality is the situation of personal assets disproportionally distributed among a society (Hurst, 2007). Personal assets consist of goods that value household wealth, such as houses, corporations’ earnings, savings, investments and other personal valuables (Hurst, 2007).
Besides the analysis among the whole society, inequality can be studied between society groups. Focusing on wage inequality, it is the uneven distribution of money received from work among people in an economy and is commonly analysed particularly based on the race (Darity, 1982; US Census Bureau, 2010) or on the gender (US Census Bureau, 2010; European Commission, 2014).
2.2. Mechanisms that link financial liberalization to income inequality
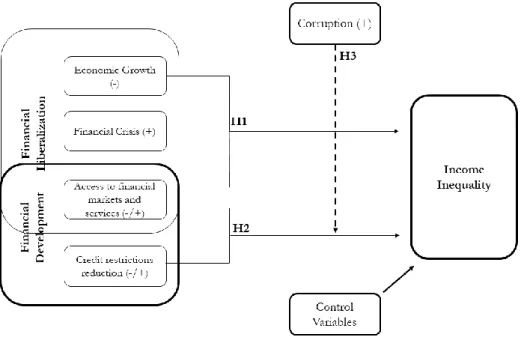
Income inequality is affected by financial liberalization through three main channels (Ares-tis and Caner, 2004; Ang, 2010): 1) Economic growth; 2) Access to credit and financial services; and 3) Financial crisis.
First, income inequality can be influenced by financial liberalization through the increase in the economic growth rate (McKinnon, 1973; Shaw, 1973; Arestis and Caner, 2004; Ang, 2010). According to Arestis and Caner (2004), financial repression (that is, distortions in
interest rates) makes the financial system relatively smaller in comparison with the non-financial system because there is a lower propensity to save and to hold bank deposits, de-creasing the banking system real size and consequently shorting the credit supply, generat-ing a slower real rate of economic growth. In the circumstance of financial repression, the nominal interest rate is fixed administratively, maintaining real rate below the level of equi-librium, encouraging consumption and discouraging saving. The average efficiency of in-vestments is reduced by ceilings on loan rates because lower return inin-vestments are profit-able now and they would not be with a higher equilibrium interest rate. Therefore, if inter-est rates ceiling are removed, in other words, if there is a process of financial liberalization, saving would increase, improving also the average return to investment as profits with low yields are not lucrative and worthwhile anymore. Thus, output will increase with the im-provement in investment efficiency.
Besides the removal of interest rates ceilings, two strands of financial liberalization, stock market and capital account liberalization (i.e. capital controls reduction) (Bumann and Lensink, 2016), can also contribute to an increase in economic growth rate because they can result in higher capital flows and investment in poor countries, reduced cost of raising capital, transfers of know-how and technology (which may help to improve productivity), a more developed supervisory and regulatory banking framework (increasing financial ser-vices’ quality) (Arestis and Caner, 2004).
In a nutshell, financial liberalization, through an increase in the economic growth rate, can reduce income inequalities through two ways. The first entails that economic growth affects regions, sectors and their production factors which may create better job opportunities for the poorer. The other denotes that redistributing gains can result from economic growth as it might increase financial resources to invest in critical areas for the poorer, improving public spending and transfers (Arestis and Caner, 2004).
Focusing on less developed countries and following the line of thought of Arestis and Caner’s (2004) economic growth channel, Batuo and Asongu (2015) postulate that one rea-son for these countries’ slow economic growth is the administratively setting of low real interest rate which result in low levels of saving. Thereby, financial liberalization, liberaliz-ing and deregulatliberaliz-ing interest rates would motivate savliberaliz-ings and improve the credit supply available in the economy, namely to the poorer, enabling higher and quicker economic growth rates and narrowing income disparities.
Second, a better and broader access to financial services and credit might narrow income disparities as more people have access to finance and can obtain credit with fewer borrow-ing costs to invest in business and/or education (Arestis and Caner, 2004; Ang, 2010). Ad-dressing this issue, Bumann and Lensink (2016) developed a theoretical model with a bank-ing sector and agents with different investment abilities. The most skilled investment agents become investors and the less skilled become savers. The former are able to earn a large amount of money, while the latter earn a smaller amount. Reserve requirements and for-eign funds (used to finance domestic loans) are set, supervised and managed by the finan-cial regulator. According Bumann and Lensink (2016), finanfinan-cial liberalization increases the efficiency of banks and decreases borrowing costs. Deposit rates will rise to re-establish the financial market equilibrium, reducing the wedge between deposits and loans interest rates.Such outcome has a positive impact on investors and savers, reducing income dispari-ties.
However, Greenwood and Jovanovic (1990); Delis, Hasan, and Kazakis (2014) reject the idea that financial liberalization decreases income inequality. The authors suggest that banks with profit maximizing behaviour restrict lending to low income households and firms and would rather lend to wealthier ones because the former have low levels of collat-eral. Lending to poorer households is uncertain and may conflict with bank’s goal of earn-ing high yields with risky assets. Similarly, Batuo and Asongu (2015) advocate that banks avoid lending to poorer society groups due to credit market imperfections. Thus, low in-come individuals will not benefit from the reduction of financing costs induced by finan-cial liberalization and have less probability of starting their own business and create wealth. Hence, wealth will be concentrated in the upper groups of society, increasing income di-vergences.
Finally, it is contended that financial liberalization might be associated to financial crisis, which will generate macroeconomic volatility, harming most particularly the poor, and thus widening income inequalities (Arestis and Caner, 2004; Ang, 2010). In the same line of thought, de Haan, Pleninger, and Sturm (2017), based on Bumman and Lensink’s (2016) theoretical model, suggest that financial liberalization might lead to market volatility and, consequently, uncertainty. Thus, as a precaution measure, low income individuals will in-crease their savings which will cause a decline in interest rates, amplifying income dispari-ties.
Based on the above, we conjecture that
H1: Financial liberalization contributes to an increase in income inequality. 2.3. Mechanisms that link financial development to income inequality
Shahbaz, Bhattacharya, and Mahalik (2017) put forward three hypotheses for explaining the mechanisms whereby financial development impacts income inequality: 1) finance-income inequality widening hypothesis; 2) finance-income inequality narrowing hypothesis; and 3) finance-income inequality inverted U-shaped hypothesis.
The former two hypotheses are based on mechanisms of credit restrictions and the conse-quent (in)ability to invest in education or business, whereas the latter hypothesis encom-passes the access to financial markets mechanism.
Financial development predisposes how family’s wealth, individual’s skills and initiative, political connections or social status affect individual’s economic opportunities during his/ her life. According to Čihák, Feyen, Kunt and Levine (2012), financial development influ-ences whether the individual is able to pay for education, start a business, achieve economic aspirations or not. As a result, it can also influence the demand for labour (by influencing capital allocation) and thus impacting income disparities.
The finance-income inequality widening hypothesis postulates that when institutional quali-ty is weak, only the richer benefit from financial development due to their financial credibil-ity, history and collateral, which will lead to an increase in income inequalities (Banerjee and Newman, 1993; Galor and Zeira, 1993; Jauch and Watzka, 2015; Shahbaz, Bhattacharya, and Mahalik, 2017).
The finance-income inequality narrowing hypothesis claim that financial development may allow the poorer to access credit to invest in education and business, enabling, in the long run, to reduce income inequalities (Banerjee and Newman, 1993; Galor and Zeira, 1993; Jauch and Watzka, 2015; Shahbaz, Bhattacharya, and Mahalik, 2017).
Focusing on the finance-income inequality widening/narrowing hypotheses, recently, de Haan and Sturm (2017) hypothesized that the poorer, which lack collateral and credit histo-ries, may, on the one hand, be benefited by the relaxation of credit constraints; but, on the other hand, an increase in the quality and quantity of the financial services tend to benefit mainly the richer, the ones already owning financial services. Similarly, Hamori and Hashiguchi (2012) postulated that financial development will allow broader access to credit
and reduce financial frictions (Adams and Klobodu, 2016). Hence, poorer households and entrepreneurs would face less credit constraints and would have more access to finance and credit. Thereby there will be a better allocation of capital and hence income divergences will narrow. Nevertheless, the authors highlight that the richer will be more benefited than the poorer because the latter may lack collateral and credit history (Adams and Klobodu, 2016).
In another perspective, Demirgüç-Kunt and Levine (2009) and Delis, Hasan, and Kazakis (2014) highlight that income disparities might be decreased due to financial intermediaries, markets and contracts improvement because investment decisions affect the households’ future income. In the first study (Demirgüç-Kunt and Levine, 2009), the authors argue that financial intermediaries influence how, in the long run, the income is the outcome of inher-ited goods or individual decisions that resulted in fruitful investments. Thus, if financial intermediaries make possible to fund valuable investment ideas through developed financial instruments, then the individual’s future income ought not to be commanded by his/her economic endowment and income inequalities may narrow. In the other extreme, underde-veloped financial systems and the associated financial imperfections (e.g. asymmetric in-formation, moral hazard) might be especially harmful for the poorer fraction of society, who face limited access to finance and lack collateral. Similarly, according to Levine (2005), facing these restrictions, poorer individuals cannot invest in their own businesses, which will wide even more income disparities. Financial development, by smoothing these credit constraints, might motivate entrepreneurship, turning financial services available to a bigger population proportion and allowing more individuals to take investment opportunities and create an income source. Therefore, a strong credit market will allow to overcome financial market imperfections and thus mitigating income divergences (Ang, 2010; Shahbaz, Bhattacharya, and Mahalik, 2017).
At last, the finance-income inequality inverted U-shaped hypothesis advocates that in the early stages of economic development only the rich can afford and have access to devel-oped financial markets, increasing income disparities. As the level of economic develop-ment becomes higher, a larger proportion of the population benefit from financial devel-opment and income inequalities may decrease (Greenwood and Jovanovic, 1990; Jauch and Watzka, 2015; Shahbaz, Bhattacharya, and Mahalik, 2017).
rela-tion between income disparities and financial development. According to the authors, in-come divergences first increase with financial development, then they observe a period of stabilization and ultimately reduce, as more individuals are able to access financial markets and financial assets are no longer available only to the wealthier (Hamori and Hashiguchi, 2012). Additionally, Levine (2005) suggests that progress in the financial system might first-ly benefit the richer and the politicalfirst-ly better connected and, due to financial illiteracy, in the first stages of financial development, the poorer and low educated may have difficulties in obtaining credit, amplifying income inequalities (Shahbaz, Bhattacharya, and Mahalik, 2017).
Based on the above, we conjecture that
H2: Financial development contributes to an increase in income inequality.
2.4. Financial liberalization/ development and income inequality: the mediating factor of corruption
The impact of financial liberalization and financial development on income distribution is likely to be mediated by the quality of the institutions in general (Delis, Hasan, and Ka-zakis, 2014; de Haan and Sturm, 2017) and, more specifically, by corruption (Bjørnskov, 2011; Batabyal and Chowdhury, 2015; Adams and Klobodu, 2016).
As a broader definition, North (1990), describes institutions as a set of formal and infor-mal rules, in which political, social and economic relations are based. According to the OECD (2014, p.2), institutions “define how power is managed and used, how states and societies arrive at decisions, and how they implement those decisions and measure and ac-count for the results.”. Institutions depend therefore on how decentralised and democratic the decisions processes are (OECD, 2014).
The quality of the institutions may threaten countries’ economic growth. Therefore, insti-tutions have a strong impact on financial liberalization and development (de Haan and Sturm, 2017). Institutions include laws, rules, informal rules regarding social interactions and government organisms and entities and they can be distinguished by two kinds: 1) formal, which embraces, for instance, laws, constitutions, property rights, contracts; and 2) informal, other rules that influence citizens behaviour (for example, traditions, customs, sanctions, conduct codes) (North, 1991; OECD, 2014).
Corruption is the usage of public power in an abusive way (Leff, 1964; Rose-Ackerman, 1975; Treisman, 2000; Bjørnskov, 2011; Batabyal and Chowdhury, 2015). There is no con-sensus regarding whether corruption is a concept that should be used only regarding public domain or if it plausible to use it concerning also the private one (Madsen, 2013). In this study, the concept of corruption will be used in its traditional and more often used stance, as the abuse of public power for private gain (Treisman, 2000).
Since the 1990s decade, corruption has been the aim of a plethora of studies as it might pervert government spending, undermining investment in education (Mauro, 1998; Bjørnskov, 2011), slowing economic growth (Mauro, 1995; Bjørnskov, 2011), harming hu-man welfare (Kaufhu-mann, Kraay, and Mastruzzi 2005; Bjørnskov, 2011), and resulting in losses of productivity (Méon and Weill, 2004; Bjørnskov, 2011) and income (Kaufmann, Kraay, and Mastruzzi 2005; Bjørnskov, 2011).
Corruption distorts public services use and consequently reduces citizens’ satisfaction (Park and Blenkinsopp, 2011). Specifically, poorer groups are the most disadvantaged as they depend mainly on public services (Peiffer and Rose, 2018). Corruption tends to harm the more vulnerable hampering their access to services, health, education or justice (Knox, 2009; Peiffer and Rose, 2018). In a broader perspective, corruption undermines trust on governments’ actions, interfering with FDI and jeopardizing economic growth, job crea-tion, human capital and opportunities.7
Defining the activities considered as corruption is usually prone to confusion. As a matter of fact, theft and fraud are commonly associated with corruption. However, according to Senior (2006), corruption entails three parties: the corruptor, the corruptee and the others who benefit or not from the consequences of the corruption act, while theft and fraud only involves two, the stealer and who is stolen. As stated by Jain (2001), other activities such as drug trades, black market, money laundering cannot be considered corruption as long as they do not include public power.
Indeed, according to Jain (2001), there are three typical dimensions of corruption in demo-cratic societies: 1) Grand corruption, which refers to the exploitation of political power in their own benefit at the expense of the citizens. In this case, resources are allocated where political elite gains are higher rather than where they are the most needed for the
7 In http://www.worldbank.org/en/topic/governance/brief/anti-corruption accessed on the 6th October
tion in general; 2) Bureaucratic corruption entails acts of the bureaucrats across their rela-tions with superiors or the public. In most often cases, bureaucrats are bribed by the public to accelerate a bureaucratic process or to receive a service not available for the community in general; 3) Legislative corruption, encompassing how legislators can be persuaded to approve legislation that favours specific interest groups.
In conclusion, when institutions are weak and/or when corruption plays a preponderant role in a country’s society, only the powerful segments of society have privileged access to finance and so financial development might wide income disparities (Chong and Gradstein, 2007; Adams and Klobodu, 2016; de Haan and Sturm, 2017; Shahbaz, Bhattacharya, and Mahalik, 2017). In contrast, in the presence of a strong institutional environment, it is probable that financial development reduces income inequality as it is easier for the poorer to invest on physical and human capital due to a broader access to finance (de Haan and Sturm, 2017; Shahbaz, Bhattacharya, and Mahalik, 2017).
Keeping in mind the direct impact of financial liberalization/development on income ine-quality, we put forward an additional hypothesis:
H3: In contexts characterized by high levels of corruption (low institutional quality), the impact of financial liberalization/development on increased income inequality tends to be amplified.
Figure 1: Mechanisms that link financial liberalization/development to income inequality and the mediating effect of corruption
Note: “+” and “-” mean an increase or decrease, respectively, on income inequalities.
2.5. Empirical evidence 2.5.1. Financial liberalization
Empirical studies concerning the effect of financial liberalization on income inequality (e.g. Ang, 2010; Agnello, Mallick and Sousa, 2012; Bumman and Lensink, 2016) leave an open debate (see Table 3).
Focusing on researches based on panel data models, Batuo and Asongu (2015), for a sam-ple of 28 African countries between 1996-2010, Naceur and Zhang (143 countries since 1961 until 2011), de Haan and Sturm (2017) and de Haan, Pleninger and Sturm (2017), analysing 121 and 141 countries, respectively, both during the period of 1975-2005, con-cluded, with significance at 1% level, that financial liberalization increases income dispari-ties. Within the line of thought of the authors, the reduction of financing costs induced by financial liberalization does not broad the financial markets access to the poorest and mar-ket imperfections are not reduced as expected. Therefore, they will not have incentives to invest in education and business, contributing to income divergences.
Also resorting to panel data models, Bumman and Lensink (2016) achieved identical re-sults, that is, financial liberalization increases income inequalities, at 5% statistical signifi-cance. However, according to these authors, financial liberalization might have a reducing effect for high levels of financial depth (private credit over GDP), that is, when financial depth is higher than 25%. Notwithstanding, as in most developing countries financial depth is low, and this threshold is not achieved, financial liberalization is more likely to rise income divergences.
In contrast, albeit using the same methodology, Agnello, Mallick and Sousa (2012), studying a sample of 18 Asian countries between 1996 and 2005 and Delis, Hasan, and Kazakis (2014) for 91 countries, during the same period, concluded that financial liberalization shortens income disparities, at 5% significance level. Furthermore, Li and Yu (2014) for 62 countries during the 1973-2005 period reached the same conclusion but at 10% signifi-cance level. According to the authors, this is due to a better and easier access to credit by the poorer.
anal-yses the effect of financial liberalization in India’s income inequalities, between 1951 and 2004, employing a time series data model. The results suggest that income inequalities worsened with the financial liberalization process during this period (with significance at 1% level). This conclusion, according to the author, owes to the fact that as India is a huge developing country with a large proportion of poor people, structural adjustments that depend on the allocation of financial resources are more likely to hurt the poorest.
2.5.2. Financial development
The empirical evidence regarding the impact of financial development on income inequali-ty involves also an intense debate (see Table 3).
Focusing on panel data methods, Jauch and Watzka (2015), analysing 138 countries since 1960 until 2008, Adams and Klobodu (2016), for a panel of 21 sub-Saharan African coun-tries between 1985-2011, and de Haan and Sturm (2017) (121 councoun-tries during 1975-2005), concluded that financial development exacerbates income divergences, at 1% significance level. The authors suggest that this is because more developed markets tend to benefit the rich rather than the poor due to the latter’s financial illiteracy.
In contrast, but using the same econometric methodology, Hamori and Hashiguchi (2012), studying 126 countries during the period 1963-2002, Batabyal and Chowdhury (2015), ana-lysing 30 Commonwealth countries between 1995-2008, and Naceur and Zhang (2016) (143 countries during 1961-2011) found that income inequalities are mitigated with the process of financial development, at 1% significance level. In the authors’ view, these re-sults are due to the expansion of the financial markets access, improving the access to the poorest.
Some empirical studies also use time series methods. For instance, Shahbaz, Bhattacharya, and Mahalik (2017), investigating the impact of financial development on Kazakhstan’s income inequality, between 1990 and 2014, demonstrated (at 10% significance level) that financial development wides income disparities due to financial market inefficiency. In op-position, Ang (2010), analysing India during the period of 1951-2004, concluded that fi-nancial development narrows income inequalities as it reduces fifi-nancial frictions and eases the access to financial markets (at 1% significance level).
Table 3: The impact of financial liberalization/development on income inequality: empirical evidence
Study Observations Period Methodology Income inequality Dependent var.:
Core independent vars. Other vars. Impact of FL/FD on II
Financial liberalization Financial development Corruption Other liberaliza-Financial tion
Financial
develop-ment
Ang (2010) India 1951-2004 Annual time series data (ECM cointegration test;
ARDL bounds test) Gross income Gini
Demetriades and Luintel (1996, 1997) Financial liberalization measure.
Private credit over GDP; M3-M1 over GDP; Commercial banks assets over commercial banks assets plus Central Banks assets; Bank density
Rate of growth of real GDP per capita; Inflation
rate; Trade openness +++ ---
Shahbaz, Bhattacharya, and Mahalik (2017)
Kazakhstan 1990-2014 Annual time series data (ARDL bounds test) Gross income Gini Private credit over GDP. Economic growth; FDI; Education, Democracy +
Li and Yu
(2014) 18 Asian coun-tries 1996-2005 Panel data (GMM) Fixed effects Gross income Gini
Abiad, Detragiache, and Tressel (2009) financial liberalization index.
Human Capital Institu-tional quality; Inflation; GDP growth rate per capita; Other variables
- Adams and Klobodu (2016) 21 sub-Saharan African coun-tries 1985-2011 Panel data (PMG, MG, DFE); Fixed effects
Panel Unit root test Net income Gini
Private credit over GDP; Deposit money over central bank assets. Control of corruption index from Internation-al Country Risk Guide (ICRG)
GDP per capita; Williams’
(2011) transparency index +++ Batuo and Asongu, (2015) 28 African Countries 1996-2010
Before and after compari-son; Panel data (GMM)
Dynamic panel model Gross income Gini
De jure Chinn and Ito (2008) capital account openness index (KAOPEN) and de facto capital account open-ness (foreign direct invest-ment: FDI as percentage of GDP)
Trade liberalization; Institutional and political liberalization; Other liberalizations; Govern-ment expenditure; Infla-tion; Economic prosperity
+++
Batabyal and Chowdhury (2015)
30
common-wealth countries 1995-2008 Panel data (IV), OLS Gross income Gini Private credit over GDP; M2 over GDP.
Corruption Perceptions Index (CPI)
GDP growth; Primary completion rate; Listed companies market capital-ization; Real interest rate; Openness --- Agnello, Mallick and Sousa (2014) 62 countries 1973-2005 Panel data
Fixed effects Net income Gini
Abiad, Detragiache, and Tressel (2009) financial liberalization index.
Credit controls; Entry barriers; Banking
supervi-sion; Other variables -- Delis, Hasan
and Kazakis
(2014) 91 countries 1973-2005
Panel data (GMM), OLS, 2SLS
Dynamic panel model Fixed effects Random effects
Gross income Gini Wage inequality measured by Theil Index
Abiad, Detragiache, and Tressel (2009) financial liberalization index.
Lagged income inequality; Macroeconomic, institu-tional, demographic and financial variables
(…)
Study Observations Period Methodology Income inequality Dependent var.:
Core independent vars. Other vars. Impact of FL/FD on II
Financial liberalization development Financial Corruption Other liberaliza-Financial tion Financial develop-ment Bumann and Lensink (2016) 106 countries 1973-2008 Panel data (GMM)
Fixed effects Gross income Gini
Chinn and Ito (2008) capital account openness index (KAOPEN) and FDI as percentage of GDP.
Private credit over GDP.
Lagged income inequality; Inflation; Trade openness; Secondary school enrolment; Age structure; Population growth; Real GDP per capita growth ++ Bumann and Lensink (2016) 106 countries 1973-2008 Panel data (GMM)
Fixed effects Gross income Gini
Chinn and Ito (2008) capital account openness index (KAOPEN) and FDI as percentage of GDP.
Private credit over GDP.
Lagged income inequality; Inflation; Trade openness; Secondary school enrolment; Age structure; Population growth; Real GDP per capita growth -- If finan-cial depth over than 25%. de Haan and Sturm (2017) 121 countries 1975-2005 Panel data (GLS, G2SLS) Fixed effects Random effects Dynamic panel model Cross-country regression (OLS)
Gross income Gini Abiad, Detragiache, and Tressel (2009) financial liberalization index.
Private credit over GDP.
Banking crises; Inflation; GDP growth; Agriculture
added value; Other variables +++ +++ Hamori and
Hashiguchi
(2012) 126 countries 1963-2002
Panel data (GMM) Dynamic panel model Fixed Effects Estimated household income inequality Private credit over GDP; M2 over GDP.
Trade openness; GDP per
capita; Inflation rate ---
Jauch and
Watzka (2015) 138 countries 1960-2008
Panel data (GMM) Dynamic panel model Fixed Effects Pooled OLS
Gross income Gini
Net income Gini Private credit over GDP.
GDP per capita; Inflation; Government consumption; Agricultural sector value added; Access to finance; Ethnolinguistic fractionaliza-tion +++ de Haan, Pleninger, and Sturm (2017) 141 countries 1975-2005 Panel data (GLS)
Fixed effects Gross income Gini
Abiad, Detragiache, and Tressel (2009) financial liberalization index and Chinn and Ito (2008) capital account openness index.
Private credit over GDP.
Inflation; GDP growth; Agriculture added value;
Other variables +++
Naceur and
Zhang (2016) 143 countries 1961-2011 IV Gross income Gini
Abiad, Detragiache, and Tressel (2009) financial liberalization index and BIS consolidated foreign claims to GDP. Private credit over GDP; Stock market total value traded to GDP
GDP per capita; Inflation; Trade openness; Government
size +++ ---
3. Methodology
3.1. Main hypotheses and the choice of the methodology
Three methodological approaches are typically employed in literature (Babbie, 2011; Cre-swell, 2014): quantitative, qualitative and mixed. According to Creswell (2014), quantitative methods are employed in order to test objective theories analysing causality such as impact measurement between variables, which are converted into proxies and analysed by statisti-cal procedures (Babbie, 2011).
Extant literature in this field of study usually resorts to quantitative methods, namely panel data models (e.g, Hamori and Hashiguchi, 2012; Li and Yu, 2014; Batuo and Asongu, 2015; Jauch and Watzka 2015; Bumman and Lensink, 2016; Adams and Klobodu, 2016) or time series data analyses (Ang, 2010; Shahbaz, Bhattacharya, and Mahalik, 2017).
Following the approach of most existing studies (Agnello, Mallick and Sousa, 2014; Delis, Hasan and Kazakis, 2014; Bumman and Lensink, 2016; Adams and Klobodu, 2016; de Haan, Pleninger, and Sturm, 2017), and given the aim of the present study (to assess the impact of financial liberalization/development on income inequality, mediated by coun-tries’ corruption level), we employ a quantitative approach, in specific a panel data model estimation technique (analysing a sample of countries over a period of time).
According to Batuo and Asongu (2015) and de Haan and Sturm (2017), in comparison with cross section regressions, panel data techniques have the advantage of analysing data time series and cross section variations. Furthermore, they enable to control countries’ un-observed specific effects and are not biased by endogeneity as regressors’ lagged values are employed as instrumental variables (Beck, Demirgüç-Kunt, and Levine, 2007; Kunieda, Okada, and Shibata, 2014; Jauch and Watzka, 2015).
In specific, the present study’s panel data model will control for country’s fixed effects, purging time-invariant variables and decreasing the bias of omitted variables (Delis, Hasan and Kazakis, 2014; Jauch and Watzka, 2015).
3.2. Econometric specification
To test the proposed hypotheses, we formulate the following econometric model: 𝐼𝐼𝑖𝑡𝐶𝑜𝑟𝑟𝑗 = 𝛽0𝐶𝑜𝑟𝑟𝑗+ 𝛽1𝐶𝑜𝑟𝑟𝑗𝐹𝐿𝑖𝑡+ 𝛽2 𝐶𝑜𝑟𝑟𝑗 𝐹𝐷𝑖𝑡+ 𝛽3 𝐶𝑜𝑟𝑟𝑗 𝐶𝑂𝑅𝑅𝑖𝑡+ 𝛽5 𝐶𝑜𝑟𝑟𝑗 𝛸𝑖𝑡+ 𝜇𝑖𝑡 𝐶𝑜𝑟𝑟𝑗 , Where:
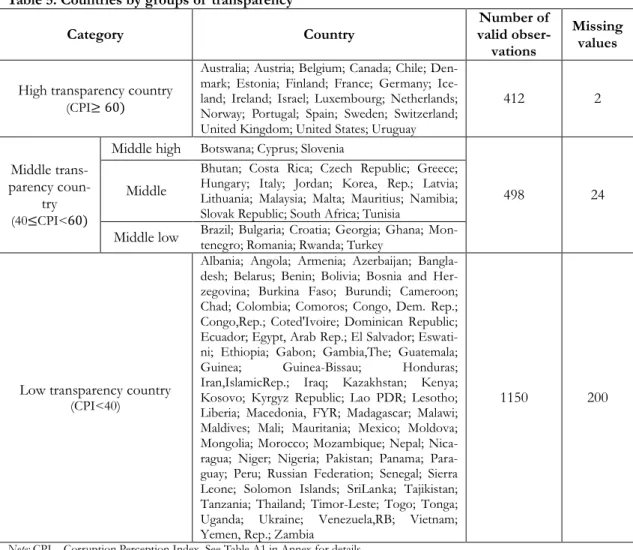
j stands for the corruption group index (j=0: All countries; j=1: High corruption/low transparency countries (𝐶𝑃𝐼 < 40); j=2: Middle corruption/transparency countries (40 ≤ 𝐶𝑃𝐼 < 60); j=3: Low corruption/ High transparency countries (𝐶𝑃𝐼 ≥ 60);
i stands for the country index (i=1, …127); t stands for the time index (t=2000, … 2017); 𝐼𝐼𝑖𝑡 stands for income inequality;
𝐹𝐿𝑖𝑡 and 𝐹𝐷𝑖𝑡 represent financial liberalization and financial development variables;
𝛸𝑖𝑡 is a vector of control variables (which includes real GDP per capita growth rate, rate of inflation and trade openness);
µ𝑖𝑡 denotes the random error term.
The estimation of the models according to countries’ corruption groups enables to interact the variables of financial liberalization and financial development with the corruption vari-able. The estimation of the models including interaction variables (𝐹𝐿 × 𝐶𝑂𝑅𝑅𝑖𝑡 and 𝐹𝐷 × 𝐶𝑂𝑅𝑅𝑖𝑡) was not feasible due to severe multicollinearity issues.
3.3. Data sources and variables’ main proxies
Income inequality is measured by gross income Gini (as employed by, for example, Li and Yu, 2014; Delis, Hasan and Kazakis, 2014; Batuo and Asongu, 2015; Bumann and Lensink, 2016; Naceur and Zhang, 2016; de Haan and Sturm, 2017), i.e., before redistribution poli-cies, not being influenced, as net income Gini is, by government’s taxes and transfers (de Haan and Sturm, 2017). According to Jauch and Watzka, 2015, (pp. 296-297), redistribution policies may “blur the theoretical relationship between financial development and income inequality, which is modelled without an explicit role for redistribution”.
Regarding independent variables, financial liberalization is proxied by a de facto capital ac-count openness measure (FDI as percentage of GDP), as done by Jaumotte, Lall and Pa-pageorgiou (2013), Batuo and Asongu (2015) and Bumman and Lensink (2016). According to Batuo and Asongu (2015), it is a measure that reflects the cross-border capital variations, it is not influenced by how the private sector avoids capital account restrictions and be-cause other measures (such as Chinn and Ito, 2008 capital account openness index) reflect some countries’ de jure closeness but not their de facto capital openness (Patnaik and Shah, 2010), that is, capital controls reduction in accordance with Bumann and Lensink (2016), which is a strand of financial liberalization. The higher the ratio of FDI on GDP, the high-er the level of financial libhigh-eralization.
In order to measure financial development, we use the most common indicator in litera-ture: private credit over GDP (see, for instance, Hamori and Hashiguchi, 2012; Jauch and Watzka, 2015; Batabyal and Chowdhury, 2015; Naceur and Zhang, 2016; Bumann and Lensink, 2016; Adams and Klobodu, 2016, de Haan and Sturm, 2017) because it is a proxy that reflects the extent to which the private sector can get credit (Batabyal and Chowdhury, 2015), it captures the society’s savings that are received by private firms (de Haan and Sturm, 2017) and because income inequality is impacted by finance through the banking sector and not by capital market capitalization as proxied by the monetization ratio measure (M2 over GDP) used in another studies (Naceur and Zhang, 2016; de Haan and Sturm, 2017). Therefore, if individuals have an easier access to credit markets, then there is a high-er level of financial development (Jauch and Watzka, 2015).
The corruption variable is constructed based on the Corruption Perception Index (CPI), which is an aggregate indicator that sorts countries according to the corruption level among politicians, public officials and civil employees (Batabyal and Chowdhury, 2015). The CPI ranking is from 0 to 100, the lower the value, the more corrupt the country is. Our control variables include the three most used control variables in the literature: 1) real GDP per capita growth rate. Literature is not consensual about using real GDP per capita growth rate (Li and Yu, 2014; Batabyal and Chowdhury, 2015; Bumman and Lensink, 2016, de Haan, Pleninger and Sturm, 2017) or real GDP per capita (Jauch and Watzka, 2015; Naceur and Zhang, 2016). Guided by most of this related literature, we chose to use real GDP per capita growth as control variable. It is expected that income inequalities reduce with increases in this variable (Ang, 2010; Li and Yu, 2014; Adams and Klobodu, 2016, de
Haan and Sturm, 2017); 2) rate of inflation - it is expected that an increase in the inflation rate will increase income disparities (Hamori and Hashiguchi, 2012; Li and Yu, 2014; Bumman and Lensink, 2016; Naceur and Zhang, 2016); 3) Trade openness (Ang, 2010; Hamori and Hashiguchi, 2012; Bumann and Lensink, 2016; Naceur and Zhang, 2016) - it is expected that higher trade openness induce a lower value of income inequalities as more work opportunities are created for the citizens (Hamori and Hashiguchi, 2012; Naceur and Zhang, 2016). Trade openness is measured by the ratio of the sum between imports and exports and GDP.
Data concerning Gini index, financial liberalization, financial development, GDP per capita growth rate, inflation growth rate and trade openness is gathered from the World Devel-opment Indicator (WDI), a database developed by the World Bank that publishes compa-rable information among countries (Hamori and Hashiguchi, 2012), while data respecting corruption is collected from the Corruption Perception Index (CPI) published by Trans-parency International, following Batabyal and Chowdhury (2015).
4. Empirical results
4.1. Descriptive statistics
Although data collected from the World Bank and Transparency International included initially 230 countries, the existence of missing values for the relevant variables in almost the whole period in analysis undermined the use of such a large sample. Thus, for period 2000-2017, the final sample includes 127 countries.
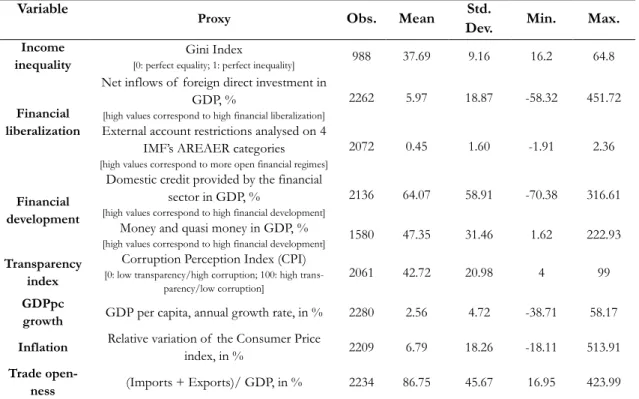
The Gini Index, which is the proxy for countries’ income inequality (the dependent varia-ble), presents a mean value of approximately 37.7 (see Table 4), with Azerbaijan being the least unequal country, in 2004, with a Gini index of 16.2 and South Africa, in 2005, being the most unequal country (Gini index = 64.8).
Table 4: Descriptive statistics Variable
Proxy Obs. Mean Std.
Dev. Min. Max.
Income
inequality [0: perfect equality; 1: perfect inequality]Gini Index 988 37.69 9.16 16.2 64.8
Financial liberalization
Net inflows of foreign direct investment in GDP, %
[high values correspond to high financial liberalization]
2262 5.97 18.87 -58.32 451.72 External account restrictions analysed on 4
IMF’s AREAER categories [high values correspond to more open financial regimes]
2072 0.45 1.60 -1.91 2.36
Financial development
Domestic credit provided by the financial sector in GDP, %
[high values correspond to high financial development]
2136 64.07 58.91 -70.38 316.61 Money and quasi money in GDP, %
[high values correspond to high financial development] 1580 47.35 31.46 1.62 222.93
Transparency index
Corruption Perception Index (CPI) [0: low transparency/high corruption; 100: high
trans-parency/low corruption]
2061 42.72 20.98 4 99
GDPpc
growth GDP per capita, annual growth rate, in % 2280 2.56 4.72 -38.71 58.17 Inflation Relative variation of the Consumer Price
index, in % 2209 6.79 18.26 -18.11 513.91
Trade
open-ness (Imports + Exports)/ GDP, in % 2234 86.75 45.67 16.95 423.99
Note: AREAER - Annual Report on Exchange Arrangements and Exchange Restrictions.
The indicator of “financial liberalization”, the net inflows of foreign direct investment in GDP (FDI/GDP), which includes long-term and short-term capitals, equity capital and reinvestment of earnings,8 has a mean value of 5.97%, observing its minimum (-58.32%) for Luxembourg in 2007 and a maximum of 451.72% for Malta in 2007.
The other financial liberalization indicator, the Chinn and Ito (2008) Index (KAOPEN), is
an index that proxies the degree of capital account openness (a financial liberalization strand, according to Bumann and Lensink, 2016), its extensity and strength by measuring four categories of restrictions on external accounts from the IMF’s Annual Report on Ex-change Arrangements and ExEx-change Restrictions (AREAER) (Chinn and Ito, 2008). These categories include: current and capital account transactions restrictions, presence of multi-ple exchanges rates and the surrender of exports proceeds requirement. This proxy pre-sents a mean value of 0.45, with a minimum value of -1.91 for a wide set of countries,9 indicating that these countries present low levels of financial liberalization, and a maximum of 2.36 for a large number of countries and years,10 reflecting high levels of financial liber-alization.
Values for the proxy of financial development private credit in total GDP indicate a mean of 64.1%, a minimum value -70.38% (Botswana, in 2001) and a maximum 316.61% (Cy-prus, in 2012). These values suggest that the amount of domestic credit provided by the financial sector (monetary authorities, deposit money banks and other financial corpora-tions – i.e. finance and leasing companies, money lenders, insurance corporacorpora-tions, pension funds and foreign exchange companies11) in a gross basis to various sectors and net to the Central Government, in Cyprus, in 2012, was around 316% of this country’s GDP, while for Botswana it achieves a negative value of around 70%12.
The other financial development indicator, the monetization ratio (money and quasi money as percentage of GDP), which includes currency, demand deposits and term deposits, pre-sents 47.35% as the mean value, with Democratic Republic of Congo (in 2001) being the country with the lowest level of financial development (1.62%) and Cyprus the most finan-cially developed country with the monetization ration reaching 222.93% in 2007.13
9 Namely, Angola, Belarus, Burundi, Ghana, Guinea, Iran, Malawi, Russian Federation, Sierra Leone,
Tajiki-stan, Ukraine, Venezuela for several years.
10 Armenia, Australia, Austria, Belgium, Bosnia and Herzegovina, Botswana, Bulgaria, Canada, Chile, Costa
Rica, Cyprus, Czech Republic, Denmark, Ecuador, Egypt, El Salvador, Estonia, Finland, France, Gambia, Georgia, Germany, Greece, Guatemala, Hungary, Ireland, Israel, Italy, Jordan, South Korea, Latvia, Liberia, Lithuania, Maldives, Malta, Mauritius, Netherlands, Nicaragua, Norway, Panama, Peru, Portugal, Romania, Slovenia, Spain, Sweden, Switzerland, Uganda, United Kingdom, USA, Uruguay, Venezuela, Yemen, and Zambia.
11 In https://data.worldbank.org/indicator/FS.AST.DOMS.GD.ZS?end=2017&start=2000, accessed on the
17th February.
12 This negative value may be due to the fact that some countries have their international reserves deposits in
private banking system and not in Central Bank. Claims on the Central Government are net – credit on the Central Government minus Central Government deposits – hence, this ratio might be negative for the do-mestic credit supplied by the banking system (in https://data.worldbank.org/indicator/
FS.AST.DOMS.GD.ZS?end=2017&start=2000, accessed on the 15th March).