ECMWF Forecasts of DNI Towards
a more Efficient Management of
Concentrated Solar Thermal
Plants
Francis M. Lopes*, Hugo G. Silva**, Afonso Cavaco, Ricardo Conceição, Rui Salgado, Paulo Canhoto, Manuel Collares-Pereira *[email protected] **[email protected]MOTIVATION
• Accurate forecasts of direct normal irradiance (DNI) are essential for an optimized operation strategy of concentrating solar thermal (CST) systems, particularly during partly cloudy days, allowing to reduce the uncertainty of solar plant outputs due to solar irradiance intermittency.
• Current state-of-the-art Numerical Weather Prediction (NWP) models still require further validation over DNI forecasts, mainly due to cloud representation during overcast periods.
• Objectives: Use of the Integrated Forecasting System (IFS), the global NWP model from the European Centre for Medium-Range Weather Forecasts (ECMWF), to assess short-term forecasts of DNI in southern Portugal and integrate these in the operationalization of CST systems.
I) Solar Assessment II) Operationalization
SOLAR ASSESSMENT
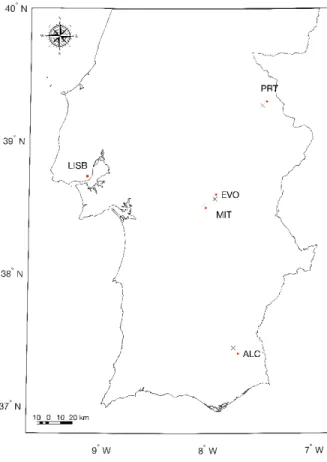
• Ground-observations at Mitra (MIT), Évora (EVO), Portalegre (PRT) and Alcoutim (ALC). • Period of analysis: 1 year (starting in April 1st 2016). • In-situ hourly averages of DNI and GHI (global horizontal irradiance) were used for analysis. • Model setup: • McRad (cycle 41R2) radiative scheme; • Forecast issue time was set at 0 UTC; • Spatial resolution of 0.1º (~ 11km in latitude); • Output is hourly accumulated values (i.e., time step values integrated in an hourly basis); Figure 1. Geographical location for measurements (black crosses) and model (red dots)
SOLAR ASSESSMENT
Figure 2. Hourly clearness indices for GHI (kt) and DNI (kb) in
four ground-measuring stations during one year (April 1st 2016 to March 31st2017). Figure 3. Daily availabilities (kWh/m2) for GHI (E t) and DNI (Eb) in four ground-measuring stations during one year (April 1st2016 to March 31st2017). 𝑘" = 𝐺𝐻𝐼'()⁄𝐺𝐻𝐼*+, 𝑘( = 𝐷𝑁𝐼'()⁄𝐷𝑁𝐼*+, 𝐾" = 𝐸"'()⁄𝐸"*+, 𝐾( = 𝐸('()2𝐸(*+,
SOLAR ASSESSMENT
EVO MIT PRT ALC
Observation Model Observation Model Observation Model Observation Model
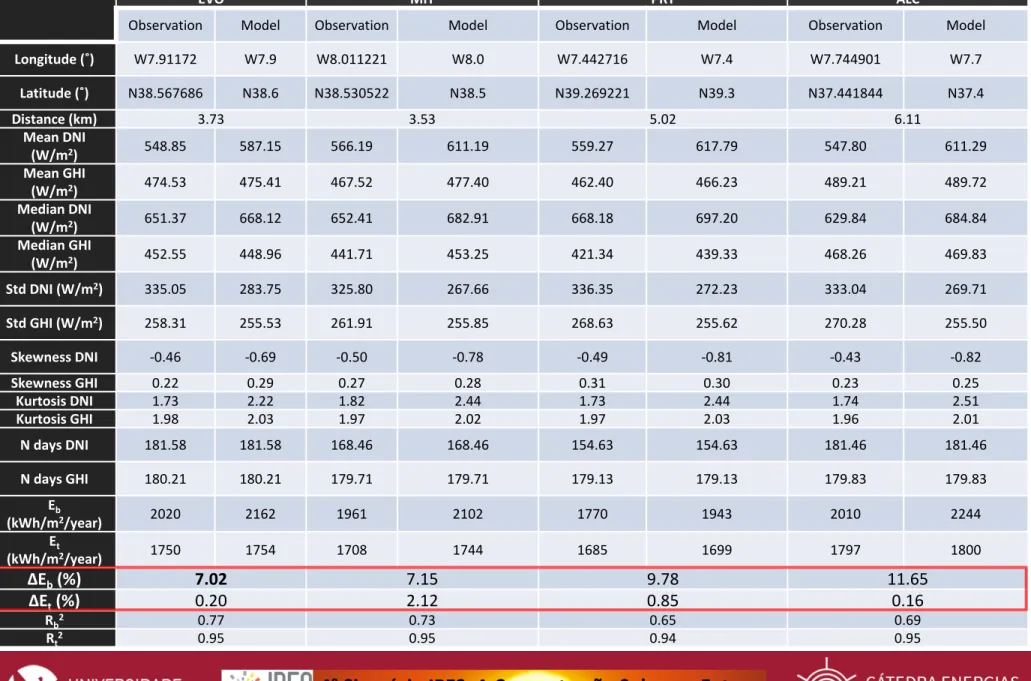
Longitude (˚) W7.91172 W7.9 W8.011221 W8.0 W7.442716 W7.4 W7.744901 W7.7 Latitude (˚) N38.567686 N38.6 N38.530522 N38.5 N39.269221 N39.3 N37.441844 N37.4 Distance (km) 3.73 3.53 5.02 6.11 Mean DNI (W/m2) 548.85 587.15 566.19 611.19 559.27 617.79 547.80 611.29 Mean GHI (W/m2) 474.53 475.41 467.52 477.40 462.40 466.23 489.21 489.72 Median DNI (W/m2) 651.37 668.12 652.41 682.91 668.18 697.20 629.84 684.84 Median GHI (W/m2) 452.55 448.96 441.71 453.25 421.34 439.33 468.26 469.83 Std DNI (W/m2) 335.05 283.75 325.80 267.66 336.35 272.23 333.04 269.71 Std GHI (W/m2) 258.31 255.53 261.91 255.85 268.63 255.62 270.28 255.50 Skewness DNI -0.46 -0.69 -0.50 -0.78 -0.49 -0.81 -0.43 -0.82 Skewness GHI 0.22 0.29 0.27 0.28 0.31 0.30 0.23 0.25 Kurtosis DNI 1.73 2.22 1.82 2.44 1.73 2.44 1.74 2.51 Kurtosis GHI 1.98 2.03 1.97 2.02 1.97 2.03 1.96 2.01 N days DNI 181.58 181.58 168.46 168.46 154.63 154.63 181.46 181.46 N days GHI 180.21 180.21 179.71 179.71 179.13 179.13 179.83 179.83 Eb (kWh/m2/year) 2020 2162 1961 2102 1770 1943 2010 2244 Et (kWh/m2/year) 1750 1754 1708 1744 1685 1699 1797 1800 ∆Eb(%) 7.02 7.15 9.78 11.65 ∆Et(%) 0.20 2.12 0.85 0.16 Rb2 0.77 0.73 0.65 0.69 Rt2 0.95 0.95 0.94 0.95 Table 1. Statistical summary
SOLAR ASSESSMENT
Table 2. Skill score (SS) based in the mean square error (MSE) of hourly clearness
indices for GHI (kt) and DNI (kb) between the ECMWF global model and persistence forecast for one year.
𝑆𝑆 = 1 − 𝑀𝑆𝐸7'8⁄𝑀𝑆𝐸9:8
kt EVO MIT PRT ALC
SS 0.6975 0.6975 0.5775 0.6400
kb EVO MIT PRT ALC
SOLAR ASSESSMENT
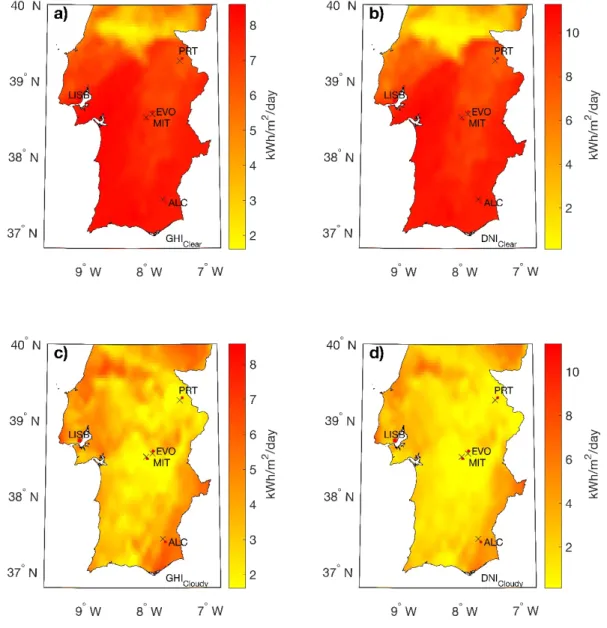
Figure 4 – Spatial distribution of predicted daily irradiation availability (kWh/m2/day) from the ECMWF model for two test cases in southern Portugal: one clear sky day (July 12th2016) and one cloudy day (May 8th2016). Irradiation maps are portrayedas: (a) GHIclear, (b) DNIclear, (c) GHIcloudyand (d) DNIcloudy.
SOLAR ASSESSMENT
Main results:
•DNI simulations are particularly
hindered by cloud and aerosol representation (i.e. a cloud effect underestimation during overcast periods and an aerosol effect overestimation during clear sky conditions, respectively).
•The predicted local solar
irradiation availabilities are
consistent with the measured reference values* for the region although the model tends to generally overestimate GHI and DNI, particularly the latter.
*GHI (1900 kWh/m2); DNI (> 2100 kWh/m2) in Cavaco et al. 2017
Figure 5. Spatial distribution of predicted annual GHI (a) and DNI (b)
OPERATIONALIZATION
In a preliminary analysis, IFS short-term forecasts, together with in-situ ground-based measurements, are used here in a simulated linear parabolic-trough power system through the System Advisor Model (SAM) software developed by the U.S. Department of Energy and National Renewable Energy Laboratory (NREL).
• A case study concerning a linear parabolic-trough system with similar configurations as the Andasol 3 CST project power plant (Granada, Spain) was presented as part of a preliminary analysis concerning the value of DNI predictions from the IFS for improvement of the operationalization of a CST system.
• Output of the respective annual electricity injection to the grid EG (MWh) from a CST power plant.
• A validation method is used to understand how to improve the overall performance of a solar unit.
• The selected study location was Évora city (N38.567686, W7.91172) in the southern region of Portugal.
• Hourly ground-measured and forecasted data (based in a 24-hour prediction horizon from the IFS) were analyzed for a 365-day period, from April 1st 2016 to March 31st 2017. Both
measured and forecasted time-series include irradiance and meteorological data which are used as input parameters for the SAM power plant model in order to calculate the corresponding energy production.
a) b)
d) c)
OPERATIONALIZATION
• The EG based on forecasted data
shows an overestimation of ≈17.159 MWh of the total annual energy
against EG based on measurements,
i.e. a relative difference of ≈12.16%.
• Deviations in relation to the
referenced annual energy generation of the Andasol 3 CST power plant (175.000 MWh/year), which result mainly from not using during the
simulation the exact same
configurations as the Andasol 3 CST, since such information is not
available. Figure 6. Direct Normal Irradiances, DNI (W/m2), from measured
(a) and IFS forecasted data (b) in Évora (southern Portugal), together with the respective electricity injection to the grid, EG
(MWh), (c) and (d), respectively ~141.160 and ~158.320
• Significantly higher correlation (r) between
EG based on measured and forecasted data,
mainly for daily values.
• Lower correlations (hourly values) are the
result of induced errors due to overcast and partly cloudy periods in which NWP predictions still need to be improved regarding cloud representation.
• Zero values found in the hourly results are
related to shutdown periods and unusable stored energy. This is evident in EG based on both measurements and IFS forecasts.
OPERATIONALIZATION
Figure 7. Energy injection to the grid, EG
(MWh). Hourly (a, b) and daily (c, d) results for EVO station (Évora, southern Portugal) during
OPERATIONALIZATION
• High correlations between predictions of energy to grid based on measurements and IFS forecasts are obtained mainly for daily values, while hourly values are hindered by cloud representation mainly during overcast periods.
• The forecasting skill (SS) shows that the IFS has a good overall performance despite the current difficulties that NWP models have in predicting DNI during overcast periods.
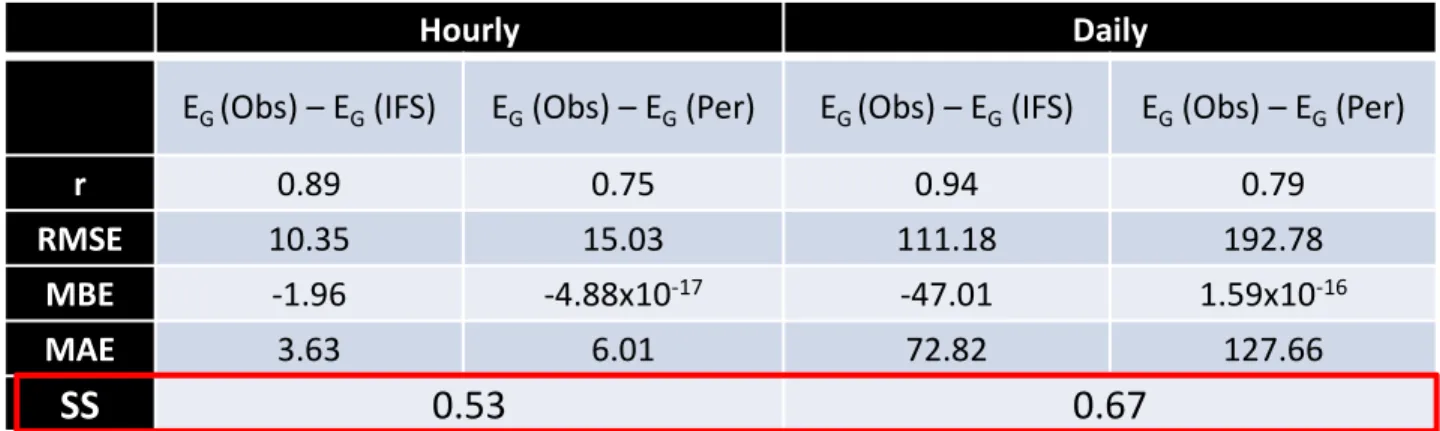
Table 3. Statistical summary of the energy injection to the grid, EG (MWh), obtained through SAM based on measurements (Obs), IFS forecasts (IFS)
and persistence model (Per) for EVO station (Évora, southern Portugal).
Hourly Daily
EG (Obs) – EG(IFS) EG(Obs) – EG(Per) EG (Obs) – EG(IFS) EG(Obs) – EG(Per)
r 0.89 0.75 0.94 0.79 RMSE 10.35 15.03 111.18 192.78 MBE -1.96 -4.88x10⁻¹⁷ -47.01 1.59x10⁻¹⁶ MAE 3.63 6.01 72.82 127.66 SS 0.53 0.67 EVO kt kb SS 0.6975 0.6094 Table 4
ON GOING WORK
• The use of an upgraded version of the radiative scheme named ecRad (Cycle 43R3) which has recently become operational in July 11th 2017 (ECMWF , 2017).
• A more robust statistical analysis that includes the simulation of different types of CST power systems with higher number of input parameters from real power plants in the SAM software.
• These aspects will certainly allow for higher levels of confidence to be reached when using forecasted DNI in CST power systems.
• F. M. Lopes, H. G. Silva, R. Salgado, A. Cavaco, P. Canhoto, M. Collares-Pereira, “Short-term Forecasts of GHI and DNI for Solar Energy Systems Operation: Assessment of the ECMWF Integrated Forecasting System in Southern Portugal”, Solar Energy, 170, pp. 14-30, doi:
10.1016/j.solener.2018.05.039, 2018.
• Francis M. Lopes, Ricardo Conceição, Hugo G. Silva, Rui Salgado, Paulo Canhoto, Manuel
Collares-Pereira, “Predictive Value of Short-term Forecasts of DNI for Solar Energy Systems
Operation”, Solar PACES 2018, Conf. Proc. Submitted.
• Cavaco, A., Silva, H.G., Canhoto, P., Osório, T., Collares-Pereira, M., 2017. Progresses in DNI Measurements in Southern Portugal. Solar Paces 2017, AIP Conf. Proc. Submitted
• The System Advisor Model (SAM), version 2017.9.5, www.sam.nrel.gov/content/downloads, NREL 2018. • The Andasol 3 CST project (Granada, Spain), www.nrel.gov/csp/solarpaces/project_detail.cfm/projectID=117, NREL 2018. • European Centre for Medium-Range Weather Forecasts (ECMWF) Newsletter 2017, Shinfield Park, Reading, RG2 9AX, England.
REFERENCES
ACKNOWLEDGEMENTS
This work was co-funded by the European Union through the European Regional Development
Fund, framed in COMPETE 2020 (Operational Program Competitiveness and
Internationalization), through the Institute of Earth Sciences (UID/GEO/04683/2013) with reference POCI-01-0145-FEDER-007690 and projects DNI-A (ALT20-03-0145-FEDER-000011), ALOP (ALT20-03-0145-FEDER-000004) and INSHIP (H2020, grant 731287). F.M. Lopes is thankful for the FCT scholarship (SFRH/BD/129580/2017) and H.G. Silva to DNI-A and INSHIP projects.