Article
Printed in Brazil - ©2017 Sociedade Brasileira de Química 0103 - 5053 $6.00+0.00
*e-mail: [email protected]
Physicochemical Properties and Field Evaluation of Monolithic Wax Formulations
for the Controlled Release of a Forest Pest Pheromone
Mariel P. Slodowicz,*,a Esteban Ceriani-Nakamurakare,b Cecilia Carmaránb and
Paola A. González-Audinoa,c
aCentro de Investigaciones de Plagas e Insecticidas, J. B. De La Salle 4397,
B1603ALO Villa Martelli, Provincia de Buenos Aires, Argentina
bDepartamento de Biodiversidad y Biología Experimental, FCEN, Universidad de Buenos Aires,
Ciudad Universitaria, Pabellón II, C1428EHA Buenos Aires, Argentina
c3IA, Universidad Nacional de General San Martín, Av. 25 de Mayo y Francia, San Martín,
Provincia de Buenos Aires, Argentina
This work shows the way to develop a monolithic device for the release of an active agent. Different waxes to prepare monolithic dispensers were used. Studies to characterize the release rate of the pheromone dispensers, and to determine many physicochemical properties of the active components and waxes utilized as matrices, were conducted. The advantages of using monolithic devices as an insect pheromone dispenser in order to control an insect that attacks commercial poplar plantations were demonstrated. Also, the practical application employing monolithic dispensers
manufactured in this paper with the sex pheromone of the ambrosia beetle Megaplatypus mutatus
(Coleoptera: Platypodidae) was verified. This forest pest is known to attack tree plantations in South America. The release rates were mainly dependent of matrix hardness and viscosity, as well as the particle size of fillers. A good performance of the formulated monolithic dispensers was observed during the field trials, with a reduction of damage levels of 40%.
Keywords: monolithic dispenser, controlled-release, sulcatone, sulcatol, 3-pentanol
Introduction
Monolithic systems are devices used for controlling the release of an active agent.1 Many factors are responsible
for a solute release, such as solute concentration, diffusion coefficients of the solute, the solubility of the solute in the matrix, and other additional factors like filler materials. Physical properties of polymers and its handling characteristics can be modified by incorporation of filler materials.2
For the analysis of controlled release data from polymeric devices of varying geometry, Ritger and Peppas3
proposed a new empirical exponential expression which relates the fractional release of drug, Mt (amount released at time)/M∞ (amount released at
time, infinity), to the release time, t. The relationship between diffusional exponent n and the corresponding release mechanism is clearly dependent upon the geometry
employed (like thin film, cylindrical and spherical sample). Pheromones can be incorporated in a solid matrix to form monolithic dispensers. Because of the various materials that can be used to constitute a matrix, the release rate for a single molecule can differ significantly from one device to another. Knowledge and study of release kinetics and factors that affect pheromones release plays a crucial role in the development of efficient pheromone dispensers, giving a rational delivery of pheromones in the field.4
Pheromones are behavior-modifying semiochemicals released by insects to communicate between members of the same species. Synthetic pheromones are widely used because their species specificity and environmental profile makes them attractive for integrated pest management.5
Megaplatypus mutatus (Coleoptera: Platypodidae) is a
South American ambrosia beetle. It attacks only standing live trees, causing severe stem breakage and death in commercial poplar (Populus) plantations.7 Also, M. mutatus
was reported in plantations of brazilwood in Northeastearn Brazil.8
In our lab, Funes et al.9 manufactured plastic pheromone
reservoir dispensers for the pheromone components of
M. mutatus (+)-sulcatol, sulcatone and 3-pentanol. Zero
order kinetics (releasing between 60-100 mg per day of
pheromone) was achieved using polyethylene bags and glass vials with semi permeable caps and successful results in M. mutatus mating disruption strategies were obtained.
The (+) enantiomer of sulcatol is the natural pheromone component of the beetle. Racemic (and low cost) sulcatol can be used in replacement of (+)-sulcatol, as demonstrated in previous works that the (−) isomer does not interfere with its attracting capacity, allowing the use of racemic sulcatol both for laboratory and field tests.
In this work, monolithic dispensers for the three components known to constitute the pheromone of
M. mutatus: 6-methyl-5-hepten-2-one (sulcatone),
(+)-6-methyl-5-hepten-2-ol (sulcatol) and 3-pentanol were developed. Additionally, the release kinetic of these three compounds and the most important parameters that influence the release rate from these dispensers were studied. Finally, selected dispensers were deployed in field plots and its potential for the mating disruption of the beetle was evaluated.
Experimental
Chemicals
Sulcatone (6-methyl-5-hepten-2-one), (±)-sulcatol
(6-methyl-5-hepten-2-ol), from Vigon International, East Stroudsburg, PA, USA and 3-pentanol (Sigma-Aldrich, Germany) were the pheromone components utilized in the development of dispensers.
Paraffin wax of melting point (mp) 53-57 and 70-80 ºC (Sigma Aldrich, Germany), paraffin oil (Fluka, Germany), lanolin wax, bees wax, polyethylene glycol 6000 and 4000 (Parafarm S.A., Argentina), pentaerythritol ester of lanolin (Rolex Lanolin Limited, Mumbai, India, free sample), carnauba wax of Brazilian origin and stearin (Serain Juarez S.A., Buenos Aires, Argentina) were the waxes formulated into monolithic dispensers.
Glass spheres, Chinese talc (local supplier), activated charcoal (Merck, Germany), and molecular sieve of 5 Å porosity and 4-8 mesh (Aldrich Chemical Company, Milwaukee, WI, USA) were the fillers added to the different matrices to alter pheromone release rates.
Monolithic dispensers and release rate determination
The pheromone is homogeneously dissolved and/or dispersed in a polymer matrix in monolithic systems.10
Preparation of dispensers for release rate studies were carried out by melting the wax matrix and by the addition of 20%(m/m) of the individual pheromone. The system was completely mixed and the resulting mixture was poured into a mold with half sphere shaped wells of 3 cm diameter. Molded dispensers were solidified in the fridge. Dispensers were removed from the mold for evaluation in wind tunnel at 29-30 °C with a wind speed
of 0.5-0.6 m s-1. The devices were placed inside the tunnel
and the pheromone components mass loss quantified during 30-70 days until their release rate were less than 10 mg per day. Three replicates were performed for each
release rate experiment. The devices were developed using 20% m/m pheromone component for all cases because it was observed in previous studies in our laboratory that, with this amount of pheromone component, the device releases sufficient quantities of active agent and has a good texture without matrices ruptures. Furthermore, good results were observed in the field using this concentration of active ingredient.11
Graphs of pheromone components release from dispensers were plotted using SigmaPlot 11.0 software, by plotting the residual mass in the dispensers versus time in
days. Release rates were determined by differentiation of the curve mass vs. time using Origin 6.0 software.
Waxes solubility
Wax solubility was measured in toluene and 2-propanol. Measuring solubility in water was not possible because most waxes have low solubility in this polar solvent. Since the polarities of the two solvents are very different, we calculated a quotient between the two solubilities, S, for each matrix, obtaining the parameter Stoluene/S2-propanol.
Solubility measurements were made in test tubes. A small amount of the wax or mix of waxes (10-30 mg) was weighed, and a continuous process of addition of solvent-heating-cooling followed until complete dissolution of the wax. Complete solubilization was considered when no turbidity was noticed after 5 hours at 23 °C. Matrix
solubility was determined in both solvents by three replicates.
Dispersion ability of pheromone components in matrices
mix of waxes (10-30 mg) was weighed in an assay tube. Then, a known volume of the pheromone component was added, and the mixture was heated until homogenization; afterwards, the system was allowed to reach room temperature until complete solidification. The addition of the pheromone component continued until the appearance of a heterogeneous (pheromone component liquid phase) phase of pheromone component (maximum dispersion of pheromone in the matrix). As a result, in all experiments solid solutions were formed until the dispersion value limit of pheromone component in the matrices was reached. Pheromone component dispersion in matrices was determined in three replicates.
Matrices and pheromone components viscosity
Kinematic viscosity of pheromone components and wax matrices was measured (in centiStokes) at 20 and 100 °C,
respectively. Kinematic viscosity of solid substances was measured away from the melting point because near that temperature, solids would not behave as a Newtonian fluid. The analyses were made following ASTM D445-06 method12 modified in sections 6.3 and 6.4 of the norm by
applying ± 0.1 instead of ± 0.02 °C.
Polarity (log P) and molecular volume of pheromone components
Pheromone components molecules were built using Molecular Modelling software (HyperChem Release software 8.0, Hypercube, INC), drawn with 3D Model Builder, the double bonds were marked and the structure was minimized using the MM+ force field. Polarity, as log P,
and molecular volume were calculated with HyperChem 8.0 software using the QSAR-properties menu.
Melting point of waxes
Melting point (mp) was measured in a fusiometer model 7911 ISV brand equipped with a glycerin bath, where a capillary tube containing the wax sample was heated up to the fusion temperature of the wax.
Filler particle and pore size
Filler particle size by scanning electron microscopy (SEM) by taking images at different magnifications (×50, ×200, ×1000 and ×4000) was determined. The filler samples were mounted on a stub of metal with adhesive coated with 60-40 nm of gold. Particles were treated as ellipses for surface determination. We sampled 40 particles per picture
and calculated a weighed mean surface. In the same way, the pore size for activated charcoal, one of the porous filler, was calculated.
Shore D hardness
The matrices hardness assay was performed with a S1 N122608 Shore D hardness tester by the ASTM D 2240 method.13 The conditions during this assay were maintained
at 23 °C, with a 50% of relative humidity. Twelve replicates
per sample of matrix were carried out in the experiments.
Statistical analysis of physicochemical parameters and pheromone components release rates
Statistical analysis was performed using InfoStat software (National University of Córdoba, Argentina). Normality assumption with Shapiro-Wilk test was studied. The regressions with the better adjustments of data were selected taking into account the lowest values of standard error, Akaike information criterion (AIC) and Bayesian information criterion (BIC).
Field evaluations trials
Field trials were performed during the flight season of
M. mutatus between 15 February and 24 April 2013, in a
12 ha stand of 12 year-old Populus deltoides tree plantation
located at Alberti, Buenos Aires Province, Argentina, with a diameter at breast height (DBH) of 78.5 ± 0.47 cm. From the 12 ha stand, three 0.5 ha areas were delimited; two areas for treatment and one for control; each area was separated by 150 m. The pheromone dispensers were pinned on a small nail on the surface of the trees in sets of three (one dispenser for each pheromone component) adjacent to each other, at 1.6 m above the ground. The sets were uniformly distributed throughout each treatment plot at a density of 40 sets of three per ha. Devices were
checked weekly and replaced before total depletion. Two parameters were used to evaluate damage by M. mutatus:
mating galleries (MG) and active galleries (AG).14,15
M. mutatus damage in control and pheromone-treated plots
was assessed before placing the pheromone devices and 21 days after treatment. Damage assessment was carefully carried out before the trial by examining tree trunks, identifying AG and MG, and numbering them individually. In both treated and control plots, we randomly sampled 14 trees ha-1. Damage in treated and control plots was
expressed as mean number of MG or AG per tree, and was
compared by a t-test after the trial (Statistica 5.0; StatSoft,
Results and Discussion
Physicochemical properties of matrices
Table 1 shows the obtained values for solubility in toluene and 2-propanol, and the Stoluene/S2-propanol coefficients
for wax matrices. Table 2 presents the melting points, Shore D hardness and kinematic viscosities of the matrices. Lanolin wax and polyethylene glycols 4000 and 6000 showed the highest values of Stoluene/S2-propanol
coefficients while stearin showed the lowest value. In the case of polyethylene glycols matrices, higher values of Stoluene/S2-propanol quotient are probably due to its amphiphilic
property16 and to the formation of enriched phases of
polymer in these polyethylene glycols matrices thanks to the presence of hydrophobic groups of methylene along polymer chain that are inserted between the alcohol or ether groups17 (Table 1). The results also showed that
the harder matrices were polyethylene glycol 4000 and 6000 and carnauba wax, while the softer matrices were paraffin wax mp 53-57 °C and stearin. Hardness of lanolin
wax, pentaerythritol ester of lanolin and paraffin wax mp 53-57 °C (40%) + paraffin oil (60%) could not be
determined with this method because they were not hard enough for their measurement (Table 2).
Polyethylene glycol 6000 and 4000 showed the highest kinematic viscosities values, while paraffin wax mp 53-57 ºC and paraffin oil/paraffin wax mp 53-57 ºC showed the lowest viscosity values measured at 100 ºC (Table 2). Kung18 in 1997 found that for cellulose acetate butyrate
solution used for microencapsulation, drug loading was significantly influenced by the solution viscosity, where higher viscosity of the polymer solution produced microcapsules with low drug loading.
Regarding to the three pheromone components, sulcatone presented the lowest viscosity and sulcatol, the
Table 1. Values of solubility in toluene and 2-propanol, and Stoluene/S2-propanol coefficients for wax matrices
Matrix Solubility in toluene ± SEa,b /
(g per 100 mL)
Solubility in 2-propanol ± SEa,b /
(g per 100 mL) Stoluene / S2-propanol
Paraffin wax mp 70-80 °C 0.269 ± 0.008 0.0073 ± 0.0003 37
Paraffin wax mp 53-57 °C 1.585 ± 0.113 0.0170 ± 0.0005 93
Paraffin wax mp 53-57° C + paraffin oil 4.101 ± 0.116 0.0458 ± 0.0026 90
Lanolin pentaerythritol ester 26.786 ± 1.273 0.0377 ± 0.0019 711
Stearin 13.863 ± 0.615 4.693 ± 0.234 3
Carnauba wax 2.219 ± 0.218 0.0056 ± 0.0002 396
Bees wax 6.670 ± 0.589 0.0116 ± 0.0002 575
Lanolin wax 69.850 ± 5.211 0.1583 ± 0.0001 441
Polyethylene glycol 4000 6.706 ± 0.236 0.0057 ± 0.0001 1176
Polyethylene glycol 6000 6.083 ± 0.219 0.0045 ± 0.0002 1352
aSE: standard error = standard deviation/(replicas numbers)0.5; bafter 5 hours at room temperature.
Table 2. Melting points, Shore D hardness and kinematic viscosities values of wax matrices
Matrix Melting point / °C Kinematic viscositya / cSt Shore D hardnessb± SE
Paraffin wax mp 70-80 °C 75.0 9.2 70.9 ± 4.3
Paraffin wax mp 53-57 °C 55.0 4.1 64.0 ± 5.6
Paraffin wax mp 53-57° C + paraffin oil 42.3 5.4 –c
Lanolin pentaerythritol ester 52.5 – –c
Stearin 57.0 5.5 64.5 ± 4.2
Carnauba wax 80.5 37.0 81.9 ± 7.9
Bees wax 61.7 11.0 71.0 ± 4.0
Lanolin wax 32.0 35.4 –c
Polyethylene glycol 4000 51.3 135.3 83.6 ± 8.0
Polyethylene glycol 6000 53.0 340.6 86.7 ± 8.0
aWaxes kinematic viscosities measured at 100 ºC; bSE = standard error; SE = standard deviation/(replicas numbers)0.5; ccould not be determined because
highest, measured at 20 ºC. 3-Pentanol had the lowest log P as it is the more polar molecule, and sulcatone, the highest log P value as it is the less polar molecule (Table 3).
The dispersion values of the pheromone components are presented in Figure 1. The results indicated that 3-pentanol had the highest ability to disperse in paraffin wax mp 53-57 ºC, followed by paraffin wax mp 70-80 ºC, paraffin oil mixed with paraffin wax mp 53-57 ºC, carnauba wax, pentaerythritol ester of lanolin and lanolin wax (possibly due to the smaller sized molecule that would be better accommodated in the structure of the waxes) but had low dispersion values in stearin and bees wax. Sulcatone had the highest ability to disperse in stearin and lower dispersion values in the other matrices. Sulcatol had the highest ability to disperse in bees wax and lower values in the other matrices. Also, higher values of dispersion ability of pheromone components would allow preparation of dispensers with a more amount of active agent (pheromone). Generally, the active agent dissolves in the polymeric or elastomeric matrix until saturation. Additional active agent remains dispersed within the polymer matrix after it is physically dispersed and molded or cured. As the agent evaporates from the
surface of the monolithic device, more agent diffuses out from the interior in response to the decreased concentration gradient leading to the surface.1 The diffusion of pheromone
components in matrices affects the release rates of active compounds in the monolithic dispensers.
Filler material surface and pore size were obtained from SEM. Larger size fillers, such as molecular sieve and glass spheres, were measured with a caliber (± 0.5 mm error). In
the case of molecular sieve and activated charcoal, which are porous materials, surface was determined from pore size (Table 4).
Particle surface of filler types ordered from smallest to largest was kaolin, Chinese talc, activated charcoal, glass spheres and molecular sieve.
There can be a large increase in solubility of molecular species that strongly interact with the surfaces of inorganic fillers. The presence of filler particles can also affect the diffusion behavior. Filler particles lead to the presence of internal interfaces within the material that may play a role in the diffusion process. Conversely, strong interactions between diffusing molecules and particle surfaces may reduce permeation rates.18
Table 3. log P, kinematic viscosity (measured at 20 ºC) and molecular volume of pheromone components
Pheromone component Kinematic viscosity / cSt log P Molecular volume / Å3
Sulcatone 1.148 2.09 524.45
3-Pentanol 7.472 1.43 390.32
Sulcatol 7.801 2.04 539.28
Pheromone components release rates
The equation of depletion of pheromone components from wax formulations was characterized by m = ct1/2,
where m is the daily cumulative mass, c is a constant and t is the time in days. The p-value (probability) was < 0.0001
in all determinations, and means significant difference for c parameter in the regression expression. This equation describes a solute release when it is dispersed in a matrix.2
The initial release rates Vi were calculated from the
release rates curves, and the time t was measured in days until the release rate of the pheromone components was less than 10 mg per day (Tables 5, 6and7).
The release rates obtained in these experiments were in the 4-400 mg per dayrange, approximately.
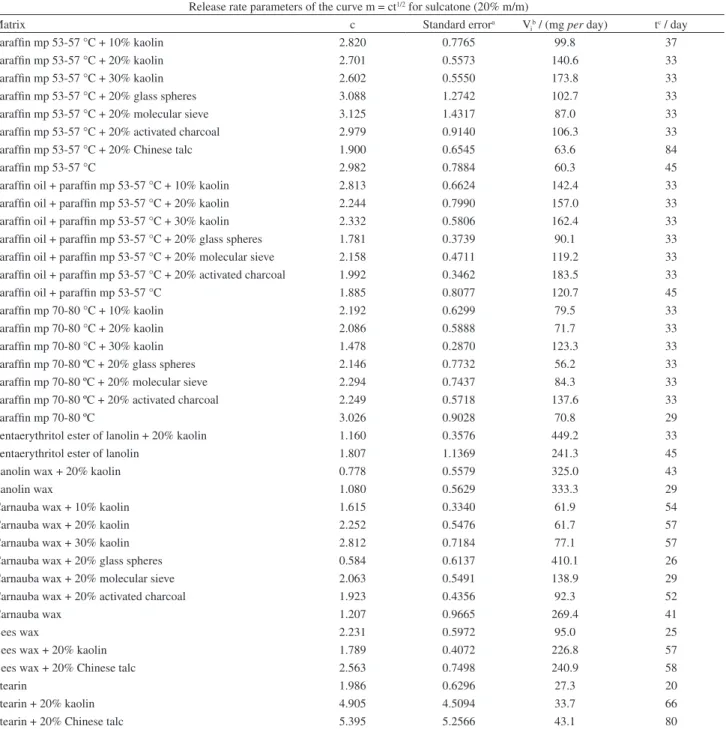
For sulcatone, the results showed that the highest Vis were
obtained with pentaerythritol ester of lanolin +20% m/m kaolin and with carnauba wax +20% m/m glass spheres releasing over 400 mg of sulcatone in the initial day. The lowest Vis were obtained with stearin and stearin mixed
with 20% kaolin, releasing 27.3 and 33.7 mg in the initial day, respectively (Table 5). In almost all matrices where kaolin was used as filler material in concentrations of 10, 20 and 30% m/m, Vi increased in the order Vi 10%, Vi 20%,
Vi 30% (Table 5). Knowing the t value, the time of depletion
of dispensers for their usage in future field trials can be estimated. The longest t values were noticed in paraffin mp 53-57 ºC +20% m/m Chinese talc and in stearin +20% Chinese talc matrices; the shortest tvalues were obtained in bees wax and stearin matrices.
For 3-pentanol, the results demonstrated that the highest Vis were obtained with carnauba wax +20% m/m molecular
sieve, releasing over 500 mg of 3-pentanol in the initial day. The lowest Vis were obtained with stearin without fillers
and with stearin mixed with 20% kaolin, releasing 21.9 and 31.6 mg in the first day, respectively (Table 6). The longest t value was observed in stearin +20% kaolin matrix and the shortest t value, in stearin matrix without filler (Table 6).
For sulcatol dispensers, the highest Vis were obtained
in polyethylene glycol 4000 +20% m/m activated charcoal matrix, and the lowest Vis were obtained with stearin without
filler and with stearin +20% m/m Chinese talc, releasing 9.7 and 12.1 mg in the first day, respectively (Table 7). In the cases where pheromone release rates without fillers were very low (less than 20 mg per day) we did not try mixtures
with fillers (Table 7). The longest t value was observed in polyethylene glycol 6000 without filler matrix, and the shortest t value was obtained when stearin without filler matrix was employed. In cases where the initial release rates of the pheromone compounds without filler were very low for sulcatol (less than 30 mg per day) or matrices
were very soft for handling or field use (lanolin wax, paraffin oil/paraffin mp 53-57 °C), the respective mixtures
with fillers were not tested.
For sulcatol, sulcatone and 3-pentanol, Vi increases
with the addition of filler materials in almost all matrices; the increment of filler concentration increases Vi probably
due to an increment of matrix tortuosity that favors a faster release of pheromone to the environment. As the particle filler surface increases, the parameter Vi increases too. In
particular, for 3-pentanol, if the filler particle size decreases, Vi diminishes. Consequently, a lower amount of pheromone
component from the matrix would be released over time, because a smaller filler particle size would interact more with 3-pentanol molecule.
It is important to mention here that the selection of monolithic dispensers for field trials needs to be done with a number of criteria in mind. For instance, Vi of dispensers
ought tobe relatively high and constant, and release the necessary amount of pheromone component to produce the mating disruption of the insect. On the other hand, melting point and hardness of the mixtures of matrices + fillers + pheromones should be considered, as dispensers could easily melt in field conditions during warm summer temperatures or be easily washed away by heavy rains. So, the selection of the optimal dispenser with the commitment of all these factors combined together should be made.
Comparing the Vi of the three pheromone components for all matrices, with the exception of carnauba wax, Vi of sulcatol, sulcatone and 3-pentanol without fillers
in increasing order was: Visulcatol, Vi3-pentanol, Visulcatone.
For carnauba wax, Vi in increasing order was: Visulcatol,
Table 4. Filler materials surfaces determinations
Filler material Particle surface (weighted average) / µm2 Pore size (weighted average) / µm2
Micronized kaolin 59 –
Activated charcoal 14250 46
Chinese talc 711 –
Molecular sieves 40571118 1.96 × 10⁻⁶
Visulcatone, Vi3-pentanol. For all the paraffin waxes, including
pentaerythritol ester of lanolin, lanolin wax, stearin and bees wax matrices, Vi without fillers were compared. Then,
it was noticed that Vi3-pentanol, the most polar molecule, was
the smallest, and Visulcatone, the least polar molecule, was the
highest. Carnauba wax presented different Vis for the three
pheromone components, where sulcatol had the lowest Vi
and 3-pentanol had the highest Vi in this matrix.
The highest release rates for sulcatone compared to
sulcatol and 3-pentanol could be attributed to its inability to form hydrogen bonds towards esters, thus decreasing interaction and increasing release rate.
Analysis of pheromone components transport from wax dispensers
The value of n, the diffusion exponent, was calculated by plotting the experimental data of pheromone components
Table 5. Vi, c, and t parameters from release curves with their respective standard errors of wax monolithic dispensers for sulcatone
Release rate parameters of the curve m = ct1/2 for sulcatone (20% m/m)
Matrix c Standard errora V
ib / (mg per day) tc / day
Paraffin mp 53-57 °C + 10% kaolin 2.820 0.7765 99.8 37
Paraffin mp 53-57 °C + 20% kaolin 2.701 0.5573 140.6 33
Paraffin mp 53-57 °C + 30% kaolin 2.602 0.5550 173.8 33
Paraffin mp 53-57 °C + 20% glass spheres 3.088 1.2742 102.7 33
Paraffin mp 53-57 °C + 20% molecular sieve 3.125 1.4317 87.0 33
Paraffin mp 53-57 °C + 20% activated charcoal 2.979 0.9140 106.3 33
Paraffin mp 53-57 °C + 20% Chinese talc 1.900 0.6545 63.6 84
Paraffin mp 53-57 °C 2.982 0.7884 60.3 45
Paraffin oil + paraffin mp 53-57 °C + 10% kaolin 2.813 0.6624 142.4 33
Paraffin oil + paraffin mp 53-57 °C + 20% kaolin 2.244 0.7990 157.0 33
Paraffin oil + paraffin mp 53-57 °C + 30% kaolin 2.332 0.5806 162.4 33
Paraffin oil + paraffin mp 53-57 °C + 20% glass spheres 1.781 0.3739 90.1 33
Paraffin oil + paraffin mp 53-57 °C + 20% molecular sieve 2.158 0.4711 119.2 33
Paraffin oil + paraffin mp 53-57 °C + 20% activated charcoal 1.992 0.3462 183.5 33
Paraffin oil + paraffin mp 53-57 °C 1.885 0.8077 120.7 45
Paraffin mp 70-80 °C + 10% kaolin 2.192 0.6299 79.5 33
Paraffin mp 70-80 °C + 20% kaolin 2.086 0.5888 71.7 33
Paraffin mp 70-80 °C + 30% kaolin 1.478 0.2870 123.3 33
Paraffin mp 70-80 ºC + 20% glass spheres 2.146 0.7732 56.2 33
Paraffin mp 70-80 ºC + 20% molecular sieve 2.294 0.7437 84.3 33
Paraffin mp 70-80 ºC + 20% activated charcoal 2.249 0.5718 137.6 33
Paraffin mp 70-80 ºC 3.026 0.9028 70.8 29
Pentaerythritol ester of lanolin + 20% kaolin 1.160 0.3576 449.2 33
Pentaerythritol ester of lanolin 1.807 1.1369 241.3 45
Lanolin wax + 20% kaolin 0.778 0.5579 325.0 43
Lanolin wax 1.080 0.5629 333.3 29
Carnauba wax + 10% kaolin 1.615 0.3340 61.9 54
Carnauba wax + 20% kaolin 2.252 0.5476 61.7 57
Carnauba wax + 30% kaolin 2.812 0.7184 77.1 57
Carnauba wax + 20% glass spheres 0.584 0.6137 410.1 26
Carnauba wax + 20% molecular sieve 2.063 0.5491 138.9 29
Carnauba wax + 20% activated charcoal 1.923 0.4356 92.3 52
Carnauba wax 1.207 0.9665 269.4 41
Bees wax 2.231 0.5972 95.0 25
Bees wax + 20% kaolin 1.789 0.4072 226.8 57
Bees wax + 20% Chinese talc 2.563 0.7498 240.9 58
Stearin 1.986 0.6296 27.3 20
Stearin + 20% kaolin 4.905 4.5094 33.7 66
Stearin + 20% Chinese talc 5.395 5.2566 43.1 80
aStandard error obtained from SigmaPlot software; bcalculated from the differentiation of the pheromone component release curve mass vs. time; ctime in
release curves from matrices without fillers materials until almost 100% were released. Plots were fitted in the power equation form Mt/M∞ = kxn, where n is the diffusion
exponent, k is a constant and Mt/M∞ is the fractional release
of the pheromone component (Table 8).
According to Peppas and Ritger,3 for non-swellable
controlled release systems spherical samples, the drug release mechanism depends on diffusional exponent n, where values of n lower than 0.43 mean a Fickian diffusion,
values 0.43 < n < 1.00 anomalous (non-Fickian) transport and n = 1.00 determines a zero-order release.19
For sulcatone, we obtained that in paraffin wax mp 70-80 ºC, paraffin wax mp 53-57 ºC, paraffin oil (60%)/ paraffin wax mp 53-57 ºC (40%), stearin and bees wax matrices, pheromone component transport would occur by non Fickian diffusion. However, in carnauba wax and in lanolin wax matrices, Fickian diffusion would be the responsible transport mechanism. In lanolin pentaerythritol
Table 6. Vi, c, and t parameters from release curves with their respective standard errors of wax monolithic dispensers for 3-pentanol
Release rate parameters of the curve m = ct1/2 for 3-pentanol (20% m/m)
Matrix c Standard errora V
ib / (mg per day) tc / day
Paraffin mp 53-57 °C + 10% kaolin 2.658 1.1157 65.9 32
Paraffin mp 53-57 °C + 20% kaolin 2.035 0.5186 85.7 32
Paraffin mp 53-57 °C + 30% kaolin 2.127 0.3769 189.5 32
Paraffin mp 53-57 °C + 20% glass spheres 3.971 1.5550 41.2 32
Paraffin mp 53-57 °C + 20% molecular sieve 3.441 1.8681 55.0 32
Paraffin mp 53-57 °C + 20% activated charcoal 2.817 1.2241 92.8 32
Paraffin mp 53-57 °C + 20% Chinese talc 3.851 3.0523 39.4 55
Paraffin mp 53-57 °C 2.891 0.9340 31.9 37
Paraffin oil + paraffin mp 53-57 °C + 10% kaolin 2.755 0.7570 126.1 61
Paraffin oil + paraffin mp 53-57 °C + 20% kaolin 2.523 1.0329 142.4 61
Paraffin oil + paraffin mp 53-57 °C + 30% kaolin 2.199 1.1170 173.9 57
Paraffin oil + paraffin mp 53-57 °C + 20% glass spheres 2.414 0.6077 120.2 57
Paraffin oil + paraffin mp 53-57 °C + 20% molecular sieve 1.958 0.6968 183.3 61
Paraffin oil + paraffin mp 53-57 °C + 20% activated charcoal 1.890 1.0373 130.1 61
Paraffin oil + paraffin mp 53-57 °C 2.058 0.6988 74.6 45
Paraffin mp 70-80 °C + 10% kaolin 2.071 0.8576 47.3 33
Paraffin mp 70-80 °C + 20% kaolin 2.208 0.8416 86.8 33
Paraffin mp 70-80 °C + 30% kaolin 2.065 0.5690 124.8 33
Paraffin mp 70-80 ºC + 20% glass spheres 2.939 1.2982 74.2 33
Paraffin mp 70-80 ºC + 20% molecular sieve 2.930 1.0561 83.2 33
Paraffin mp 70-80 ºC + 20% activated charcoal 3.460 1.5202 47.0 33
Paraffin mp 70-80 ºC 3.077 1.0039 37.6 37
Pentaerythritol ester of lanolin + 20% kaolin 1.592 0.7668 328.9 33
Pentaerythritol ester of lanolin 1.826 0.9254 196.2 45
Lanolin wax + 20% kaolin 1.777 0.6011 203.2 57
Lanolin wax 1.594 0.7724 190.8 45
Carnauba wax + 10% kaolin 0.628 0.5533 230.8 38
Carnauba wax + 20% kaolin 1.076 0.6001 378.7 43
Carnauba wax + 30% kaolin 1.327 0.8663 263.6 50
Carnauba wax + 20% glass spheres 1.174 0.2043 401.5 38
Carnauba wax + 20% molecular sieve 1.985 0.3359 538.7 38
Carnauba wax + 20% activated charcoal 0.937 0.5525 403.7 38
Carnauba wax 1.097 0.4919 402.9 29
Bees wax 2.567 0.8584 50.4 25
Bees wax + 20% kaolin 2.755 0.8888 187.7 64
Bees wax + 20% Chinese talc 4.211 3.3016 134.2 66
Stearin 1.896 0.5667 21.9 18
Stearin + 20% kaolin 4.600 4.4004 31.6 73
Stearin + 20% Chinese talc 4.502 3.3392 59.2 64
aStandard error obtained from SigmaPlot software; bcalculated from the differentiation of the pheromone component release curve mass vs. time; ctime in
ester the two pheromone transports (Fickian and non-Fickian diffusion) mechanisms would be present according to the lower and upper confidence intervals (Table 8). For sulcatol, results showed that non-Fickian diffusion was
the responsible mechanism for the pheromone component transport in all matrices (Table 8). For 3-pentanol, we obtained that in paraffin wax mp 70-80 ºC, paraffin wax mp 53-57 ºC, paraffin oil (60%)/paraffin wax mp 53-57 ºC
Table 7. Vi, c, and t parameters from release curves with their respective standard errors of wax monolithic dispensers for sulcatol
Release rate parameters of the curve m = ct1/2 for sulcatol (20% m/m)
Matrix c Standard errora V
ib / (mg per day) tc / day
Polyethylene glycol 4000 3.589 1.5744 100.3 33
Polyethylene glycol 4000 + 10% kaolin 2.668 0.9069 146.4 40
Polyethylene glycol 4000 + 20% kaolin 2.200 1.0689 213.3 40
Polyethylene glycol 4000 + 30% kaolin 2.079 1.0751 234.3 40
Polyethylene glycol 4000 + 20% glass spheres 1.629 0.6254 270.6 31
Polyethylene glycol 4000 + 20% molecular sieve 2.034 0.4558 192.1 26
Polyethylene glycol 4000 + 20% activated charcoal 1.827 0.9049 291.6 40
Polyethylene glycol 6000 2.692 0.8970 127.8 54
Polyethylene glycol 6000 + 10% kaolin 2.745 0.7716 145.7 53
Polyethylene glycol 6000 + 20% kaolin 2.409 0.8437 185.3 53
Polyethylene glycol 6000 + 30% kaolin 1.987 0.6639 275.2 53
Polyethylene glycol 6000 + 20% glass spheres 1.348 0.7444 237.8 44
Polyethylene glycol 6000 + 20% molecular sieve 2.096 0.5156 129.8 42
Polyethylene glycol 6000 + 20% activated charcoal 1.885 0.5673 251.5 44
Paraffin mp 53-57 °C 2.398 0.9796 16.7 32
Paraffin oil + paraffin mp 53-57 °C 1.782 0.4966 53.5 33
Paraffin mp 70-80 ºC 2.947 1.2780 15.8 32
Lanolin wax 0.913 0.3168 106.3 32
Carnauba wax 2.507 0.5896 108.4 38
Pentaerythritol ester of lanolin 2.515 0.8669 32.0 32
Carnauba wax + 10% kaolin 2.616 0.8609 18.6 32
Carnauba wax + 20% kaolin 2.070 0.5694 39.8 33
Carnauba wax + 30% kaolin 3.137 1.0290 39.4 32
Bees wax 2.700 0.9360 34.7 28
Bees wax + 20% kaolin 3.736 2.4467 35.6 27
Bees wax + 20% Chinese talc 4.365 4.0805 36.9 30
Stearin 2.169 0.7059 9.7 18
Stearin + 20% kaolin 4.709 4.4550 21.7 47
Stearin + 20% Chinese talc 4.280 4.3971 12.1 45
aStandard error obtained from SigmaPlot software; bcalculated from the differentiation of the pheromone component release curve mass vs. time; ctime in
days until the release rate of the pheromone component was less than 10 mg per day.
Table 8. Calculation of diffusional exponent n for sulcatone, sulcatol and 3-pentanol from release curves for matrices without fillers (in all cases, p < 0.0001)
Matrix n value for sulcatone ± SD n value for sulcatol ± SD n value for 3-pentanol ± SD
Paraffin wax mp 70-80 °C 0.66 ± 0.009a 0.79 ± 0.014a 0.60 ± 0.004a
Paraffin wax mp 53-57 °C 0.63 ± 0.001a 0.84 ± 0.039a 0.66 ± 0.017a
Paraffin oil (60%) + paraffin mp 53-57 °C (40%) 0.57 ± 0.045a 0.72 ± 0.025a 0.65 ± 0.033a
Lanolin pentaerythritol ester 0.44 ± 0.021a,b 0.59 ± 0.003a 0.46 ± 0.014a
Sterarin 0.83 ± 0.007a 0.84 ± 0.001a 0.84 ± 0.021a
Carnauba wax 0.39 ± 0.006b 0.79 ± 0.033a 0.35 ± 0.033b
Bees wax 0.58 ± 0.008a 0.64 ± 0.007a 0.60 ± 0.007a
Lanolin wax 0.39 ± 0.005b 0.52 ± 0.002a 0.42 ± 0.009b
(40%), lanolin pentaerythritol ester, stearin and bees wax matrices, the pheromone component transport occurred by non Fickian diffusion; while in monolithic dispensers made of carnauba wax and lanolin wax, Fickian diffusion mechanism would be responsible for the release of 3-pentanol (Table 8).
The non-Fickian diffusion was the predominant mechanism of transport of the three pheromone components. For mating disruption trials, an approximate Fickian diffusion is more desirable in order to obtain relatively constant pheromone concentrations in the air. In these cases where the active ingredient diffuses continuously from the dispenser to the environment, a non-Fickian diffusion would produce a burst of active ingredient in the air that is useful for the case of a toxic insecticide, but is less useful for a pheromone that is expected to be released in a small amount but at constant rate in time.
Quantitative relationships between the physicochemical parameters and pheromone components release rates
Linear and non linear regressions between the pheromone components initial release rates and matrices viscosity or Shore D hardness were evaluated.
For sulcatol, a hyperbolic regression between the matrix viscosities and their initial release rates Vi, represented
by the expression: Vi = aµ/(b + µ) was found, where µ
is the kinematic viscosity of the matrices and a and b are constants.
Linear regressions between the matrix viscosities and their initial release rates Vi, represented by the mathematical
expression Vi = aµ + b were found for sulcatone and
3-pentanol. In these equations, R2 = 0.8526 for sulcatone,
and R2 = 0.7651 for 3-pentanol.
For the three pheromone components, the same type of exponential equation that shows the existing relationships between the matrices hardness and Vi represented by
Vi = aebD, was found. In this expression, D is the matrices
Shore D hardness and a and b are constants.
Initial release rates increased considerably with the increment of matrices viscosities, bringing out the important effect of viscosity in the pheromone release.18
Also, it was noticed that as hardness of matrices increases, release rates of sulcatone, sulcatol and 3-pentanol were higher, and lower release rates were obtained with matrices with lower hardness value. This effect is opposite to that described in other studies,2,20 where the increase in stiffness
would prevent the reorientation of polymer chains for the diffusion of the component. In this work, harder matrices were more fragile and brittle than softer matrices, and
produced cracks in the dispensers that could be responsible for the grater diffusion of pheromone component to the environment.
Some authors obtained different values of release rates, release kinetics, duration time and types of diffusion (Fickian or non Fickian diffusion) with diverse polymeric dispensers formulated for the controlled release of pheromones and got a good performance in the pest management of several insects. For instance, Atterholt et al.21 measured pheromone
release-rates from paraffin wax and emulsions in laboratory flow cell experiments. Pheromone release from paraffin was partitioned-controlled where the drug being released had a high solubility in the polymeric delivery device and low partition coefficient between the polymer and the surrounding medium, providing a constant (zero-order) release rate. The paraffin’s emulsions primarily consisted of 30% paraffin and 4% pheromone, and they achieved a constant release rate of the pheromone for more than 100 days at 27 ºC, with release rates ranging from 0.4 to 2 mg per day. Shailaja et al.4 prepared plasticized (vinyl
chloride) dispensers loaded with a fixed concentration of gossyplure pheromone by a solution casting. The dispensers obeyed Fick’s law diffusion and released gossyplure at reasonable controlled rate even after 30 days. Cork et al.22
developed a polyvinyl chloride-resin-controlled release formulation for pheromones and used it in mating disruption of yellow rice stem borer, Scirpophaga incertulas obtaining
a significant reduction in damage. The formulation was ideally suited for the release of 14-carbon acetates and 16-carbon aldehydes with typical field lives of 70-100 days and with half lives of 5.4 and 39.1 at 27 ºC after evaluations in a wind tunnel. They also found that depletion of pheromone components from the polyvinyl chloride-resin formulations was characterized by the exponential equation y = ae-bt, where y is the pheromone percent remaining, t
is the time (days), e is the base natural of logarithms, and a and b are constants. Tiboni et al.23 used silica porous
glass as an insect pheromone dispenser and impregnated this material with different kind of insect’s pheromones. They evaluated these silica porous glass dispensers in field obtaining good results, releasing a concentration of active agent of approximately 20 µg per day during 20 days.
Also, they found that release ratios of pheromones can be optimized for different crop areas, varying the previously impregnated pheromone amount in the dispenser.
Mating disruption field trials
point of the mixtures of matrices + fillers + pheromones to prevent melting during summer temperatures or washed away by heavy rains. For sulcatol and 3-pentanol, carnauba wax mixed with 30%m/m of kaolin was selected, and for sulcatone, paraffin mp 70-80 °C + 30%m/m kaolin was
used. These selected dispensers showed high initial release rates that remained relatively high until 12-15 days and exhibited the required resistance to heavy rains. Optimal dispensers according to their release rates were selected and deployed in a commercial poplar plantation in Buenos Aires, Argentina during the flight season of M. mutatus.
Damage levels before and after treatment in control and treated plots were compared. In control plot, despite field observations that showed a small-scale increase in the damage level measured as MG and AG, no significant differences were observed before and after treatment (MG: t = −1.74; d.f. (degrees of freedom) = 13; P = 0.1; AG: t = −1.38; d.f. = 13; P = 0.18). However, in both treated plots, a reduction in attack level after pheromone treatment expressed as the mean number of MG (Lot1: t = 3.22; d.f. = 13; P = 0.006; Lot2: t = 2.78; d.f. = 13; P = 0.01) and AG (Lot1: t = 2.24; d.f. = 13; P = 0.04; Lot2: t = 2.22; d.f. = 13; P = 0.04) was observed (Figures 2and3).
After the experiment, the number of mating and active galleries was slightly increased in control plots and decreased in treated plots. These results confirmed the previous findings with polymeric dispensers of zero order kinetics9 that the strategy of mating disruption using the
pheromone delivery doses is a feasible tool for management of infested poplar plantations.
The population level of the beetle affects the success of mating disruption.24 In the present work, the initial density
was 1-2 attacks per tree, which is low, and reductions of
damage levels of 40% were obtained. Also, in the treatment of several lepidopteran insects the efficacy of different types
of formulations with pheromones was highly dependent on insect population density.25-28
Synthetic pheromones of M. mutatus are not expensive
to produce but the application process is labor intensive. Also, it is critical to have an effective monitoring schedule to detect the beginning of the flying period with pheromone-baited traps in order to maximize the benefit-cost ratio of the control treatment. Overall, the costs of mating disruption treatments are affordable considering the increasing market prices of poplar timber in Argentina, where damage affects commercially important poplar and hazelnut plantations.
Conclusions
In the solid monolithic dispensers developed in this work, matrix hardness and viscosity, and fillers particle size were mostly responsible for the varied patterns in pheromone component release curves, showing different initial release rates according to different affinities between the molecules and the matrices.
Variation in the parameters values ofVi, t and diffusion
in monolithic dispensers in accordance to the pheromone component and the type of matrix depend on the degree on how the pheromone component molecule is attached or bonded to the matrix surface.
The physicochemical parameters that influence the release of pheromone components from the half-sphere shaped wax monolithic dispensers can be modulated as required by the geographical and/or meteorological conditions of the field, as well as according to the insect biology or the purpose of the field trial.
Efficient controlled-release systems are essential to deliver behaviorally relevant aerial concentrations of sex pheromones for both monitoring and mating disruption purposes in the field. The use of natural materials for dispensers has many advantages from an environmental
Figure 2. Results of field trials expressed in active galleries (AG) damage before and after pheromone treatment with monolithic dispensers. Means followed by the same letter are not significantly different (α = 0.05).
perspective and also, dispensers deployed in the field do not require additional work to ultimately dispose them after the treatment.
Supplementary Information
Supplementary information with pictures of the dispensers, the assemblage of experiments in the field and the damages caused by M. mutatus is available free of
charge at http://jbcs.sbq.org.br as PDF file.
Acknowledgments
This work was supported by the Agencia Nacional de Promoción Científica y Técnica (PICT 2010-305), MinAgri (SAFO I-103) and CONICET (Argentina).
References
1. Kydonieus, A. F.; Beroza, M.; Insect Suppression with Controlled Release Pheromone Systems, 1st ed.; CRC Press: Boca Raton, USA, 1982, ch. 3.
2. Kydonieus,A. F.; Controlled Release Technologies: Methods, Theory, and Applications, 1st ed.; Kydonieus,A. F., ed.; CRC Press:Boca Raton, USA, 1980, ch. 2.
3. Ritger, P. L.; Peppas, N. A.; J. Controlled Release1987, 5, 23. 4. Shailaja, D.; Merajuddin, A. S.; Yassen,M.; J. Appl. Polym. Sci.
1997, 64, 1373.
5. Heuskin, S.; Verheggen, F. J.; Haubruge, E.; Wathelet, J.; Lognay, G.; Biotechnol., Agron., Soc. Environ. 2011, 15, 459. 6. Stipanovic, A. J.; Henessy, P. J.; Webster, F. X.; Takahashi, Y.;
J. Agric. Food Chem. 2004, 52, 2301.
7. Gatti Liguori, P.; Zerba, E.; Alzogaray, R.; González Audino, P.; J. Chem. Ecol. 2008, 34, 1446.
8. Girardi, G. S.; Giménez, R. A.; Braga, M. R.; Neotrop. Entomol. 2006,35, 864.
9. Funes, H.; Griffo, R.; Zerba, E.; González Audino, P.; Entomol. Exp. Appl. 2011, 139, 226.
10. Tojo, K.; J. Pharm. Sci. 1985, 74, 685.
11. Funes, H.; Zerba, E.; González Audino, P.; Agric. Forest Entomol.2015, 18, 52.
12. ASTM D445: Standard Test Method for Kinematic Viscosity of Transparent and Opaque Liquids (and Calculation of Dynamic
Viscosity; American Society for Testing and Materials: West Conshohocken, USA, 2006.
13. ASTM D2240-05: Standard Test Method for Rubber Property-Durometer Hardness; American Society for Testing and Materials: West Conshohocken, USA, 2010.
14. Santoro, F. H.; Rev. Invest. For. 1962, 3, 25. 15. Santoro, F. H.; Rev. Invest. For. 1963, 4, 47.
16. Harris, J. M.; Poly (Ethylene Glycol) Chemistry, Biotechnical and Biomedical Applications, 1st ed.; Harris, J. M., ed.; Plenum Press: New York, USA, 1992, ch.1.
17. Kerton, F.; Marriott, R.; Alternative Solvents for Green Chemistry, 2nd ed.; The Royal Society of Chemistry: Cambridge, United Kingdom, 2013.
18. Kung, H. Y.; Effects of Molecular Weight, Polydispersity and Solution Viscosity of Cellulose Acetate Butyrate on
Properties and Release Characteristics of Ascorbyl Palmitate
Microcapsules; University of Rhode Island: Kingston, 1997, p. 78.
19. De Kee, D.; Liu, Q.; Hinestroza, J.; Can J. Chem. Eng. 2005, 83, 913.
20. Akelah, A.; Functionalized Polymeric Materials in Agriculture and the Food Industry; Springer: New York, USA, 2013, ch. 1. 21. Atterholt, C. A.; Delwiche, M. J.; Rice, R. E.; Krochta, J. M.;
J. Controlled Release1998, 57, 233.
22. Cork, A.; de Souza, D. R.; Hall, O. T.; Jones, E.; Casagrande, E.; Krishnaiah, K.; Syed,Z.; Crop Prot. 2008, 27, 248. 23. Tiboni, A.; Coracini, M. D. A.; Lima, E. R.; Zarbin, P. H. G.;
Zarbin, A.; J. Braz. Chem. Soc. 2008, 19, 1634.
24. Howell, J. F.; Knight, A. L.; Unruh, T. R.; Brown, D. F.; Krysan, J. L.; Sell, C. R.; Kirsch, P. A.; J. Econ. Entomol.1992, 58, 918. 25. Stelinski, L. L.; Mc Ghee, P.; Grieshop, M.; Brunner, J.; Gut,
L. J.; Agr. Forest Entomol.2008, 10, 389.
26. Vickers, R. A.; Rothschild, G. H. L.; Tortricid Pest: Their Biology, Natural Enemies and Control, 1st ed.; van der Geest, L. P. S.; Evenhuis, H. H., eds.; Elsevier: New York, USA, 1991. 27. Trimble, R. M.; Can. Entomol.1995, 127, 493.
28. Schmitz, V.; Roehrich, R.; Stockel,J.; J. Appl. Entomol.1995, 199, 303.
Submitted: January 10, 2016