Article
J. Braz. Chem. Soc., Vol. 22, No. 8, 1549-1558, 2011. Printed in Brazil - ©2011 Sociedade Brasileira de Química
0103 - 5053 $6.00+0.00
A
*e-mail: [email protected]
A Multi-Walled Carbon Nanotube-Modiied Glassy Carbon Electrode as a
New Sensor for the Sensitive Simultaneous Determination of Paracetamol and
Tramadol in Pharmaceutical Preparations and Biological Fluids
Ali Babaei,*,a,b Ali Reza Taheria and Mohammad Afrasiabic
aDepartment of Chemistry and bResearch Center for Nanotechnology,
University of Arak, P.O. Box 38156-879 Arak, Iran
cIslamic Azad University, Shoushtar Branch, Young Researchers Club, Shoushtar, Iran
Um eletrodo modiicado quimicamente foi construído, baseado em eletrodo de carbono vítreo modiicado por nanotubos de carbono de parede múltipla (MWCNTs/GCE). Demonstrou-se que este sensor pode ser usado para a determinação simultânea de compostos com importância farmacêutica, como o paracetamol (PAR) e o tramadol (TRA). As medidas foram realizadas com aplicação de voltametria de pulso diferencial (DPV), voltametria cíclica (CV) e cronoamperometria (CA). A aplicação do método DPV demonstrou que em tampão fosfato (pH 7,5) há uma relação linear entre a corrente de pico de oxidação e a concentração de PAR no intervalo entre 0,5 μmol L-1 e 210 μmol L-1. Uma correlação linear semelhante, entre a corrente de pico de oxidação e a concentração, foi observada para TRA no intervalo de 2 μmol L-1 a 300 μmol L-1. Sob condições ótimas, o eletrodo modiicado exibiu alta sensibilidade, seletividade e estabilidade para a determinação de ambos, PAR e TRA, tornando este, um sensor adequado para a detecção submicromolar simultânea de PAR e TRA, em soluções. O desempenho analítico deste sensor foi avaliado para detecção de PAR e TRA em soro e urina humanos e em algumas preparações farmacêuticas, com resultados satisfatórios.
A chemically modiied electrode was constructed based on a multi-walled carbon nanotube-modiied glassy carbon electrode (MWCNTs/GCE). It was demonstrated that this sensor can be used for the simultaneous determination of the pharmaceutically important compounds paracetamol (PAR) and tramadol (TRA). The measurements were carried out by the application of differential pulse voltammetry (DPV), cyclic voltammetry (CV) and chronoamperometry (CA) methods. Application of the DPV method demonstrated that in phosphate buffer (pH 7.5) there was a linear relationship between the oxidation peak current and the concentration of PAR over the range 0.5 μmol L-1 to 210 μmol L-1. A similar linear correlation between oxidation peak current and concentration was observed for TRA over the range of 2 μmol L-1 to 300 μmol L-1. Under optimal conditions the modiied electrode exhibited high sensitivity, selectivity and stability for both PAR and TRA determination, making it a suitable sensor for the simultaneous submicromolar detection of PAR and TRA in solutions. The analytical performance of this sensor has been evaluated for detection of PAR and TRA in human serum, human urine and some pharmaceutical preparations with satisfactory results.
Keywords: paracetamol, tramadol, carbon nanotube, modiied glassy carbon, electrochemical sensor
Introduction
Carbon nanotubes (CNT) are a form of carbon1,2
that, because of their physicochemical features, large surface area, high chemical stability, outstanding bio-compatibility, high conductance, good tensile strength, high catalytic capability and fast electron transfer rate,
have been recognized as one of the almost quintessential nano-materials.3,4
Paracetamol (PAR) (acetaminophen, N-acetyl-p-aminophenol) is a widely used analgesic antipyretic drug that has actions similar to aspirin. It represents a suitable alternative for the patients who are sensitive to aspirin and is a major ingredient in numerous cold and influenza medications.5 While safe up to therapeutic
metabolites, which may cause severe and sometimes fatal hepatoxicity and nephrotoxicity.6 Large doses, chronic
use or concomitant use with alcohol or other drugs can also cause skin rashes, inflammation of the pancreas and liver disorders.7 The product of the hydrolytic
degradation of paracetamol (4-aminophenol) can be present in pharmaceutical preparations as a degradation product of paracetamol or as a synthetic intermediate. It can be dangerous and cause teratogenic effects and nephrotoxicity.8
Tramadol (TRA) is a centrally acting analgesic that was irst introduced in Germany in 1977. Today it has become the most prescribed opioid worldwide.9 It is generally
said to be devoid of many of the serious adverse effects of traditional opioid receptor agonists such as the risk for respiratory depression10 and drug dependence.11 Based
on this, in contrast to other opioids, the abuse potential of tramadol is considered to be either low or absent.9,12
Hence, tramadol is the only clinically available non-scheduled opioid.13 However recently reported results of
post-marketing surveillance and case reports14 have shown
that tramadol abuse and tramadol related fatalities have been noted. Its overall analgesic eficacy is comparable to that achieved using equianalgesic doses of morphine or alfentanil.15
The analgesic eficiency of TRA can be enhanced by combination with a non-opoid analgesic such as PAR.16
This combination is also used in patients when it is not possible to prescribe a nonsteroid anti-inlammatory, prior to treatment with potent opioids, and to spare the secondary effects of codeine may occur with high doses or in extended treatments.17 Because of their effectiveness and security,
synergistic pharmaceutical formulations of PAR and TRA (e.g. 325 mg of PAR with 37.5 mg of TRA) are commonly used in the pain treatment. Consequently the determination of the levels of these compounds present in pharmaceuticals in order to prevent overdoses leading to toxic effects is of considerable importance.
A number of quantitative analytical methods have been reported for PAR determination in pharmaceutical formulations and biological samples, individually or associated to other active compounds. These include capillary electrophoresis,18 fluorimetry,19 titrimetry,20
low injection analysis (FIA) (using different methods of detection),21 liquid chromatography,22 spectrophotometry,23
spectrofluorometry24 and chemiluminescence.25 For
the determination of Tramadol itself, fewer analytical methodologies have been proposed. These are mainly based on high performance liquid chromatography (HPLC) coupled to different detectors,26 UV,27 fluorescence,28
electrochemical,29 capillary isotachophoresis,30 capillary
gas chromatography,31 gas chromatography,32 gas
c h r o m a t o g r a p h y - m a s s s p e c t r o m e t r y,3 3 l i q u i d
chromatography-mass spectrometry (LC-MS)34
capillary electrophoresis,35 high performance thin layer
chromatography (HPTLC),36 spectrophotometry37 and
spectrofluorometry.38 In spite of the large number of
published reports on the individual determination of PAR or TRA, there have been only a few reports of the simultaneous determination of PAR and TRA. These have involved a high performance liquid chromatography-electrospray ionization-mass spectrometric (LC-ESI-MS) and spectrophotometric methods.39,40 However these
methods suffer from disadvantages such as, long analysis time, high costs and requirement for sample pretreatment which is time consuming, making them unsuitable for routine analysis. For these reasons, development of a simple, inexpensive, sensitive and accurate analytical method for simultaneous determination of PAR and TRA would be of considerable value.
Both PAR and TRA are electroactive compounds and can be oxidized electrochemically. To the best of our knowledge, there is only one report in the literature of simultaneous electrochemical studies of PAR and TRA.41
This method used (rather expensive) carbon nanoparticles with surface immobilized phenyl sulfonic acid groups as a modifier for GCE. The method still needs to be improved with respect to its analytical igures of merit. The electrochemical method still has its own advantages; however its improvement is of considerable importance. We have chosen to do this by using different modiiers for glassy carbon electrode.
In this work we outline the use of a multi-walled carbon nanotube modiied glassy carbon electrode (MWCNTs/ GCE) as a sensor for simultaneous determination of PAR and TRA. Our study has led to the development of a voltammetric method with useful characteristics as simplicity of electrode preparation by the use of lower cost material, low limit of detection (LOD) and wide linear dynamic range (LDR). To conirm its usefulness, the analytical performance of our sensor for determination of PAR and TRA in human serum, human urine and in actual pharmaceutical preparation samples is evaluated.
Experimental
Reagents and solutions
5-20 nm) were purchased from PlasmaChem GmbH company. Stock standard solutions of 10 mmol L-1 PAR
and 10 mmol L-1 TRA were freshly prepared in 0.1 mol L-1
phosphate buffers of pH 7.5. All PAR and TRA solutions were prepared by diluting the stock standard solutions using 0.1 mol L-1 phosphate buffer (pH 7.5). Buffer solutions
used in voltammetric studies were prepared as described elsewhere.42 Electrochemical experiments on PAR and TRA
were carried out in 0.1 mol L-1 PBS at pH 7.5.
Fresh human serum samples were available from Razi Institute of Vaccine and Serum Company (Tehran, Iran). Serum and urine samples were iltered and diluted 20 times using a 0.1 mol L-1 PBS of pH 7.5, and checked
for the determination of the recovery after spiking of PAR and TRA. Ten tablets of ZAFIN® (Laboratorio Saval S.A.,
Santiago, Chile), labeled as each being of average weight 459.8 mg and containing nominally 325.0 mg of PAR and 37.5 mg of TRA plus some ingredients like corn starch, hypromellose, lactose, magnesium stearate, polyethylene glycol, polysorbate 80 and sodium glycolate, were accurately weighed and powdered in a mortar. A weight equivalent to one tablet content was dissolved in 70 mL of 0.1 mol L-1 PBS (pH 7.5). After 10 min sonication, the
solutions were iltered through Whatman No. 42 ilter paper (Whatman, Middlesex, UK). The residue was washed three times with 10 mL of the appropriate solvent and the volume was adjusted to 100 mL using the same solvent. Finally, this solution was diluted 250 times using a 0.1 mol L-1 PBS of
pH 7.5 and applied for the determination of the recovery in spiking of PAR and TRA compounds.
Instrumentation
All the voltammetric measurements were carried out using our nanotube-modified glassy carbon electrode (MWCNTs/GCE) as the working electrode, Ag/AgCl 3 mol L-1 KCl as the reference electrode and platinum wire
as an auxiliary electrode. Differential pulse voltammetry (DPV), cyclic voltammetry (CV) and chronoamperometry (CA) experiments were carried out using an Autolab PGSTAT 30 Potentiostat Galvanostat (EcoChemie, The Netherlands) coupled with a 663 VA stand (Metrohm Switzerland). All potentials given are with respect to the potential of the reference electrode. The pH measurements were performed with a Metrohm 744 pH meter using a combination glass electrode.
Modiication of the glassy carbon electrode
The glassy carbon electrode (GCE, 2-mm diameter, Metrohm) was first polished with 0.3 and 0.05 μm
aluminum slurry and rinsed thoroughly with triply distilled water. It was then cleaned by sonication for 5 min, irst in ethanol and then distilled water, and then dried under a nitrogen gas low.
Variation of concentration of MWCNTs in DMF solution and volume of the suspension of MWCNTs/ DMF for drop coating of the GCE, showed that the best sensitivity for the modiied electrode could be obtained when concentration of 1 mg mL-1 and volume of 20 μL of
MWCNTs/DMF were used. A stock solution of MWCNTs-DMF was prepared by dispersing 1 mg of MWNTs in 1 mL DMF using ultrasonic bath. Approximately 20 μL of this MWCNTs-DMF solution were coated on to the electrode surface. The electrode were then dried at room temperature to obtain the modiied electrode.
This produced MWCNTs/GCE was placed in the electrochemical cell containing 0.1mol L-1 PBS and
several cycles in the potential windows of 0.1 to 1 V were performed using the CV method to obtain stable responses.
General procedure
10 mL solutions containing appropriate amounts of PAR and TRA in 0.1 mol L-1 PBS at pH 7.5 were
transferred into the voltammetric cell. The voltammograms were recorded by applying positive-going potential from 0 to 0.9 V. The voltammograms showed anodic peaks around 0.32 and 0.62 V corresponding to the PAR and TRA compounds with their heights being proportional to their concentrations in the solutions. Calibration curves were obtained by plotting the anodic peak currents of PAR and TRA against the corresponding concentrations. All experiments were carried out under open circuit conditions.
After each measurement, the MWCNTs/GCE was regenerated by thoroughly washing the electrode with triply distilled water and then 5% sodium hydroxide solution. The electrode was inally rinsed carefully with distilled water to remove all adsorbates from electrode surface and provide a fresh surface for next experiment.
Results and Discussion
Scanning electron microscopy (SEM) analysis of MWCNTs/ GCE
Effect of modiication of the electrodes on the effective area
The MWCNTs/GC modiied electrode was characterized by electrochemical methods.
K3Fe(CN)6 exhibited a pair of quite reversible redox
peaks at a bare GC electrode. At the modiied electrode, a pair of higher and reversible redox peaks could still be observed. On the other hand, under the same conditions, the anodic peak of K3Fe(CN)6 at both the GC and MWCNTs/
GC electrodes increased in proportion to the square root of the scan rate. It was found that in both cases the electrode process was diffusion controlled. The regression equations for the 4 mmol L-1 K
3Fe(CN)6 were:
Ipa(µA) = 92.57ν1/2 (V s-1)1/2 + 8.440 (R2 = 0.995) GC
Ipa(µA) = 904.53ν1/2 (V s-1)1/2 + 7.267 (R2 = 0.999)
MWCNTs/GC
A reversible system should satisfy the Randles-Sevcik equation:43
IP = 2.9 × 10⁵α1/2n3/2 AC0DR1/2ν1/2
According to the ratio of the slopes of the two lines, the apparent area of the MWNTs/GC modified electrode was about 9.8 times greater than that of the GC electrode.
Electrochemical behavior of PAR and TRA on MWCNTs/ GCE
Cyclic voltammograms were recorded for 40 μmol L-1
PAR and 100 μmol L-1 TRA at MWCNTs/GCE and are
shown in Figure 2. PAR, unlike TRA, showed a reversible oxidation which can be related to electrocatalytic behavior of MWCNTs. The effect of potential scan rate on the
oxidation responses of PAR and TRA over the 10-800 mVs-1
range of scan rate was investigated. The linear relationships between the anodic peak currents and scan rates were observed for both in the range of 10-200 mVs-1 as follow:
Ipa(µA) = 0.4566ν (mV s-1) + 1.113 (R2 = 0.9955) PAR
Ipa(µA) = 0.3846ν (mV s-1) + 1.421 (R2 = 0.9968) TRA
The linear relationship between peak currents and scan rates suggests that the redox reactions of both the PAR and TRA compounds at MWCNTs/GCE are adsorption-controlled processes.
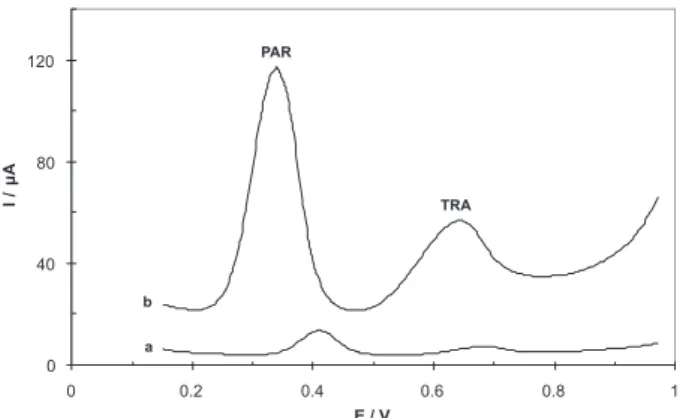
Differential pulse voltammograms recorded for paracetamol and tramadol at a bare GCE, and a MWCNTs/GCE are shown in Figure 3. Curve a shows the voltammogram of a solution of 140 µmol L-1 of PAR, and
170 µmol L-1 of TRA in PBS (pH 7.5) on a GC electrode.
Curve b displays a voltammogram of PAR and TRA under the same conditions as a, on a MWCNTs/GCE electrode. It can be seen very small oxidation peaks for PAR and TRA at GC. The DPVs of PAR and TRA at MWCNTs/GCE (curve b) showed a considerable enhancement of the oxidation peak currents for both the PAR and TRA oxidations. The presence of MWCNTs can increase the electrode surface area and therefore account for the enhancements in the corresponding electrochemical oxidation peak currents observed.
Effects of solution pH
The effect of solution pH on the electrochemical response of the MWCNTs/GCE towards PAR and TRA in the simultaneous determination of 30 µmol L-1 PAR
and 100 µmol L-1 TRA was investigated using DPV
method. Variations of peak current with respect to pH of Figure 1. SEM image of MWCNTs ilm on a GCE.
Figure 2. Cyclic voltammograms of 40 μmol L-1 PAR and 100 μmol L-1
TRA at GCE (dotted line) and MWCNTs/GCE (solid line) in 0.1 mol L-1
the electrolyte in the pH range from 4 to 10 are shown in Figure 4. It can be seen that the anodic peak currents of PAR increase with solution pH until the pH reaches 7. However at higher pHs the PAR oxidation peak current starts to diminish. The oxidation peak current for TRA also increases with pH but only starts to fall down from a pH of 8. A pH value of 7.5, which is close to biological pH value, was chosen as an optimum solution pH for further experiments.
Effect of accumulation time
Figure 5 shows plots of the anodic peak currents, obtained from DPV experiments, against accumulation time for solutions that are 40 μmol L-1 in PAR and
150 μmol L-1 in TRA. Initially, the peak current for TRA
increases with accumulation time up to 40 s, but after 40 s of accumulation time, the peak current forms plateaus. For PAR, the corresponding oxidation peak current increases up to 50 s before leveling off. The accumulation
time of 50 s was chosen as an optimum time for further experiments.
Linear dynamic range and limit of detection of the method
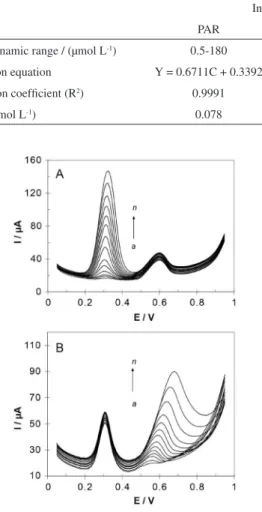
Regarding the complete resolution of differential voltammetric responses of PAR and TRA, the modiied electrode successfully applied for the individual determination of PAR in the presence of TRA (Figure 6A) and individual determination of TRA in the presence of PAR (Figure 6B). The electrochemical responses of simultaneous additions of solutions of PAR and TRA in 0.1 mol L-1 PBS pH 7.5 using MWCNTs/GCE are depicted
in Figures 7 and 8. Figure 7 shows differential pulse voltammograms and the corresponding calibration curves obtained for various concentrations of PAR and TRA at MWCNTs/GCE. For PAR, a linear dynamic range from 0.5 μmol L-1 to 210 μmol L-1, with a calibration equation
of Ip(μA) = 0.6624c (µmol L-1) + 3.3392 (R2 = 0.9984),
and a limit of detection (LOD) of 0.085 μmol L-1 (S/N = 3)
were obtained. For TRA, a linear relationship was found over the range of 2 to 300 μmol L-1 with a calibration
equation of Ip(μA) = 0.1623c (µmol L-1) + 0.5911
(R2 = 0.9978), and a limit of detection of 0.361 μmol L-1.
The characteristics of the calibration curves of PAR and TRA in individual and mixture solutions are presented in Table 1. The investigations showed that these linear ranges were kept in mixture solutions of PAR and TRA, revealing high eficiency of the prepared modiied electrode for determinations in pharmaceutical samples of these drugs.
Figure 8 displays a chronoamperogram of the response of a rotated modiied electrode (2500 rpm) following the successive injection of PAR and TRA at an applied potential of 0.75 V in PBS (pH 7.5). For PAR, the linear dynamic range was from 8 μmol L-1 to 600 μmol L-1, with
a calibration equation of Ip(μA) = 0.3364c (µmol L-1) +
Figure 3. Differential pulse voltammograms of 140 µmol L-1 of PAR
and 170 µmol L-1 TRA at (a) GC and (b) MWCNTs/GCE in 0.1 mol L-1
phosphate buffer solution (pH 7.5). Other conditions: Open circuit, tacc= 50 s, pulse amplitude = 50 mV, scan rate = 10 mV s−1, interval time
0.5 s, modulation time = 0.2 s and step potential = 5 mV.
Figure 4. Effect of pH on the differential pulse voltammogram peak currents of oxidations of 30 μmol L-1 PAR and 100 μmol L-1 TRA
compounds at MWCNTs/GCE in 0.1mol L-1 phosphate buffer solutions.
Figure 5. Effect of accumulation time on the differential pulse voltammogram peak currents of 40 μmol L-1 PAR and 150 μmol L-1 TRA
0.055 (R2 = 0.9996). A limit of detection of 0.148 μmol L-1
(S/N = 3) was obtained. For TRA, the linear relationship was in the range of 10 to 500 μmol L-1 with a calibration
equation of Ip(μA) = 0.2138c (µmol L-1) + 2.7479
(R2 = 0.9953). For this compound a limit of detection of
0.546 μmol L-1 was obtained.
Repeatability and long-term stability of the electrode
The repeatability of the analytical signals were studied and relative standard deviations (RSD) of 0.66 and 0.98% for 70 μmol L-1 PAR and 90 μmol L-1 TRA respectively, in
ten consecutive determinations, were obtained.
The proposed modified electrode has a further attraction of good long-term stability. This was tested by measuring the decrease in voltammetric current during repetitive DPV measurements of PAR and TRA solutions with MWCNTs/GCE stored in solution or air for certain period of time. For example, in the determination of 50 μmol L-1 PAR and 150 μmol L-1 TRA in 0.1 mol L-1 PBS
(pH 7.5), when the modiied electrode was subjected to an experiment every 30 min, after 24 h gave less than 10.8 and 9.1% decrease in the voltammetric currents of PAR and TRA, respectively. When the electrode was stored in Table 1. The characteristics of the calibration curves of PAR and TRA in individual and mixture solutions
Drugs Individual Mixture
PAR TRA PAR TRA
Linear dynamic range / (μmol L-1) 0.5-180 5-300 0.5-210 2-300
Calibration equation Y = 0.6711C + 0.3392 Y = 0.1722 C + 0.611 Y = 0.6624X + 3.3392 Y = 0.1623X + 0.5911
Correlation coeficient (R2) 0.9991 0.9997 0.9984 0.9987
LOD / (μmol L-1) 0.078 0.354 0.085 0.361
Figure 6. DPVs for (A) solutions containing 120 μmol L-1 TRA and various
concentrations of PAR: (a) 0.5, (b) 2, (c) 4, (d) 8, (e) 15, (f) 25, (g) 45, (h) 65, (i) 85, (j) 105, (k) 120, (l) 140, (m) 160, (n) 180 and (B) solutions containing 45 μmol L-1 PAR and various concentrations of TRA: (a) 5,
(b) 10, (c) 25, (d) 40, (e) 55, (f) 70, (g) 90, (h) 110, (i) 130, (j) 150, (k) 170, (l) 210, (m) 250, (n) 300, in buffer solutions of pH 7.5.
Figure 7. Differential pulse voltammograms for different concentrations of PAR and TRA mixture as (a) 0.5 + 2, (b) 2 + 5, (c) 4 + 10, (d) 8 + 25, (e) 15 + 40, (f) 25 + 55, (g) 45 + 70, (h) 65 + 90, (i) 85 + 110, (j) 105 + 130, (k) 120 + 150, (l) 140 + 170, (m) 160 + 210, (n) 180 + 250 and (o) 210 + 300, respectively, in which the irst value is the concentration of PAR in μmol L-1 and the second value is the concentration of TRA in μmol L-1.
Insets: (A) Plot of peak currents as a function of PAR concentration. (B) Plot of the peak currents as a function of TRA concentration.
Figure 8. Hydrodynamic amperometric response at rotating mol L-1
WCNTs/GCE (rotating speed 2500 rpm) held at 0.75 V in PBS (pH 7.5) for simultaneous determination of PAR and TRA by successive additions of (a) 50 μmol L-1 PAR and (b) 50 μmol L-1 TRA. Insets: (A) successive
additions of (c) 8 μmol L-1 PAR and (d) 10 μmol L-1 TRA; (B) Plot of
the atmosphere for 7 days, the currents response of PAR and TRA reduced less than 12.1 and 10.8%, respectively when the electrode subjected to a solution of the same composition.
Interference studies
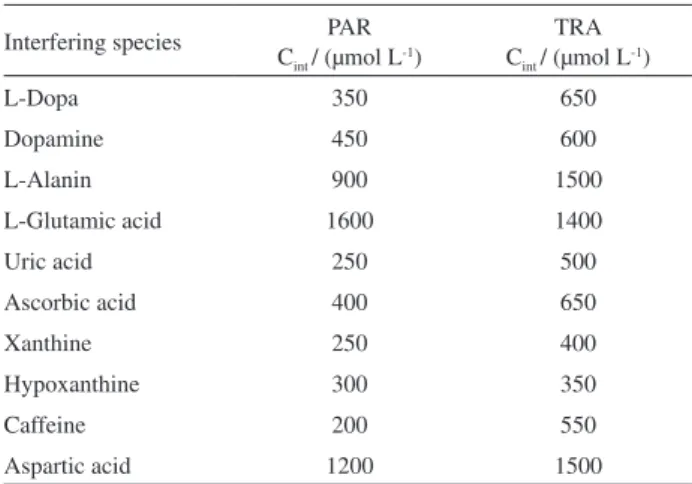
The inluences of common interfering species in the presence of 50 µmol L-1 PAR and 50 µmol L-1 TRA under
optimum conditions were investigated, and the results conirmed that interfering species did not signiicantly inluence the height of the peak currents for PAR and TRA. The tolerance limits (deined as the concentrations which give an error ≤ 10%) for some of the most common interfering agents are shown in Table 2. The data in brackets are concentrations of the interfering species in µmol L-1. They show that the proposed method is free
from interferences of the most common interfering agents.
Analytical applications
The applicability of a MWCNTs/GC electrode to the determination of PAR and TRA in human serum, human urine and drug samples was examined. Differential pulse voltammograms were obtained by spiking prepared real solutions with appropriate samples and using MWCNTs/ GCE at optimum conditions as described earlier to analyse these. Concentrations were measured by applying the calibration plot. The results are shown in Tables 3 to 5. The values shown in parenthesis in Table 5, were obtained using UV-Vis spectroscopy method as previously reported.61 The recoveries indicate that both the accuracy
and repeatability of our proposed method are very good. From above experimental results, it is very clear that this method has great potential for the determination of trace Table 2. Maximum tolerable concentration of interfering species
Interfering species PAR Cint / (μmol L-1)
TRA Cint / (μmol L-1)
L-Dopa 350 650
Dopamine 450 600
L-Alanin 900 1500
L-Glutamic acid 1600 1400
Uric acid 250 500
Ascorbic acid 400 650
Xanthine 250 400
Hypoxanthine 300 350
Caffeine 200 550
Aspartic acid 1200 1500
Cint refers to interfering compound concentration.
Table 3. Determination of PAR and TRA in human serum with MWCNTs/ GCE
Analyte Added / (μmol L-1)
Founda /
(μmol L-1)
RSD / (%)
Recovery / (%)
PAR 0 0 -
-10.0 9.8 2.2 98.3
20.0 19.4 1.8 97.0
30.0 29.5 1.6 98.3
TRA 0 0 -
-20.0 20.7 2.6 103.5
40.0 41.2 2.0 103.0
60.0 58.7 1.8 97.8
aAverage of ive determinations at optimum conditions.
Table 4. Determination of PAR and TRA in urine sample with MWCNTs/ GCE
Analyte Added / (μmol L-1)
Founda /
(μmol L-1)
RSD / (%)
Recovery / (%)
PAR 0 0 -
-10.0 9.9 1.8 99.0
20.0 19.0 1.7 95.0
30.0 29.3 1.6 97.7
TRA 0 0 -
-20.0 19.5 1.7 97.5
40.0 41.1 1.8 102.7
60.0 62.2 1.3 103.6
aAverage of ive determinations at optimum conditions.
Table 5. Determination of PAR and TRA in ZAFIN® tablet with
MWCNTs/GCE
Analyte Added / (μmol L-1)
Founda /
(μmol L-1)
RSD / (%)
Recovery / (%) PAR 0.0 84.7b (84.1)d 1.4 (1.9)d 98.5 (97.8)d
10.0 95.0 (93.8)d 1.9 (1.9)d 103.0 (97.0)d
20.0 104.5 (103.4)d 1.6 (1.8)d 99.0 (96.5)d
TRA 0.0 5.1c (5.0)d 1.3 (1.7)d 101.7 (99.7)d
10.0 15.0 (15.1)d 1.5 (1.6)d 99.0 (101.0)d
20.0 24.8 (24.9)d 2.0 (1.7)d 98.5 (99.5)d aAverage of ive determinations at optimum conditions; bthis amount is
equal to 320.18 mg per tablet; cthis amount is equal to 38.15 mg per tablet; dthe amounts in the parenthesis were obtained using spectrophotometric
method.
amounts of these compounds in biological systems and pharmaceutical preparations.
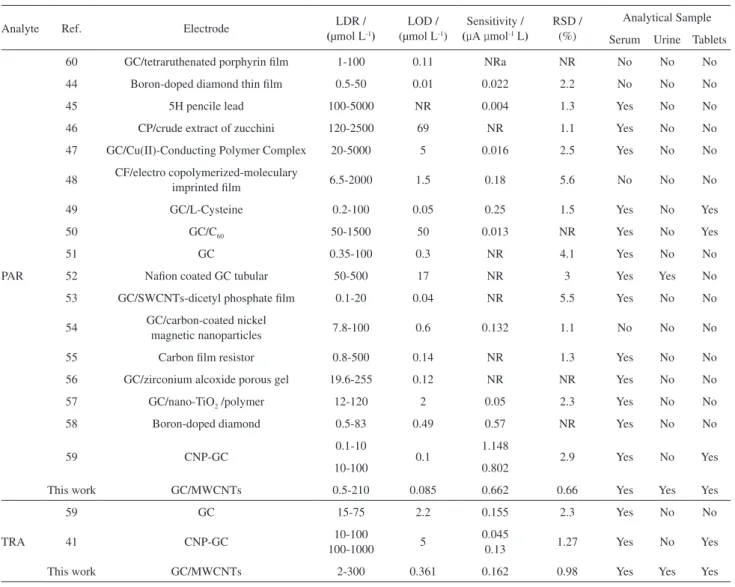
Table 6. Comparisons of various electroanalytical methods proposed for detection of PAR and TRA
Analyte Ref. Electrode LDR /
(μmol L-1)
LOD / (μmol L-1)
Sensitivity /
(µA µmol-1 L)
RSD / (%)
Analytical Sample Serum Urine Tablets
PAR
60 GC/tetraruthenated porphyrin ilm 1-100 0.11 NRa NR No No No
44 Boron-doped diamond thin ilm 0.5-50 0.01 0.022 2.2 No No No
45 5H pencile lead 100-5000 NR 0.004 1.3 Yes No No
46 CP/crude extract of zucchini 120-2500 69 NR 1.1 Yes No No
47 GC/Cu(II)-Conducting Polymer Complex 20-5000 5 0.016 2.5 Yes No No
48 CF/electro copolymerized-moleculary
imprinted ilm 6.5-2000 1.5 0.18 5.6 No No No
49 GC/L-Cysteine 0.2-100 0.05 0.25 1.5 Yes No Yes
50 GC/C60 50-1500 50 0.013 NR Yes No Yes
51 GC 0.35-100 0.3 NR 4.1 Yes No No
52 Naion coated GC tubular 50-500 17 NR 3 Yes Yes No
53 GC/SWCNTs-dicetyl phosphate ilm 0.1-20 0.04 NR 5.5 Yes No No
54 GC/carbon-coated nickel
magnetic nanoparticles 7.8-100 0.6 0.132 1.1 No No No
55 Carbon ilm resistor 0.8-500 0.14 NR 1.3 Yes No No
56 GC/zirconium alcoxide porous gel 19.6-255 0.12 NR NR Yes No No
57 GC/nano-TiO2 /polymer 12-120 2 0.05 2.3 Yes No No
58 Boron-doped diamond 0.5-83 0.49 0.57 NR Yes No No
59 CNP-GC 0.1-10 0.1 1.148 2.9 Yes No Yes
10-100 0.802
This work GC/MWCNTs 0.5-210 0.085 0.662 0.66 Yes Yes Yes
TRA
59 GC 15-75 2.2 0.155 2.3 Yes No No
41 CNP-GC 10-100
100-1000 5
0.045
0.13 1.27 Yes No Yes
This work GC/MWCNTs 2-300 0.361 0.162 0.98 Yes Yes Yes
NR: not reported; GC: glassy carbon; CP: carbon paste; CF: carbon iber; CNP: carbon nano particles.
Conclusions
In this paper we have introduced a simple sensor based on multi-walled carbon nanotube modiied glassy carbon electrode. We have shown that the application of MWCNTs increases anodic peak currents for both paracetamol and tramadol on the electrode surface. The results indicated that the use of MWCNTs/GCEs allows the simultaneous determination of PAR and TRA with good sensitivity and selectivity. The electrode also shows high stability in repetitive experiments. The effects of the potential interferants were studied, and were found to be insigniicant for the most common ones. Use of the proposed sensor for the determination of PAR and TRA not only in some pharmaceutical preparations but also in some real samples such as those containing human serum or urine, gave satisfactory results without the necessity of
sample pretreatments or time-consuming extractions. The simple fabrication procedure, high speed, reproducibility, high stability, wide linear dynamic range, low limit of detection, high sensitivity, suggest that the proposed sensor is an attractive candidate for practical applications.
Acknowledgments
The authors gratefully acknowledge the research council of Arak University for providing inancial support for this work. Thanks to Dr. Alan Happer from Canterbury University in New Zealand for his valuable comments.
References
1. Iijima, S.; Nature1991, 354, 56.
3. Tasis, D.; Tagmatarchis, N.; Bianco, A.; Prato, M.; Chem. Rev.
2006, 106, 1105.
4. Serp, P.; Corrias, M.; Kalck, P.; Appl. Catal., A2003, 253, 337. 5. Sweetman, S. C.; Martindale: The Complete Drug Reference,
33rd ed.; Pharmaceutical Press: London, 2002.
6. Martin, F. L.; McLean, A. E.; Drug Chem. Toxicol. 1998, 21, 477.
7. Prabakar, S. J. R.; Narayanan, S. S.; Talanta2007, 72, 1818. 8. Moffat, A. C.; Clark’s Isolation and Identiication of Drugs, 2nd
ed.; The Pharmaceutical Press: London, 1986.
9. National coorporation of Pharmacies, Sweden (Apoteket AB) Salestatistics 2006.
10. Klotz, U.; Arzneimittelforschung2003, 53, 681.
11. Richter, W.; Barth, H.; Flohe, L.; Giertz, H.; Arzneimittelforschung
1985, 35, 1742.
12. Grond, S.; Sablotzki, A.; Clin. Pharmacokinet. 2004, 43, 879. 13. UN convention; Yellow List: List of Narcotic Drugs under
International Control, UN convention, United Nations: Vienna, Austria, 2004.
14. Epstein, D. H.; Preston, K. L.; Jasinski, D. R.; Biol. Psychol.
2006, 73, 90.
15. Scott, L. J.; Perry, C. M.; Drugs2000, 60, 139. 16. Karen, M.; Lesley, J. S.; Drugs2003, 63, 1079.
17. Kucuk, A.; Kadioglu, Y.; Celebi, F.; J. Chromatogr., B2005, 816, 203
18. Zhao, S.; Bai, W.; Yuan, H.; Xiao, D.; Anal. Chim. Acta2006, 559, 195.
19. Murillo Pulgarín, J. A.; García Bermejo, L. F.; Anal. Chim. Acta
1996, 333, 59.
20. Srivastava, M. K.; Ahmed, S.; Singh, D.; Shukla, I. C.; Analyst
1985, 110, 735.
21. Bloomield, M. S.; Talanta 2002, 58,1301.
22. Ravisankar, S.; Vasudevan, M.; Gandhimathi, M. M.; Suresh, B.; Talanta1998, 46, 1577.
23. Bouhsain, Z.; Garrigues, S.; de la Guardia, M.; Fresenius J. Anal. Chem.1997, 357, 973.
24. Vilchez, J. L.; Blanc, R.; Avidad, R.; Navalon, A.; J. Pharm. Biomed. Anal. 1995,13, 1119.
25. Easwaramoorthy, D.; Yu, Y. C.; Huang, H. J.; Anal. Chim. Acta
2001, 439, 95.
26. Zaghloul, I. Y.; Radwan, M. A.; J. Liq. Chromatogr. Relat. Technol. 1997, 20, 779.
27. Medvedovici, A.; Albu, F.; Farca, A.; David, V.; J. Pharm. Biomed. Anal. 2004, 34, 67.
28. Nobilis, M.; Kopecky, J.; Kvetina, J.; Chladek, J.; Svoboda, Z.; Vorisek, V.; Perlik, F.; Pour, M.; Kunes, J.; J. Chromatogr., A
2002, 949, 11.
29. Valle, M.; Pavon, J. M.; Calvo, R.; Campanero, M. A.; Troconiz, I. F.; J. Chromatogr., B: Biomed. Sci. Appl. 1999, 724, 83. 30. Pospisilova, M.; Polasek, M.; Jokl, V.; J. Pharm. Biomed. Anal.
1998, 18, 777.
31. Ho, S. T.; Wang, J. J.; Liaw, W. J.; Ho, C. M.; Li, J. H.; J. Chromatogr., B: Biomed. Sci. Appl. 1999, 736, 89.
32. Tao, Q.; Stone, D. J. Jr.; Borenstein, M. R.; Jean-Bart, V.; Codd, E. E.; Coogan, T. P.; Desai-Krieger, D.; Liao, S.; Raffa, R. B.; J. Chromatogr., B: Biomed. Sci. Appl.2001, 763, 165. 33. Gambaro, V.; Benvenuti, C.; Ferrari, L.; Dell Acqua, L.; Fare, F.;
Il Farmaco2003, 58, 947.
34. Moore, C.; Marinetti, L.; Coulter, C.; Crompton, K.; Forensic Sci. Int. 2008, 176, 47.
35. Soetebeer, U. B.; Schierenberg, M. O.; Schulz, H.; Grunefeld, G.; Andresen, P.; Blaschke, G.; J. Chromatogr., B: Biomed. Sci. Appl.2000, 745, 271.
36. Venkateshwarlu, K.; Reddy, Y. N.; Srisailam, K.; Rajkumar, V.; Pai, M. G.; Curr. Trends Biotechnol. Pharm.2008, 2, 421. 37. Abdellatef, H. E.; J. Pharm. Biomed. Anal. 2002, 29, 835. 38. Abdellatef, H. E.; El-Henawee, M. M.; El-Sayed, H. M.; Ayad,
M. M.; Spectrochim. Acta, Part A 2006, 65, 1087.
39. Zhu, T.; Ding, L.; Guo, X.; Yang, L.; Wen, A.; Chromatographia
2007, 66, 171.
40. Toral, M. I.; Rivas, J.; Saldias, M.; Soto, C.; Orellana, S.; J. Chil. Chem. Soc. 2008, 53, 1543.
41. Ghorbani-Bidkorbeh, F.; Shahrokhian, S.; Mohammadi, A.; Dinarvand, R.; Electrochim. Acta2010, 55, 2752.
42. Babaei, A.; Zendehdel, M.; Khalilzadeh, B.; Taheri, A. R.; Colloids Surf., B 2008, 66, 226.
43. Bard, A. J.; Faulkner, L. R.; Electrochemical Methods, Fundamentals and Applications, Wiley: New York, 1980. 44. Nattakarn, W.; Orawon, C.; J. Pharm. Biomed. Anal. 2002, 28,
841.
45. Masawat, P.; Liawruangrath, S.; Vaneesorn, Y.; Liawruangrath, B.; Talanta2002, 58, 1221.
46. Vieira, I. C.; Lupetti, K. O.; Fatibello-Filho, O.; Quim. Nova
2003, 26, 39.
47. Boopathi, M.; Won, M. S.; Shim, Y. B.; Anal. Chim. Acta2004, 512, 191.
48. Gomez-Caballero, A.; Goicolea, M. A.; Barrio, R. J.; Analyst
2005, 130, 1012.
49. Wang, C.; Li, C.; Wang, F.; Wang, C.; Microchim. Acta 2006, 155, 365.
50. Goyal, R. N.; Singh, S. P.; Electrochim. Acta 2006, 51, 3008. 51. Messina, G. A.; De Vito, I. E.; Raba, J.; Anal. Chim. Acta2006,
559, 152.
52. Silva, M. L. S.; Garcia, M. B. Q.; Lima, J. L. F. C.; Barrado, E.; Anal. Chim. Acta2006, 573, 383.
53. Sun, D.; Zhang, H.; Microchim. Acta 2007, 158, 131. 54, Wang, S. F.; Xie, F.; Hu, R. F.; Sens. Actuators, B2007, 123,
495.
55. Felix, F. S.; Brett, C. M. A.; Angnes, L.; J. Pharm. Biomed. Anal.2007, 43, 1622.
57. Ashok Kumar, S.; Chun-Fang, T.; Shen-Ming, C.; Talanta2008, 76, 997.
58. Lourencao, B. C.; Medeiros, R. A.; Rocha-Filho, R. C.; Mazo, L. H.; Fatibello-Filho, O.; Talanta2009, 78, 748.
59. Garrido, E. M. P. J.; Garrido, J. M. P. J.; Borges, F.; J. Pharm. Biomed. Anal. 2003, 32, 975.
60. Maria, S.; Quintino, M.; Koiti, A.; Henrique, E.; Lucio, A.; Electroanalysis 2002, 14, 1629.
61. Toral, M. I.; Rivas, J.; Saldias, M.; Soto, C.; Orellana, S.; J. Chil. Chem. Soc.2008, 53, 1543.
Submitted: November 10, 2010