0103 - 5053 $6.00+0.00
A
r
ti
c
le
* e-mail: [email protected]
Electroanalytical Determination of the Herbicide Picloram in Natural Waters by
Square Wave Voltammetry
Marli R. C. Massaroppi, Sergio A. S. Machado* and Luis A. Avaca
Instituto de Química de São Carlos, Universidade de São Paulo, CP 780, 13560-970 São Carlos - SP, Brazil
O uso da voltametria de onda quadrada para a determinação eletroanalítica do picloram em meio aquoso é discutido neste trabalho. Encontrou-se que a reação ocorre por um mecanismo irreversível, envolvendo a transferência de quatro elétrons, com o reagente adsorvido na superfície do eletrodo. Uma aplicação prática foi levada a efeito, com amostras de águas contaminadas artificialmente com o herbicida. Estas amostras consistiam de água pura e de três diferentes amostras, coletadas em três diferentes riachos da região, dois dos quais eram altamente poluídos com efluentes domésticos e industriais. Os limites de detecção calculados variaram entre 11 (para a água pura) e 39 ppb para a amostra mais contaminada. Estes valores são suficientemente baixos para indicar a metodologia em aplicações de análise de traços.
This paper describes the use of square wave voltammetry for the electroanalytical determination of picloram in aqueous media. The reaction was found to occur via an irreversible mechanism involving the transference of four electrons, with the reagent adsorbed in the electrode surface. The practical application was carried out with spiked water samples originated from purified water and from three different local creeks, two of which are highly polluted with industrial and domestic effluents. The calculated detection limits ranged from 11 (for pure and unpolluted waters) to 39 ppb for the most contaminated sample. These low values indicate that such methodology can be conveniently applied in trace analysis.
Keywords: picloram, square wave voltammetry, pesticides, electroanalysis
Introduction
In modern agricultural practices, the most common method for protection against plagues has been the use of the so-called pesticides. Such chemical substances promote indirect benefits by minimising crops lost due to the attack of prejudicial organisms. However, a major problem arising mainly in developing countries has been the use of such products in prophylactic treatments, without much care
on the question of if or when such applications are justified.
The consequences of these attitudes are the widespread contamination of soils and waters with toxic substances as well as the induction for the appearance of more resistant plagues, which in turn demand greater doses of pesticides. After application, the pesticide molecules may undergo different pathways in the environment, depending on the
types of interaction with the soil components.1,2 In soils
rich in organic matter or/and clay, pesticide molecules may
become immobilised by strong absorption3,4 that facilitates
their degradation by sunlight, microorganisms or chemical reactions. In these cases, the degradation products may be toxic or not. In mineral soils, where the interaction is commonly very weak, they may be leached by rain or irrigation waters reaching rivers, dams or under-ground waters. Under such circumstances, the risk of contamination of potable sources is quite serious.
Picloram (4-amino-3,5,6-trichloro picolinic acid) is a selective herbicide, commonly used in association with other herbicides in the annual control of some grasses and broadleaf weeds in corn, sorghum, sugar cane, pineapple,
pinus and other cultures.5 The maximum level of picloram
contamination in drinking water is 0.5 mg L-1, as proposed
by the EPA (Environmental Protection Agency, USA). Human exposure to higher levels of the pesticide can cause damages to the central nervous system, loss of weight, diarrhoea and weakness. Moreover, picloram is the most persistent herbicides of the chlorobenzoic acid family and
ca. 10-30% of the original amount of herbicide was detected
one year after its application in some cultures in Canada.6
extractions and purification steps, thus shortening and undervaluing the pesticide analysis.
Amongst several voltammetric procedures available
for this type of analysis, square wave voltammetry (SWV)7-9
appears as the most interesting one. The main advantage of SWV is the fast scan rate that can be applied, often of
the order of 1 V s-1 instead of the 1-10 mV s-1 used in other
pulse techniques. As the peak current is the sum of forward and backward contributions and is proportional to the scan rate, the sensitivity of SWV is usually larger than for the other techniques, particularly for reversible or
quasi-reversible systems.8 Moreover, the mathematical
interpretation of SWV data provides several important parameters that are useful for the discussion of the reduction mechanism at the electrode surface of such complex molecules. This is an important and almost unique feature of this electrochemical technique.
The aim of this work is to study the electrochemical behaviour of the herbicide picloram in aqueous solution by square wave voltammetry and to establish the initial steps in the development of an electroanalytical procedure to analyse picloram in spiked waters, either pure from the laboratory or polluted from local urban creeks.
Experimental
Reagents
Picloram (99% pure) was purchased from Dow Chemical Corporation. Stock solutions were prepared using a mixture of ethanol and water (5% v/v) to increase the
solubility of the organic compound and kept at ca. 5 oC
protected from light. All other chemical reagents were Merck PA and used without any further purification. Water was purified in a Milli-Q system from Millipore Inc.
Apparatus
SWV experiments were performed with a potentiostat/
saturated Ag/AgCl as the reference and a platinum wire as the auxiliary electrode were employed. The working electrode was the model 303 Static Mercury Drop Electrode, from EG&G PARC, operating with medium drop
size (0.0218 cm2 electrode area).
Experimental methodologies
Samples of natural waters were collected from three different creeks in the region of São Carlos city, Brazil. The collecting points presented different characteristics with regard to water pollution. The first one, at the Santa Maria do Viterbo creek, was located outside the city and is relatively free from urban or industrial pollution. The second point was at the Gregorio creek that is mainly polluted with domestic sewerage without industrial rejects while the third point was at the Monjolinho creek after crossing the city thus collecting a heavy load of industrial and domestic discharges. All samples were collected in amber glass flasks with 1 L capacity that were initially
washed with water and sulfonitric solution (50% v/v HNO3
and H2SO4), cleansed thoroughly with Milli-Q water and
dried in an oven at 120 oC. The collected water samples
had their pH adjusted to 1 by the addition of the required
amount of a 0.1 mol L-1 H
2SO4 solution and were kept in a
refrigerator for a maximum of 5 days prior to use. The analytical curves were obtained using the standard
addition method from a 10-3 mol L-1 stock solution of
picloram in a mixture of 5% v/v of ethanol in water. Even for the highest picloram concentration, the final content of ethanol in the cell was very low.
Results and discussion
Optimisation of voltammetric parameters
Figure 1 presents preliminary cyclic voltammetric experiments carried out on the mercury drop electrode in a
1.05 x 10⁻⁵ mol L-1 picloram solution in H
electrolyte at several sweep rates showed two reduction peaks. As already proposed for the reduction of
organochloride pesticides,10 the first peak (at -0.90 V) is
associated with the totally protonated molecule, while the other one, at -0.95 V is related with unprotonated specie. These peaks were better defined when the sweep rate increased and there was no evidence of an anodic process in the reverse sweep thus suggesting an irreversible electrode process. The linear dependence of the peak current for the first process with the sweep rate shown in the insert of that Figure points to a reduction mechanism with the reagent adsorbed on the electrode surface. The
slope value of the log Ipvs. log v plot (0.9) is close to unity
as expected for adsorption control.11
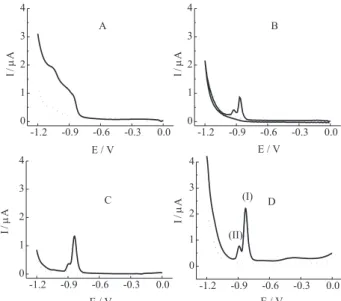
To evaluate the electrochemical response of picloram, experiments were performed using several voltammetric techniques such as DC polarography, cyclic voltammetry, differential pulse polarography and square wave voltammetry.
The different responses recorded for the same solution (i.e.,
4.1 x 10⁻⁶ mol L-1 picloram in 0.5 mol L-1 H
2SO4) are shown in
Figure 2 together with the corresponding experimental parameters used in each case. It is clear that square wave voltammetry provides the highest peak current and the best sensitivity among the four techniques. Moreover, the use of that technique allows experiments to be carried out at high sweep rates thus shortening the time spent with the analysis. These characteristics of SWV are quite convenient for analytical purposes.
The potential program imposed to the working electrode in SWV experiments consists of a symmetrical
square wave (amplitude a) superimposed to the basic
staircase modulation (amplitude ∆E), being the complete
period of the SWV equal to that of the staircase (τ). The
pulse height, or τ/2, is called tp and the frequency, 1/τ, is
designed by f. This potential program combination creates
a series of potential pulses in the forward and backward direction that are synchronised with the current sampling in the last portion of each half-period of the square wave, with negligible contribution from the capacitive current. The resulting current values are, therefore, the combination of the direct (forward) and reverse (backward) contribution. For an adsorption-controlled process, the electrode reaction can be represented by the following scheme:
O → O
ads (1)
Oads + ne-→ R (2)
that has been already analysed in terms of square wave voltammetric boundary conditions by several authors, as cited in the next sections. It should be observed that the
totally irreversible equation 2 has a standard potential Eo
that is experimentally inaccessible.
To account for the mathematical interpretation of the experimental data resulting from the reactions above,
Lovric et al.12 developed three empirical expressions for
peak height, position and width, as follows:
∆Ip = (5 ± 1) x 102 A α n2 F af ∆E G (3)
Ep – E0 = (RT/αnF) ln(kotp) - 0.70∆E (4)
Figure 2. Voltammetric responses obtained for 4.1 x 10⁻⁶ mol L-1
picloram in 0.5 mol L-1 H
2SO4 (full lines) and for the blank solution
(dotted lines) for different techniques: (A) DC polarography, v = 0.002 V s-1; (B) cyclic voltammetry, v = 0.2 V s-1; (C) differential
pulse polarography, a = 0.025 V, v = 0.2 V s-1; (C) square wave
voltammetry, a = 0.05 V, f = 100 Hz, ∆E = 0.002 V, v = 0.2 V s-1.
Figure 1. First cycle voltammograms for 1.05 x 10⁻⁵ mol L-1
piclo-ram in H2SO4 (pH = 1) at different sweep rates: (a) 0.05, (b) 0.10, (c) 0.20, (d) 0.50, (e) 0.75, (f) 1.00 and (g) 1.50 V s-1. Insert: linear
relationship between ip and v for the first reduction process (R =
the considerable larger current value. A similar response,
for a 1.05 x 10⁻⁵ mol L-1 picloram solution, is decomposed
in the direct, reverse and total components in Figure 3. The irreversibility of the reduction reaction is, once more, evidenced by the lack of response in the reverse component.
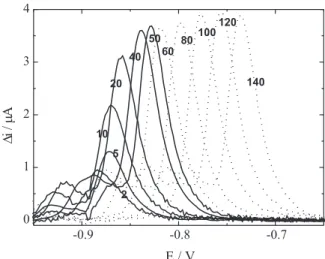
To optimise the experimental set-up used for picloram determination, the dependence of the SWV responses with several parameters was analysed. Figure 4 shows the effect
of the square wave amplitude (a) on the voltammograms
obtained for a 1.05 x 10⁻⁵ mol L-1 picloram solution with f
= 100 Hz and ∆E = 0.002 V. The peak current increases
linearly with amplitude up to approximately 0.05 V and
then stabilise, in accordance with the theory.11 This is
shown in Figure 5 where the slope of the linear portion is
186.3 ± 0.007 µA V-1, with r = 0.996 and N = 9. Therefore,
increasing the amplitude to values higher than 0.05 V fails to further improve the sensitivity of the technique. However, that variation of the amplitude also results in a peak potential shift towards more positive values and this may
be useful for solutions with more than one component. As this highly irreversible electrode process does not have any appreciable contribution from backward currents, the increase in square wave amplitude must result in a linear variation of peak potential, as shown in Figure 6. However, this latest plot has a slope of 1.02 that is quite different from the 0.7 value predicted by equation 4. Meanwhile,
other authors13 claim that this should have a unitary value,
as found here.
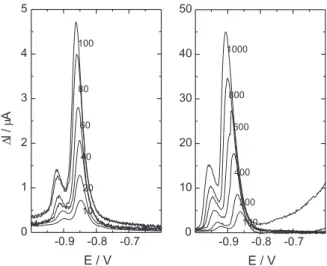
Another experimental parameter that exerts an important influence in the square wave response is the frequency. In this work, frequency values have been changed from 10 to 1000 Hz. The results are illustrated in Figure 7 in the form of two sets of voltammograms, the
Figure 3. SWV voltammograms for 1.05 x 10⁻⁵ mol L-1 picloram in
H2SO4 (pH 1) and DE = 0.002 V, a = 0.05 V and f = 100 Hz, decomposed in the forward (If), backward (Ib) and total (It) compo-nents.
Figure 4. Effect of the variation in SWV amplitude (a) on the shape of voltammograms obtained for 1.05 x 10⁻⁵ mol L-1 in H
2SO4 (pH 1),
f = 100 Hz and ∆E = 0.002 V.
Figure 5. Dependence of the experimental peak current with the SWV amplitude for the reduction of 1.05 x 10⁻⁵ mol L-1 picloram in
first one with frequency values varying from 10 to 100 Hz and the other from 100 to 1000 Hz. The peak currents showed a linear variation within the whole frequency range, with R = 0.997, N = 77 and d ∆Ip / df = 4.38 x 10⁻⁸ A s. This
linear relationship is typical for an electrochemical process controlled by the adsorption of reagent or product, as it is the case for picloram reduction. The relationship between peak potential and the logarithm of frequency provides a manner to calculate the number of electrons transferred in the reduction reaction. Figure 8 shows the straight line with a slope of 1.83 obtained within the experimentally
useful frequency range. Considering α = 0.5, the number
of electrons transferred in the electrochemical reduction process should be equal to 4.
Figure 6. Variation of the peak potential as a function of SW ampli-tude for the reduction of 1.05 x 10⁻⁵ mol L-1 picloram in H
2SO4 (pH 1),
f = 100 Hz and ∆E = 0.002 V.
Figure 8. Plot of peak potentials as a function of the logarithm of SWV frequencies for the reduction of 1.05 x 10⁻⁵ mol L-1 picloram
in H2SO4 (pH 1), a = 0.05 V and ∆E = 0.002 V.
Figure 7. Influence of SWV frequency in the response of 1.05 x 10⁻⁵ mol L-1 picloram in H
2SO4 (pH 1), a = 0.05 V and ∆E = 0.002 V.
The frequency values in Hz are indicated on the curves.
Analytical application
The application of the previously optimised methodology for the analysis of picloram in pure and natural waters without any pre-purification step will be now presented. Samples were collected directly from the creeks described in the Experimental section, had their pH adjusted
to 1 by the addition of H2SO4 and used as the electrolyte
without any further physicochemical characterisation SWV responses were obtained for the four types of
electrolyte, i.e., purified water, water from Santa Maria do
Viterbo creek, from Gregorio creek and from Monjolinho creek. The results are displayed in Figure 9 for the different electrolytes spiked with several concentrations of picloram,
DL = 3 SB / B (6)
where SB holds for the standard deviation for the blank
solution, at a potential equal to the peak potential for picloram reduction, and B is the angular coefficient of the straight lines, the sensitivity value. The calculated DL values are collected in Table 1 together with B and the
variation for the blank responses. This is an important finding since no clean-up step was included in the present study, which should be necessary for a chromatographic determination. The lack of necessity of sample manipulation yields an overall fast and cheap analytical methodology. However, industrial and/or domestic pollutants present in the other two creeks clearly diminish the sensitivity of the method, as revealed by the increase in the detection limit values. Nevertheless, all the detection limit values obtained in this work using the square wave voltammetry are sufficiently small to indicate this technique to be used in trace analysis.
Conclusions
The electrochemical reduction of picloram in aqueous media was successfully studied by square wave voltammetry. Several voltammetric parameters were optimised and their influence in the peak currents or peak potentials were adequately described by theoretical models involving an irreversible electrode process, with the reagent strongly adsorbed on the surface and the transference of 4 electrons per picloram molecule.
In the analytical application, SWV showed to be a very fast and sensitive technique that allows reaching detection
limits in the range of trace analysis, i. e., between 11 and
39 ppb, even in highly polluted natural water samples collected from urban creeks. The natural components of creek waters do not seem to interfere with the
Figure 10. Analytical curves for the four different water samples (pH 1), using the peak currents of the experiments shown in Figure 9.
Table 1. Parameters obtained by linear regression applied to the four analytical curves of Figure 9
Sample Linear Relationship Equation: y = A + B.x
A B R sB DL/ppb
Pure Water - 45.22 ± 21.87 2.603 ± 0.0948 0.996 9.715 1 1
SMVa + 41.38 ± 17.14 1.024 ± 0.0579 0.995 3.689 1 1
GREb + 56.57 ± 29.76 1.060 ± 0.1010 0.987 13.691 3 9
MONc + 47.59 ± 23.55 0.949 ± 0.0739 0.991 11.399 3 6
electroanalytical determination since the detection limits of pure and non-polluted waters are practically the same. The lowering of sensitivity due to the organic components in contaminated waters is a characteristic of mercury, the working electrode on which picloram molecules undergo strong adsorption.
Contrary to several other analytical techniques com-monly used for the determination of pesticides, no purifi-cation or extraction steps are necessary before obtaining the analytical curve by SWV. This is one major advan-tages of this electroanalytical technique since it allows an economy of time and money in the environmental moni-toring of pesticide contamination.
Acknowledgements
The authors wish to thank the Conselho Nacional de Desenvolvimento Científico e Tecnológico (CNPq) and the Fundação de Amparo à Pesquisa do Estado de São Paulo (FAPESP, proc. No. 00/03540-6), Brazil, for financial support.
References
1. Gevao, B.; Semple, K. T.; Jones, K. C.; Environ. Pollution 2000, 108, 3.
2. Barriuso, E.; Feller, Ch.; Calvet, R.; Cerri, C.; Geoderma 1992, 53, 155.
3. Weber, J. B.; Weed, S. B.; Ward, T. M.; Weed Science1969, 17, 417.
4. Barriuso, E.; Calvet, R.; Int. J. Environ. Anal. Chem.1992, 46, 117.
5. U.S. EPA; Drinking Water Health Advisory: Pesticides, 2nd
ed., Lewis Publishers: Chelsea, 1991, p. 819.
6. Meru, S.; Liber, K.; Stonefiel, K.; Solomon, K.; Stephenson, G.; Arch. Environ. Cont. Toxicol.1990, 19, 572.
7. Ramaley, L.; Krause, Jr. M. S.; Anal. Chem. 1969, 41, 1362. 8. Borman, S. A.; Anal. Chem. 1985, 54, 698A.
9. Lovric, M. A.; Lovric, S. K.; J. Electroanal. Chem.1988, 248, 239.
10. Vaz, C. M. P.; Crestana, S.; Machado, S. A. S.; Mazo, L. H.; Avaca, L. A.; Intern. J. Environ. Anal. Chem.1996, 62, 65. 11. Gosser, Jr. K. D.; Cyclic Voltammetry: Simulation and
Analy-sis of Reaction Mechanism, VCH Publisher: New York, 1993, p. 97.
12. Lovric, M. A.; Lovric, S. K.; Murray, R. W.; Electrochim. Acta, 1988, 33, 739.
13. O’Dea, J. J.; Ribes, A.; Osteryoung, J. G.; J. Electroanal. Chem., 1993, 345, 287.
14. Whittaker, J. W.; Osteryoung, J.; J. Agric. Food Chem., 1980, 28, 89.
15. Krzyszowska, A. J.; Vance, G. F.; J. Agric. Food Chem., 1994, 42, 1693.
Received: October 10, 2001
Published on the web: January 17, 2003