Artigo
DEFORMATION MONITORING OF LARGE STRUCTURES BY
GROUND-BASED SAR INTERFEROMETRY
Monitoramento de Deformação em Grandes Estruturas pela Interferometria SAR de base no solo
Zhiwei Qiu1,2 Jianping Yue1 Xueqin Wang1 Shun Yue1
1 Hohai University, Earth Science and Engineering, Focheng west road 8, Nanjing, China, 211000. Email: [email protected]
2 Henan University of Urban Construction, Pingdingshan 467036, China
Abstract:
In this paper, a ground-based SAR interferometry technology was used to monitor major engineering. This technology has been recognized as a powerful tool for terrain monitoring and structural change detecting. Deformation monitoring for large project has been a hot issue among them. According to GBSAR interferometry principle and characteristics of IBIS system, the authors analysis the error sources of deformation monitoring, and experimentally extract atmospheric phase which should removed based on permanent scattered analysis. Atmospheric disturbance effect analysis is discussed in this paper, and an atmospheric correction method is proposed to remove atmospheric effect, then the effective displacement can be retrieved. Results from this approach have been compared with that from traditional method in this campaign, GBInSAR technology can be exploited successfully in deformation monitoring for major projects with high accuracy.
Resumo: Neste artigo foi utilizada a tecnologia de interferometria SAR ground-based para monitoramento de estruturas. Esta tecnologia é reconhecida como uma ferramenta ponderosa para monitoramento do terreno e para detecção de alterações estruturais. O monitoramento de deformações em grandes projetos tem sido um tópico importante. De acordo com o princípio de interferometria GBSAR e das características do sistema IBIS os autores analisaram as fontes de erros no monitoramento de deformações, e extraíram experimentalmente a fase atmosférica baseado na análise de dispersão. A análise do efeito atmosférico é discutida neste artigo e propõe-se um método de correção atmosférica para remove-lo, de modo que o deslocamento efetivo possa ser obtido. Os resultados desta abordagem foram comparados com os métodos tradicionais nesta campanha e conclui-se que a tecnologia GBInSAR pode ser utilizada no monitoramento de grandes projetos com alta acurácia.
Palavras-chave: Efeito Atmosférico, Interferometria GBSAR, sistema IBIS, Dispersão permanente.
1. Introduction
Ground-based SAR system can receive the images for illuminated area by active imaging capability. Synthetic aperture radar and step-frequency continuous wave technology are employed to improve the special resolution in azimuth and rang direction(Yue Jianping, 2007). Interferometry technique can improve the accuracy on a fine resolution map of the scene. Typical applications are: landslide(Strozzi T, 2005;Noferini L, 2007;Luzi G,2009), glaciers(Luzi G,2007), the dam(Mario A,2008), building(D.Tarchi,2000) and bridges(Devis Dei,2009) and earthquake, volcanic hazard assessment, land subsidence monitoring(Pipia L,2007). GBInSAR with high precision, low cost, special continuity is a new approach for monitoring; its high sampling frequency is sensitive to the movements of architectural structures such as bridges and dams in real time(Qiu Zhiwei, 2010). This technique overcomes deficiencies belonged to space-borne SAR such as spatial and temporal decorrelation, low resolution(Liao Mingsheng, 2003).
Pipia in Spain carried out mining subsidence monitoring by GBInSAR with different polarization, this experiment proved the comprehensive utilization of HH and VV polarization image can extract accurate stable point(Linhsia Noferin,2007).
GBInSAR technology has been largely used in interference applications in recent years, technology defects such as atmospheric effects, temporal and special decorrelation become more prominent. In 2004, Guido Luzi et al. analyzed the decorrelation caused by baseline or other factors combined with GBInSAR monitoring data for landslide somewhere, and proposed atmospheric effects can be eliminated through the PS points. In 2005, Linhsia Noterini pointed out the true deformation values were submerged in phase errors caused by atmospheric disturbance for valley monitoring data, then the effective displacement could be extracted by meteorological correction for GBInSAR data with PS technique(Noferini L,2005). In 2006, Massimiliano Pieraccini et al. used GBInSAR technology to monitor the landslide somewhere unstable, eliminated the effect caused by temporal and meteorological decorrelation through PS technique, and verified the effectiveness of PS in GBInSAR.
2. GBInSAR system IBIS and its working principle
The displacement between target and radar center along the line of sight can be calculated by the interferogram derived from two GB-SAR images. The two dimensional image is produced by synthetic aperture radar technique, the range resolution is improved by SF-CW, and the deformation information can be extracted from interference phase difference, which is working principle for GBInSAR.
Figure 1: Micro-deformation monitoring system IBIS.
Figure 2: SF-CW technology.
2.1SF-CW technology
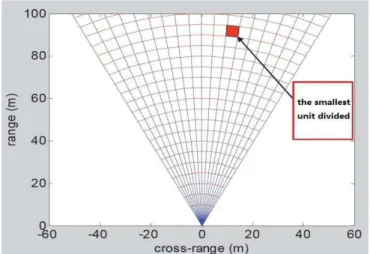
2.2 Synthetic Aperture Radar (SAR) technology
Synthetic aperture technology is actually a Doppler analysis technology. The Doppler shift between different scatters with same range can be acquired by radar motion to improve azimuth resolution. In brief, the synthetic aperture technique is to use a real antenna with small motion as a long one, named as “synthetic aperture”.
3. Atmospheric disturbance analysis
As the displacement can be extracted from interference phase received by Interferometry SAR, the phase quality affected by decorrelation is most important factor for deformation monitoring. The decorrelation of space borne radar is due to: a. geometric decorrelation caused by baseline; b. decorrelation caused by doppler shift; c. temporal decorrelation caused by revisiting period or temperature, meteorological condition. Although the measurement principle of GBInSAR is same with space-borne SAR in essence, the first and second one can be ignored because there is no baseline for GBSAR. Therefore, the temporal decorrelation caused by atmospheric disturbance is the key factor to improve phase quality for GBInSAR(He Min,2005;Huang Qihuang,2011).
Atmospheric refractivity
n
changing with temporal and special distribution is the source of phase error due to atmospheric disturbance. Firstly, we can suppose radar frequency asf
, the echo phase of the target located with a distancer
from radar antenna center can be expressed as(Strozzi T,2005):In Equation 1,
c
is the propagation speed of radar wave in vacuum, refractivityn
is the function of timet
and ranger
. If the range Rbetween static target and radar is constant, refractivityn
only has relation with timet
, the echo phase difference between timest
1 andt
2 can be expressedas:
The phase difference Δφ is interference phase contributed by atmospheric disturbance. If the atmospheric conditions in time
t
1 andt
2 are identical totally, the phase difference will be zero.GBInSAR signal once travels in troposphere, refractivity
n
is the function of degree Kelvin T, atmospheric pressure P and humidity H. The refractivity is very close to 1 as usual, so the refractionN
always takes place of the refractivity in electromagnetic wave propagation. The relation between them can be expressed as(L Pipia,2008):
Tropospheric delay can be divided into two components, dryNdryand wetNwet. The refraction
N
can stated as:
In Equation 4, P is total atmospheric pressure, Pd is dry atmospheric pressure, e is water vapor pressure, the unit of them is mbar. The relation between them is Pd =P - e, the water vapor pressure can be expressed as (
e
sat is standard vapor pressure saturation):
We can see that dry delay component has relation to total atmospheric pressure P and degree Kelvin T, and wet delay component has relation to water vapor pressure e and degree Kelvin T. As the water vapor distributions in troposphere vary in time and space greatly, wet delay component is main factor of atmospheric effect.
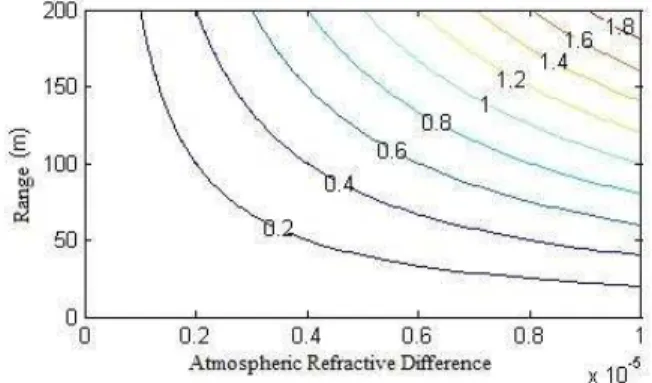
Therefore, phase difference caused by atmospheric effect is a function composed of range R and atmospheric refractivity difference Δnatm. Supposed the central frequency is 2GHz, the error curves are shown in Figure 3. The error caused by atmospheric effect is up to millimeter level when the atmospheric refractive difference increases with volume 10-5, and the displacement is
proportional to range, so we should take measures on the atmospheric effect correction (L Pipia,2008).
4. Artificial control point atmospheric correction method
Stable artificial targets was placed in illuminated area before measurement, artificial control point correction method can eliminate the atmospheric disturbance by analyzing interference phase of these control point targets. Spain's L.Pipia21 and South Korea's H.Lee22 et al. arranged a stable metal reflector as artificial control points in observation region. The atmospheric effect were restricted by these points, the errors were rectified well. The stable artificial target can be regarded as a special PS point, and the parameters of the point can be accurately measured, processed simply. Therefore this method of atmospheric effects correction will be accomplished in our experiment, and then we will analyze this method.
Supposed
φ
atm(r,t) stands for phase error caused by atmospheric effect, the interference phasecan be expressed as Equation 6 without considering the influence due to the vibration of scatterers and the noise caused by system.
In Equation 6,
φ
dis(r,t) means interference phase due to displacement, this value would be zerofor static target. If the illuminated region is small scale, this phase model is linear:
The phase
φ
dis(r,t) is zero for artificial target without movements, ais the estimated value of coefficient a can be expressed as:
The average value of a few control points can be calculated to improve the estimation accuracy as usual, other monitoring targets will be corrected with this value,
φ
corr(r,t) interference phaseafter correction is:
When the monitoring region is large scale and complex, the interference phase due to atmospheric effect which is nonlinear with the range r can be expressed by quadratic function:
4.1 Atmospheric correction experiment
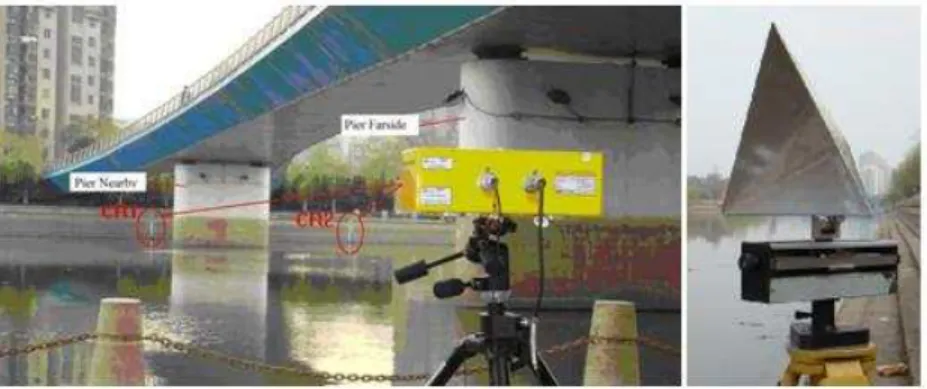
This experiment platform is IBIS system (see the section 2.3), artificial targets observed are reflector with three corners. Artificial control point atmospheric correction method is employed to eliminate atmospheric disturbance here.
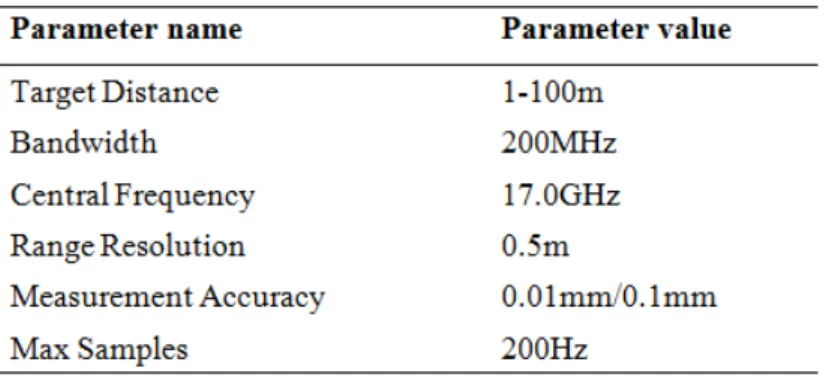
Table 1:System parameters of IBIS
The target distance is within 100m, the frequency center is 16.9GHz, and wavelength is 17.6mm. The range resolution is 0.5m, and the dynamic monitoring measurement accuracy is 0.01mm, static monitoring measurement precision is 0.1mm. Other system parameters of IBIS are shown in Table 1.
Test site is Stone City along the Qinhuai River in Nanjing as shown in Figure 4, two corner reflectors CR1 and CR2 was arranged along the bank of this river. 24 IBIS measurements were received during the time from 10:00 to 17:00, the reflector CR2 was static all the time and the other had displacement with a few millimeters recorded by venire caliper in this experiment.
Figure 4: Atmosphere disturbance experiment scene correction and corner reflector.
Figure 5: The range profile of IBIS data.
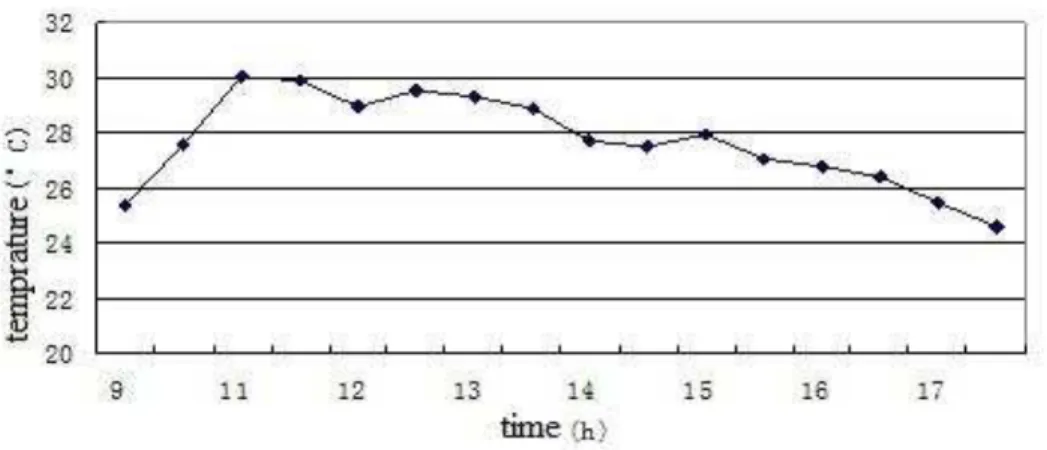
Figure 6: Temperature variation of the scene.
Figure 7:Relative humidity variation of the scene.
For noise reduction, the displacements of each target during observation period are averaged, and the processed displacements for piers nearby and farside are drawn according to the monitoring period in Figure 8. Because the piers are stable and unshakable, the displacements measured for piers can be recognized as the phase error caused by atmospheric effects which is proportional to the distance, pier farside has greater variations than nearby obviously.
Since the scene is relatively small, the atmospheric effect factor a can be estimated from Equation 7. The "distant pier" and "pier nearby" can be seen as the stable control point to estimate atmospheric influence factor. After taking the average of these two estimations as a regional atmospheric influence factor, coarse phase received by IBIS can be rectified by Equation 9. After atmospheric influence factors have been finished, the displacements before and after atmospheric correction for CR2 with the time series can be given in Equation 6.
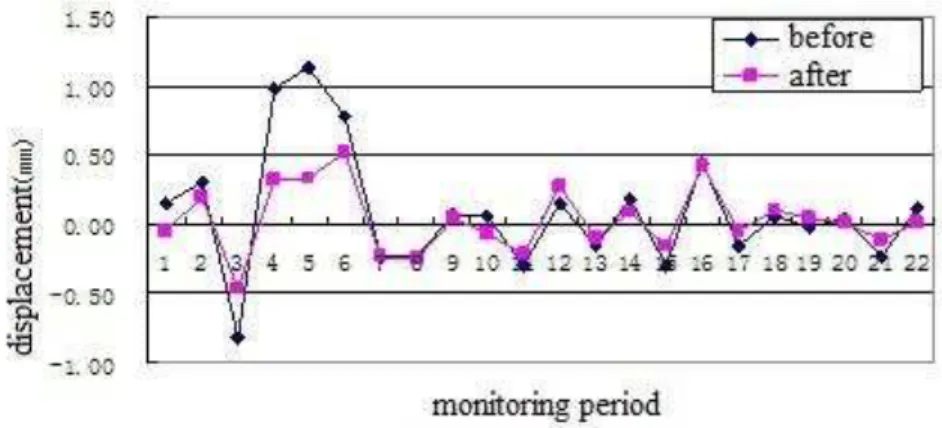
Figure 9: Displacement with atmospheric correction before and after for CR2.
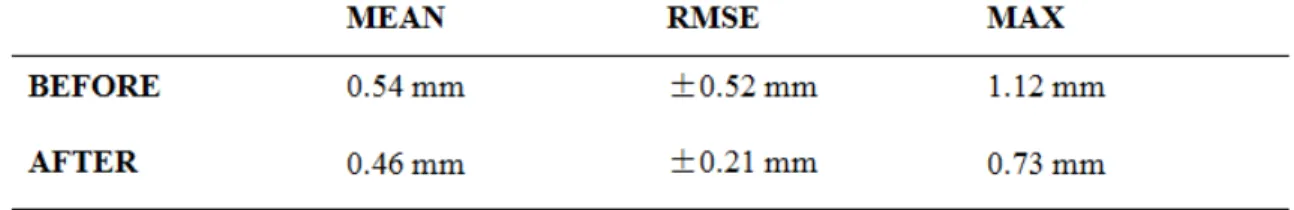
Since the corner reflector CR2 is static, and the displacement should be zero, the displacement value is the observation error induced by atmospheric disturbance. After data analysis combined with statistical data in Table 2, atmospheric effect through atmospheric correction can be reduced by artificial control point atmosphere correction method.
Table 2: The statistical error of CR2 with atmospheric correction before and after
Figure 10: Displacement atmospheric correction before and after for CR1.
Static monitoring model is adopted by IBIS system, precision is ± 0.1mm. Corner reflectors with rail and venire caliper are installed with accuracy of 0.02mm, much higher than that of IBIS, so that the displacement measured by venire caliper can be seen as true value. Difference of these two values can be seen as the monitoring error of IBIS system. The monitoring error is shown in Figure 10, and statistical data is shown in Table 3. The statistical results show that the measure accuracy after atmospheric correction is improved greatly, and the max error could be controlled within 1mm.
Table 3: The statistical error of CR1 atmospheric correction before and after.
5. Dam deformation monitoring
Figure 11: Dam of Hegeyan
Figure 12: IBIS-L equipment and the scenario from the radar view
Constantly this structure was monitored during the time from July 12 30 to 31, 2013. The device works in the Ku-band with a central wavelength of about 1.7cm and is able to achieve a maximum cross-range resolution of about 4.5 mard. About 267 synthetic images was produced during this test campaign, and the revisiting interval was about 5 min. Figure 12 depicts the IBIS-L equipment and the relative position between the dam and the IBIS. The maximum illuminated distance is 4 kilometers, and the maximum observation distance in this campaign is about 1.3km. The ground where the radar was placed on has stable geological structure. There were no obstructions between equipment and dam, so the illuminated scene covers the whole dam body and the surroundings.
5.1Materials and methods
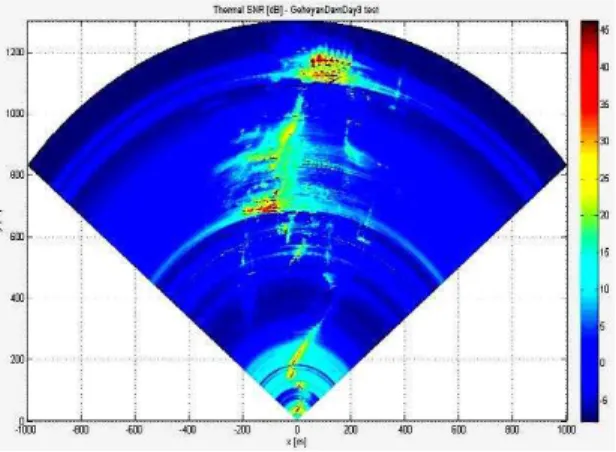
db, correlation coefficients above 0.7(Figure 15), and the phase stability above 3.0(Figure 16). Therefore, IBIS system was able to collect radar reflection information of structure surface, and this device has high reliability.
Figure 13: The reflection power map.
Figure 14:The signal-to-noise ratio of dam.
Figure 16: The phase stability map.
Three points located on the two sides of the bedrock were chosen as ground control point in this test, which has no displacement during the experiment. Other 13 feature points which should be good enough to be representative were selected elaborately for dam monitoring. Therefore, as these points in Figure 17 already showed were distributed on the dam of the upper, middle and lower position. As the ground control points were stable, the observed displacement was mainly derived by atmospheric disturbance. This error can be removed by stripped these displacement variation according to PS approach, and then the dam surface deformation can be calculated. Here a limited group of 13 scatterers chosen as feature points of structure surface were carried out for displacement variation analysis.
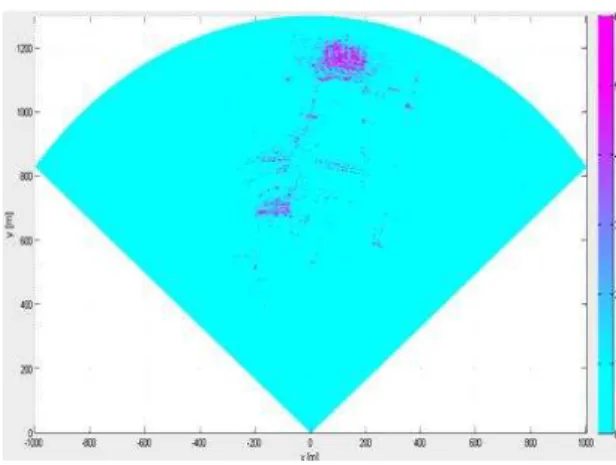
Figure 17: The false color map of LOS displacement for the dam.
The vertical measurement was also carried out for verification during GBSAR monitoring period. One point was chosen from dam foundation as stable point according to the basic principle of vertical monitoring. Therefore, measurement processed and vertical results were not able to be compared directly, even the data received by IBIS is the displacement along line of sight. Firstly, the LOS displacement should be projected along vertical direction23, and then the difference can be calculated by using the displacements from dam body point and bottom point (Figure 19). The difference between two methods of observation error can be restricted within±2 mm, which might be caused by the existence of residual error such as atmospheric disturbance. Verification results show that this monitoring method is reliable to monitor dam deformation by using ground-based radar. Results from this atmospheric correction method have been compared with that from traditional method, GBInSAR technique can be applied in deformation monitoring for large water conservancy projects such as dam.
Figure 19: Results of IBIS-L data compared with vertical monitoring data.
6. Conclusion
GBInSAR technology is a useful tool for extracting deformation by virtue of radar interferometry technique, which has been applied in deformation monitoring for major projects such as dam, bridge and slope. Compared with traditional method, GBInSAR is a kind of potential monitoring technology with high precision, 2D imaging capability, monitoring in real time and all weather condition. According the atmospheric contribution to the phase, This paper proposes a approach to estimate atmospheric phase which should be removed by permanent scatters analysis. This technique has been proven to be effective in Hegeyan dam monitored continuously for 24 hours in this paper, and the displacement map for the dam can be obtained. Compared with vertical monitoring results, the monitoring accuracy of GBInSAR technology is fully capable of being applied in deformation monitoring for major projects such as dam(Bernard Ini G,2007;He Ning,2009).
ACKNOWLEDGMENT
REFERENCES
Yue Jianping, Fang Lu, LI Ni, “Research advances of theory and technology in deformation monitoring,”
Bulletin of Surveying and Mapping, 2007(7).
Liao Mingsheng, Lin Hui, “Synthetic aperture radar interferometry— Principle and Signal Processing,”
Published by Surveying and Mapping Press, 2003.
Qiu Zhiwei, Zhang Lu, Liao Mingsheng, “An algorithm for spaceborne interferometric sar signal processing with coherence optimization,” Geometrics And Information Science Of Wuhan University, 2010, 35(9), pp.1065-1068.
Strozzi T, Farina P, Corsini A, “Survey and monitoring of landslide displacements by means of L band satellite SAR interferometry,”Landslides,2005,2(3), pp.193-201.
Noferini L, Pieraccini M, Mecatti D, “Using GBSAR technique to monitor slow moving landslide,”
Engineering Geology, 2007, 95, pp.88-98.
Luzi G, Noferini L, Mecatti D, Macaluso G, “Using a groundbased SAR interferometer and a terrestrial laser scanner to monitor a snow covered slope: results from an experimental data collection in Tyrol(Austria),”IEEE Trasactions on Geoscience and Remote Sensing,2009,47(2),pp.382-393.
Herrera G, Fernandez Merodo JA, Mulas J, Pastor M, Luzi G, “A landslide forecasting model using ground based SAR data: the portalet case study,”Engineering Geology, 2009, 105(3/4), pp.220-230.
Luzi G, Pieraccini M, Mecatti D, Noferini L, “Monitoring of an alpine glacier by means of ground based SAR interferometry,”Geoscience and Remote Sensing Letters, IEEE, 2007, 4(3), pp.495-499.
Mario A, Giulia B, Alberto G, “Measurement of dam deformations by terrestrial interferometric techniques,” Congress of the International Society for Photogrammetry and Remote Sensing in Beijing, ISPRS, 2008, pp.133-139.
D.Tarchi, H.Rudolf. “Remote monitoring of buildings using a ground-based SAR:Application to cultural heritage survey,”Remote Sensing,2000,21(18), pp.3545–3551.
Devis Dei, Massimiliano Pieraccini, et al, “Detection of vertical bending and torsional movements of a bridge using a coherent radar,” NDT&E International, 2009(6), pp.741-747.
Pipia L, Fabregas X, Aguasca A,Lopez-Martinez C, Mallorqui J,Mora O, “A Subsidence Monitoring Project using a Polarimetric GB-SAR Sensor,” Workshop POLinSAR,2007(1), pp.22-26.
Leva D, Nico G, Tarchi D, Fortuny-Guasch J, Sieber AJ “Temporal analysis of a landslide by means of a ground-based SAR interferometer,”IEEE Transactions on Geosciences and Remote Sensing, 2003,41(4), pp.745–752.
Kazunori Takahashi, Matsumoto M, Sato M. “Continuous Observation of Natural Disaster Affected Areas Using Ground-Based SAR Interferometry,” Applied Earth Observations And Remote Sensing, 2013,6(3), pp.1-8.
G. Bernardini, Ricci P. “Dynamic Monitoring Of Civil Engineering Structures By Microwave Interferometer,” Conceptual Approach to Structural Design Venice, 2007(6).
Noferini L, Pieraccini M, Mecatti D, Luzi G, Atzeni C, Tamburini A. “Permanent scatterers analysis for atmospheric correction in ground based SARInterferometry,” IEEE Transactions on Geosciences and
Remote Sensing. 2005,43(7), pp.152-157.
He Min, He Xiufeng, “Interferometrie synthetie aperture radar and its application to deformation monitoring,”Hydropower Automation and Dam Monitoring, 2005,29(2).
Huang Qihuang, Zhang Lixiang, “Ground-based synthetic aperture radar interferometry and its application to deformation monitoring,” Advances In Science And Technology Of Water Resources, 2011,31(3), pp.54-62
Strozzi T, Farina P, Corsini A, “Survey and monitoring of landslide displacements by means of L- band satellite SAR interferometry,” Landslides, 2005, 2(3), pp.193-201.
L Pipia, X Fabregas, A. Albert, L. M. Carlos, “Atmospheric artifact compensation in Ground-Based DInSAR applications,” IEEE Geosci. Remote Sens. Letters, 2008, 5(1), pp.88-92
H. Lee, J. H. Lee, S. J. Cho, N. H. Sung and J. H. Kim, “An experiment of GB-SAR interferometric measurement of target displacement and atmospheric correction,”IGARSS, 2008, pp. 240-243.
Linhsia Noferini, Massimiliano Pieraccini, D Mecatti, G Macaluso, “DEM by Ground-Based SAR Interferometry,” IEEE Geoscience And Remote Sensing Letters, 2007, 4(4), pp.659-663.
Bernard Ini G, Ricc I P, Coppi F, “A Ground Based M icrowave Interferometer with Imaging Capabilities for Remote Measurements of Displacements,” M GALAHAD workshop within the 7th Geometric Week
and the “3rd International Geotelematics Fair ( GlobalGeo )”, Barcelona, Spain, 2007, pp.20-23.
He Ning, Qi Yue, He Bin, Wang Zhangchun, “Application of movement and surveying radar in the surface displacement monitoring of dam,”China Water Resources, 2009.08.
Recebido em maio de 2015.