NHESSD
2, 4101–4133, 2014A satellite-based analysis of the Val d’Agri (South of Italy) Oil Center gas flaring
emissions
M. Faruolo et al.
Title Page
Abstract Introduction
Conclusions References
Tables Figures
◭ ◮
◭ ◮
Back Close
Full Screen / Esc
Printer-friendly Version
Interactive Discussion
Discussion
P
a
per
|
Discus
sion
P
a
per
|
Discussion
P
a
per
|
Discussion
P
a
per
|
Nat. Hazards Earth Syst. Sci. Discuss., 2, 4101–4133, 2014 www.nat-hazards-earth-syst-sci-discuss.net/2/4101/2014/ doi:10.5194/nhessd-2-4101-2014
© Author(s) 2014. CC Attribution 3.0 License.
This discussion paper is/has been under review for the journal Natural Hazards and Earth System Sciences (NHESS). Please refer to the corresponding final paper in NHESS if available.
A satellite-based analysis of the Val d’Agri
(South of Italy) Oil Center gas flaring
emissions
M. Faruolo1, I. Coviello1, C. Filizzola1, T. Lacava1, N. Pergola1, and V. Tramutoli1,2
1
Institute of Methodologies for Environmental Analysis – National Research Council, Tito Scalo, Italy
2
School of Engineering – University of Basilicata, Potenza, Italy
Received: 28 February 2014 – Accepted: 30 April 2014 – Published: 6 June 2014 Correspondence to: M. Faruolo ([email protected])
NHESSD
2, 4101–4133, 2014A satellite-based analysis of the Val d’Agri (South of Italy) Oil Center gas flaring
emissions
M. Faruolo et al.
Title Page
Abstract Introduction
Conclusions References
Tables Figures
◭ ◮
◭ ◮
Back Close
Full Screen / Esc
Printer-friendly Version
Interactive Discussion
Discussion
P
a
per
|
Discus
sion
P
a
per
|
Discussion
P
a
per
|
Discussion
P
a
per
|
Abstract
In this paper the Robust Satellite Techniques (RST), a multi-temporal scheme of satel-lite data analysis, was implemented to analyze the flaring activity of the largest Italian gas and oil pre-treatment plant (i.e. the Ente Nazionale Idrocarburi – ENI – Val d’Agri Oil Center – COVA). For this site, located in an anthropized area characterized by
5
a large environmental complexity, flaring emissions are mainly related to emergency conditions (i.e. waste flaring), being the industrial process regulated by strict regional laws. With reference to the peculiar characteristics of COVA flaring, the main aim of this work was to assess the performances of RST in terms of sensitivity and reliabil-ity in providing independent estimations of gas flaring volumes in such conditions. In
10
detail, RST was implemented on thirteen years of Moderate Resolution Imaging Spec-troradiometer (MODIS) medium and thermal infrared data in order to identify the highly radiant records associated to the COVA flare emergency discharges. Then, exploiting data provided by ENI about gas flaring volumes in the period 2003–2009, a MODIS-based regression model was developed and tested. Achieved results indicate that such
15
a model is able to estimate, with a good level of accuracy (R2of 0.83), emitted gas flar-ing volumes at COVA.
1 Introduction
The Petroleum Industry includes a wide range of activities and equipments (EPA, 2012), which affect the regional and global air quality status. The production of oil and
20
gas, in fact, generates waste gases that need to be controlled in a manner that protects the environment. In all industrial plants, such as petroleum refineries, chemical plants, natural gas processing plants as well as oil/gas production sites, gas flares are used as a gas combustion device. Flaring is a high-temperature oxidation process used to burn combustible components, mostly hydrocarbons, of waste gases deriving from
in-25
NHESSD
2, 4101–4133, 2014A satellite-based analysis of the Val d’Agri (South of Italy) Oil Center gas flaring
emissions
M. Faruolo et al.
Title Page
Abstract Introduction
Conclusions References
Tables Figures
◭ ◮
◭ ◮
Back Close
Full Screen / Esc
Printer-friendly Version
Interactive Discussion
Discussion
P
a
per
|
Discus
sion
P
a
per
|
Discussion
P
a
per
|
Discussion
P
a
per
|
vessels or pipes from over-pressuring due to unplanned upsets, particularly at gas pro-cessing plants. In an emergency situation where equipment becomes over-pressured, special safety systems automatically release gas to flare stacks, avoiding fires and ex-plosions of the plant (Ohio Epa, 2012). Flares are also used as an outlet for gas during maintenance and equipment repairs, in these scenarios the flare is operated
temporar-5
ily until the emergency situation is resolved or until maintenance activities have been completed (Ohio Epa, 2012).
The gas flaring is recognized as a waste of valuable non-renewable source of clean energy and an added load of carbon emissions to the atmosphere (Elvidge et al., 2007; Ismail and Umukoro, 2012), contributing to the global warming, causing climate change
10
and affecting the environmental quality and the human health of the areas close to the flares. This happens especially in countries of the world lacking pipelines and other gas transportation infrastructures as well as processing plants to handle natural gas and where no efficient and effective regulations on flaring are applied (Cholakov, 2009; Ohio Epa, 2012; Ismail and Umukoro, 2012). The World Bank has estimated that 150
15
billion cubic meters of natural gas are being flared annually, that is equivalent to 30 % of the European Union’s gas consumption. By gas flaring about 400 million tons of CO2 (representing about 1.2 % of global CO2 emissions) are added annually into the atmosphere (World Bank, 2012).
There is a unanimous view that a global effort to track progress on flaring monitoring
20
also using independent tools, able to provide continuous and systematic information on this phenomenon (Ismail and Umukoro, 2012) has to be carried out.
Recently, satellite observations have been widely employed to investigate this phe-nomenon, demonstrating to have a potential in providing independent estimates of gas flaring volumes injected into the atmosphere. Pioneering works on this topic date back
25
NHESSD
2, 4101–4133, 2014A satellite-based analysis of the Val d’Agri (South of Italy) Oil Center gas flaring
emissions
M. Faruolo et al.
Title Page
Abstract Introduction
Conclusions References
Tables Figures
◭ ◮
◭ ◮
Back Close
Full Screen / Esc
Printer-friendly Version
Interactive Discussion
Discussion
P
a
per
|
Discus
sion
P
a
per
|
Discussion
P
a
per
|
Discussion
P
a
per
|
of satellite data have the potential for systematic observation of flares and estimation of flared gas volume emissions globally (Elvidge et al., 2012). To this aim, given the wide spatial distribution and the possible gas flaring fluctuation over time, particular attention has to be given to sensors able to collect data globally, on a frequent basis, and having a spectral capability suitable to detect gas flaring and/or related
phenom-5
ena. Moreover, long-term data archives, together with a prospect for a time continuity of homogeneous observations in the future, have to be preferred in selecting the proper satellite technology to be employed for this purpose.
Although none of the currently available Earth Observation satellite sensors has been primarily designed for gas flaring observation, several systems have a capability
10
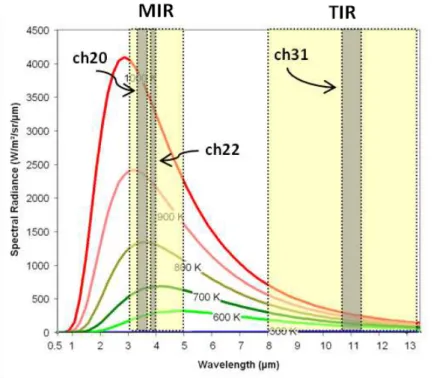
to indirectly detect gas flares, based on the radiative emissions of sources (Elvidge et al., 2007). Gas flares are point-sources of persistent fire activity, occurring with high percent frequency and lower average Fire Radiative Power (FRP)/km2values than other fire types (Elvidge et al., 2011). Being objects with a high temperature (>800 K), they radiate at all wavelengths of the electromagnetic spectrum. In particular, as shown
15
in Fig. 1, the higher temperature of the body the higher total amount of the emitted ra-diation, according to the Plank’s law (area under the different curves in Fig. 1), while the wavelength relative to the peak of the maximum emission decreases inversely with temperature, according to the Wien’s “displacement” law.
The first satellite gas flaring survey, at global level, was assessed by the National
20
Oceanic and Atmospheric Administration (NOAA), with the aim to improve the reli-ability and consistency of gas flaring data, as part of the GGFR (Global Gas Flaring Reduction) partnership fostered by the World Bank in 2002. Firstly, the DMSP (Defense Meteorological Satellite Program) OLS (Operational Linescan System) data, acquired during the night in its very sensitive visible band (0.5 to 0.9 µm, at 2.7 km of spatial
res-25
NHESSD
2, 4101–4133, 2014A satellite-based analysis of the Val d’Agri (South of Italy) Oil Center gas flaring
emissions
M. Faruolo et al.
Title Page
Abstract Introduction
Conclusions References
Tables Figures
◭ ◮
◭ ◮
Back Close
Full Screen / Esc
Printer-friendly Version
Interactive Discussion
Discussion
P
a
per
|
Discus
sion
P
a
per
|
Discussion
P
a
per
|
Discussion
P
a
per
|
volumes at both national (about 60 countries worldwide, not including Italy) and global scale (Elvidge et al., 2009).
To overcome some shortcomings of such data (e.g. coarse spatial resolution, lim-ited dynamic range and lack of in-flight calibration, more detail in Elvidge et al., 2009), MODIS (Moderate Resolution Imaging Spectroradiometer) records, acquired
5
in medium (MIR) and thermal infrared (TIR) channels (at 1 km of spatial resolution) have been exploited. In particular, a combination between such bands was used. The MIR channels at 3–4 µm (i.e. bands 20 or 22) are more sensitive to the presence of high temperature sources (hot spots, fires or flares) than the thermal infrared bands (at 11–12 µm, i.e. channel 31) (Fig. 1). This is why the difference between Brightness
10
Temperatures (BT) in the MODIS MIR and TIR bands is generally suitable and largely used to identify possible hot sources (Flasse and Ceccato, 1996; Dehn et al., 2000; Wright et al., 2002; Giglio et al., 2003; Baldassarre et al., 2009; Van Manen and Dehn, 2009; Elvidge et al., 2011; Marchese et al., 2011, 2012; Steffke and Harris, 2011). In the last recent years, the NGDC (National Geophysical Data Center) suggested a pure
15
MIR-based MODIS algorithm for flare detection at night (using band 20 minus band 22) and characterization (Elvidge et al., 2011, 2012).
Since 2011, the NGDC staffhas been working on Visible Infrared Imaging Radiome-ter Suite (VIIRS) data, offering a substantial number of improvements over its pre-decessors in terms of spatial resolution (375–750 m), dynamic range, quantization,
20
calibrations and the availability of spectral bands suitable for discrimination of ther-mal sources. Based on these data, NGDC has developed a system called “Nightfire”, which detects and characterizes sub-pixel combustion sources worldwide using VIIRS night-time multispectral data. The utilized spectral bands span visible, near-infrared, short-wave infrared (SWIR) and MIR (Elvidge et al., 2013; NOAA-NGDC, 2013).
25
NHESSD
2, 4101–4133, 2014A satellite-based analysis of the Val d’Agri (South of Italy) Oil Center gas flaring
emissions
M. Faruolo et al.
Title Page
Abstract Introduction
Conclusions References
Tables Figures
◭ ◮
◭ ◮
Back Close
Full Screen / Esc
Printer-friendly Version
Interactive Discussion
Discussion
P
a
per
|
Discus
sion
P
a
per
|
Discussion
P
a
per
|
Discussion
P
a
per
|
These studies and pioneering works are generally developed to investigate gas flares at a global or country scale, analyzing multi-sources data-sets jointly and looking for major, very intense sources, characterized by large flares emissions (from few to some hundreds of BCM, Billion Cubic Meters per year) in countries where the gas re-injection or monetization is not provided. To our knowledge, no studies have been proposed up
5
to now to investigate, by satellite observations, a single gas flare source characterized by low/moderate emission rates (less than one million of cubic meters per year), trying to provide a comprehensive analysis of the source, from its thermal characterization to the estimation of flared gas volumes. This work moves in this direction because, for the first time, a satellite based analysis of waste flaring activity from a single on-shore
10
gas and oil pre-treatment plant (i.e. the Ente Nazionale Idrocarburi – ENI – Val d’Agri Oil Center – COVA), located in the Basilicata Region (South of Italy) with moderate emission rates (i.e. with flaring volumes emissions of some hundreds of thousands of cubic meters per year) was performed.
In detail, thirteen years of nighttime Aqua and Terra MODIS thermal data were
anal-15
ysed implementing the Robust Satellite Techniques (RST) approach (Tramutoli, 2005, 2007), with the aim to identify highly radiant records associated to the main blow down events (i.e. waste flaring) occurred at the COVA during the emergency discharges. Ex-ploiting the data provided by ENI about flares emission volumes between 2003 and 2009, a MODIS-based regression model, able to give reliable and independent
infor-20
mation on COVA flaring volumes emissions, was finally developed and tested.
2 The Val d’Agri Oil Center (COVA)
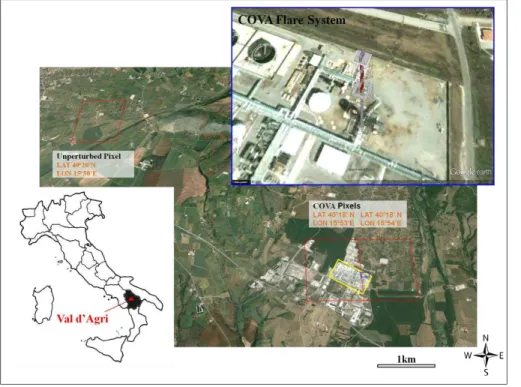
ENI, the largest Italian company producing oil and gas, is the operator of the Val d’Agri concession in the Basilicata Region. Its oil/gas gathering and treating center in such an area is the COVA plant (Fig. 2). It is located in the industrial area of Viggiano (PZ),
25
NHESSD
2, 4101–4133, 2014A satellite-based analysis of the Val d’Agri (South of Italy) Oil Center gas flaring
emissions
M. Faruolo et al.
Title Page
Abstract Introduction
Conclusions References
Tables Figures
◭ ◮
◭ ◮
Back Close
Full Screen / Esc
Printer-friendly Version
Interactive Discussion
Discussion
P
a
per
|
Discus
sion
P
a
per
|
Discussion
P
a
per
|
Discussion
P
a
per
|
It is worth noting that the COVA is not only the largest gas and oil pre-treatment plant in Italy but also the largest on-shore European reservoir, the only located in an anthropized area, characterized by a large environmental complexity, where naturalis-tic aspects coexist with anthropogenic activities, the last ones having potentially high environmental impacts. Besides, the considerable biodiversity which characterizes the
5
Val d’Agri is partly included in the protected area of the Appennino Lucano Val d’Agri Lagonegrese National Park.
COVA started to operate in 1996 with the name “Monte Alpi”; in the following years (from 2001 to 2006), with the upgrade of the production lines (from 1 to 5), it became the Val d’Agri Oil Center (i.e. COVA). Such a plant is aimed at the separation and the
10
further processing of the three phases present in the extracted fluid (crude oil, gas and water). In 2009 COVA infrastructures were modified to treat a higher gas amount, hav-ing also higher values of acidity and GOR (Gas Oil Ratio) (Rapporto Istruttorio, Regione Basilicata, 2011) as well as to optimize combustion processes. These recent upgrades modified the emission framework of the plant, compared to its original configuration
15
(Local Report ENI, 2012). The crude oil is extracted from 26 wells, currently in pro-duction in the area and conveyed to the COVA through about 100 km of pipelines. The nominal capacity of treatment authorized for the entire plant is equal to 16 500 m3day−1 of oil (corresponding to about 104 000 barrels day−1) and 3.1 million Sm3day−1 of as-sociated gas (to the crude oil). Oil produced is carried to ENI’s refinery in Taranto via
20
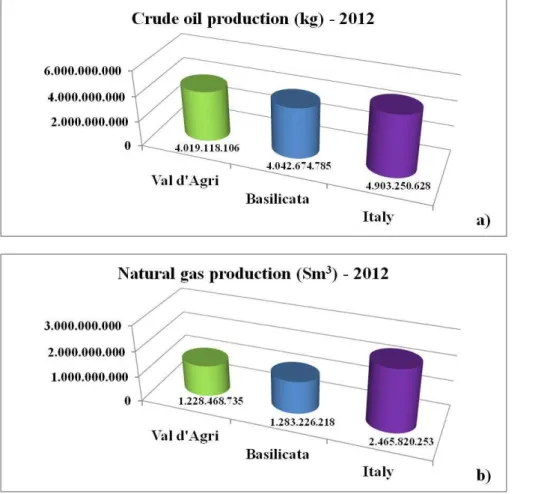
a 136 km long pipeline, while gas produced is treated at the COVA and then delivered to the SNAM (Società Nazionale Metanodotti) national grid system. To better understand the COVA entity at national scale, in Fig. 3 the 2012 COVA oil and gas productions are shown: the first one represents about the 82 % of the Italian amount (Fig. 3a) while the natural gas production is equal to the 50 % of the national one (Fig. 3b).
NHESSD
2, 4101–4133, 2014A satellite-based analysis of the Val d’Agri (South of Italy) Oil Center gas flaring
emissions
M. Faruolo et al.
Title Page
Abstract Introduction
Conclusions References
Tables Figures
◭ ◮
◭ ◮
Back Close
Full Screen / Esc
Printer-friendly Version
Interactive Discussion
Discussion
P
a
per
|
Discus
sion
P
a
per
|
Discussion
P
a
per
|
Discussion
P
a
per
|
3 Data
In this section, all the data used in this work, both the satellite records and the validation data provided by ENI, are described.
It should be stressed that for the aims of this work, both satellite and in situ data, available at different temporal scales, were aggregated on an annual basis,
accord-5
ing to all literature studies devoted to the gas flaring volumes estimation by satellite (Elvidge et al., 2009, 2011). Such works are focused on annual estimates of gas flared in order to monitor the trend of this phenomenon over the years, with the aim both of filling the gap about such data handled only by governments and petroleum companies and of better assessing the efficacy of efforts made to reduce it. This temporal
aggre-10
gation, although possibly affecting the accuracy of the regression model, allows us to reduce the observational issues (e.g. cloud cover, high satellite zenith angles) of the used satellite system.
3.1 MODIS data
In this study, images acquired during the night by MODIS sensors, aboard EOS (Earth
15
Observing System) Terra and Aqua satellites, passing over the area of interest between 20:00 GMT and 01:30 GMT were collected and processed. Specifically, the MODIS data multi-annual archive, available at the Institute of Methodologies for Environmental Analysis (IMAA) of the National Research Council (CNR), Tito Scalo (Italy), was used. The brightness temperature (BT) measured in the MODIS MIR and TIR bands, i.e.
20
channels 20 (3.660–3.840 µm), 22 (3.929–3.989 µm) and 31 (10.780–11.280 µm) (see Fig. 1), at 1 km of spatial resolution, were analyzed to identify major thermal emissions as well as to quantify the radiant energy emitted by the investigated pixels. In detail, multi-year datasets of MIR and TIR BTs measured from 2000 to 2012 (about 10 000 images) were created for three pixels: two covering the COVA site and one representing
25
NHESSD
2, 4101–4133, 2014A satellite-based analysis of the Val d’Agri (South of Italy) Oil Center gas flaring
emissions
M. Faruolo et al.
Title Page
Abstract Introduction
Conclusions References
Tables Figures
◭ ◮
◭ ◮
Back Close
Full Screen / Esc
Printer-friendly Version
Interactive Discussion
Discussion
P
a
per
|
Discus
sion
P
a
per
|
Discussion
P
a
per
|
Discussion
P
a
per
|
the contribution of both these two pixels was taken into account in the study. Besides, the response of an unperturbed area, i.e. not impacted by the presence of industrial facilities (Fig. 2), was investigated to better assess the accuracy and the reliability of the proposed methodology in characterizing the thermal activity at COVA site. The unperturbed pixel is located in slight N–W direction, about 6 km far from the COVA,
5
and it is a predominantly vegetated area, which ensures that no adverse impacts to environment due to anthropogenic activities can modify its spectral response. To better assess the effectiveness of such a choice the range correlation analysis suggested by Noguchi et al. (2011) was computed. Achieved results show that, for all the 13 investigated years,ρis lower than 0.95, confirming the effectiveness of this selection.
10
For each year and each day of the year the BT values in MIR and TIR channels for the three investigated pixels were extracted; data were analyzed on an annual basis, considering only cloud free records (Cuomo et al., 2004; Pietrapertosa et al., 2001) acquired at a zenith angle lower than 40◦(to reduce the impact of the re-sampling and path radiance effects). After the cloud and the zenith angle filters application, 7 200
15
values (as the sum of those acquired in bands 20, 22 and 31) were finally analyzed for each pixel.
3.2 ENI data
To support this research activity, ENI provided data about: (i) gas (Standard cubic me-ter, Sm3, daily values) and (ii) oil (m3and barrel, daily values) production from 2000 to
20
2012, (iii) gas flaring emissions from 2003 to 2009 (monthly values in Sm3).
In detail, in reference to the gas flaring volumes, the flare system at COVA (consisting of three elevated flares and one on the ground, see Fig. 2) is used for emergency discharges to burn the gas excess sent to the flares as well as during normal operations for ensuring the safety of the plant (Local Report ENI, 2012). Note that the volumes
25
NHESSD
2, 4101–4133, 2014A satellite-based analysis of the Val d’Agri (South of Italy) Oil Center gas flaring
emissions
M. Faruolo et al.
Title Page
Abstract Introduction
Conclusions References
Tables Figures
◭ ◮
◭ ◮
Back Close
Full Screen / Esc
Printer-friendly Version
Interactive Discussion
Discussion
P
a
per
|
Discus
sion
P
a
per
|
Discussion
P
a
per
|
Discussion
P
a
per
|
4 The methodology
Literature papers on gas flaring with MODIS data suggested the use of BT difference between channel 22 (more recently channel 20, Elvidge et al., 2012) and channel 31 (e.g. Elvidge et al., 2009, 2011) (gray bars in Fig. 1 enhance their spectral location) to discriminate flares presence and quantify their radiant energy. In particular, Elvidge
5
et al. (2012) proposed the use of MODIS channel 20 rather than channel 22 for improv-ing the discrimination between different types of hot sources as it is more sensitive to the presence of emitting bodies at very high temperatures.
Generally speaking values of the MIR-TIR BT difference greater than 5 K have been arbitrarily defined as thermal anomalies of the investigated signal and used in literature
10
to discriminate the presence of hot sources at night (Flasse and Ceccato, 1996; Dehn et al., 2000; Wright et al., 2002; Giglio et al., 2003; Kervyn et al., 2006; Van Manen and Dehn, 2009; Elvidge et al., 2011; Steffke and Harris, 2011). In contrast to such fixed threshold methods, in this paper an automatic change detection scheme (named RST, i.e. “Robust Satellite Techniques”, Tramutoli, 2005, 2007), based on the analysis
15
of multi-year series of satellite data, co-located in the space time domain, is used. The RST methodology may assure, in fact, an automatic and reliable identification of highly radiant values associated to the flaring of gas. In detail, the methodology implemented to define a satellite based regression model for estimating the gas flaring volumes emitted by the COVA in emergency conditions (i.e. waste flaring) was based on the
20
following steps:
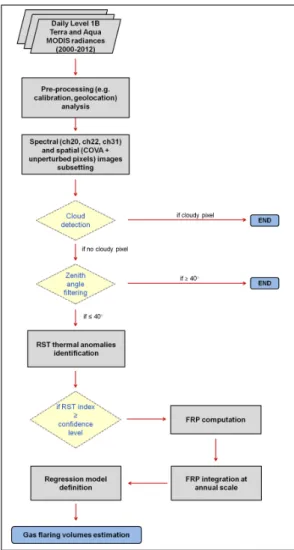
1. pre-processing (e.g. calibration, geolocation) and analysis (e.g. cloud detection, zenith angle filtering) of MIR (channels 20 and 22) and TIR (channel 31) MODIS radiances between 2000 and 2012;
2. implementation of the RST approach to select the highly radiant records
asso-25
NHESSD
2, 4101–4133, 2014A satellite-based analysis of the Val d’Agri (South of Italy) Oil Center gas flaring
emissions
M. Faruolo et al.
Title Page
Abstract Introduction
Conclusions References
Tables Figures
◭ ◮
◭ ◮
Back Close
Full Screen / Esc
Printer-friendly Version
Interactive Discussion
Discussion
P
a
per
|
Discus
sion
P
a
per
|
Discussion
P
a
per
|
Discussion
P
a
per
|
“anomalous” thermal emissions, i.e. the ones which are likely to be associated to the main flaring events;
3. computation of the FRP for the anomalous records previously identified by RST;
4. FRP correlation with the actual gas flaring volumes (provided by ENI) to define a MODIS-based regression model for an indirect estimation of COVA gas flaring
5
emitted volumes.
Figure 4 shows the flowchart of the developed methodology.
4.1 The RST approach
The Robust Satellite Techniques approach is a change detection scheme, based on the analysis of multi-year series of satellite data acquired in homogeneous spatio-temporal
10
conditions (i.e. same geographic area, same month and hour of acquisitions) for a pre-vious characterization of the signal to investigate (V(x,y,t)) in terms of expected value and natural variability (i.e. the “reference fields”) for those specific conditions. Such reference fields are usually expressed by the monthly temporal mean µV(x,y) and the standard deviationσV(x,y)of the signalV and are computed, for each pixel of the scene,
15
processing all cloud-free records and removing, by an automatic and iterative proce-dure, outliers from the series (Tramutoli, 2005).
Signal anomalies are automatically identified in the space-time domain by the ALICE (Absolutely Llocal Index of Change of the Environment) index, defined as follows:
⊗V (x,y,t)≡V (x,y,t)
−µV(x,y)
σV(x,y) (1)
20
which provides, at pixel level, a measure of the deviation of the recorded signalV(x,y,t) from its expected (in unperturbed or normal conditions) value (µV) and automatically
NHESSD
2, 4101–4133, 2014A satellite-based analysis of the Val d’Agri (South of Italy) Oil Center gas flaring
emissions
M. Faruolo et al.
Title Page
Abstract Introduction
Conclusions References
Tables Figures
◭ ◮
◭ ◮
Back Close
Full Screen / Esc
Printer-friendly Version
Interactive Discussion
Discussion
P
a
per
|
Discus
sion
P
a
per
|
Discussion
P
a
per
|
Discussion
P
a
per
|
noise sources not related to the event to be monitored. The signalV(x,y,t) to be ana-lyzed is chosen according to the phenomenon to be studied and may correspond to the measurement made in a single spectral band or can derive from a proper combination of several channels (Tramutoli, 1998).
For its construction, the ALICE index is a standardized variable characterized by
5
a Gaussian behavior (i.e. with mean equal to zero and standard deviation equal to 1). This means that the probability of occurrence of values higher than ±2 standard deviation is less than 2.28 % and it becomes lower than 0.13 % for values higher than 3.
The RST approach has been largely used in the past to study several environmental
10
phenomena and, in particular to investigate sources at high temperature, characterized by a 1-D, time dependent, distribution (e.g. volcanoes) and a 2-D dependence, in both the space and time domains (e.g. fires) (Baldassarre et al., 2009; Filizzola et al., 2010; Marchese et al., 2011, 2012).
For studying the gas flaring phenomenon, following the indications of Elvidge
15
et al. (2009, 2011, 2012), the signals to investigate are the combinations MIR22−TIR31 and MIR20−TIR31, so two ALICE indices were defined and analyzed:
⊗20–31(x,y,t)=BT20–31(x,y,t)
−µ20–31(x,y)
σ20–31(x,y)
(2)
⊗22–31(x,y,t)=BT22–31(x,y,t)
−µ22–31(x,y)
σ22–31(x,y)
(3)
20
Generally, for both the indices, high values are expected to be detected in presence of significantly (on a statistic basis) anomalous hot spots. Considering that the COVA is a stable source, persistent in space and time, ALICE indices are not expected to reach very high levels in case of normal operation of the flare system. On the other hand, the highest ALICE index values should be related to the most highly radiant records
25
NHESSD
2, 4101–4133, 2014A satellite-based analysis of the Val d’Agri (South of Italy) Oil Center gas flaring
emissions
M. Faruolo et al.
Title Page
Abstract Introduction
Conclusions References
Tables Figures
◭ ◮
◭ ◮
Back Close
Full Screen / Esc
Printer-friendly Version
Interactive Discussion
Discussion
P
a
per
|
Discus
sion
P
a
per
|
Discussion
P
a
per
|
Discussion
P
a
per
|
generally associated to these anomalous situations). Therefore, from this point of view, the COVA represents a significantly different hot source compared to previous RST applications. Thus, in order to study the ALICE index behaviors for such a source and to investigate the reliability of this approach to describe the flaring phenomenon eight values of both the ALICE indices, from 1.0 up to 4.5 (with an increase of 0.5), were
5
analyzed.
As a first step, the two investigated signals (Eqs. 2 and 3) were analyzed both for the COVA and the unperturbed pixel in order to verify their capability in detecting and characterizing the investigated phenomenon. In detail, the behavior of the two signals for the unperturbed pixel was analyzed to define the residual error (i.e. false
posi-10
tives) for each index. It means that the same analysis carried out for the COVA site was carried out also for the unperturbed one, for which, obviously, no (or residual) anthropogenic thermal anomalies are expected. The possible error committed during the identification of thermal anomalies at COVA (false identifications, i.e. local warming effects not related to industrial processes) was then computed as the percentage of
15
thermal anomalies identified over the unperturbed pixel at a specific confidence level (c) of the investigated index.
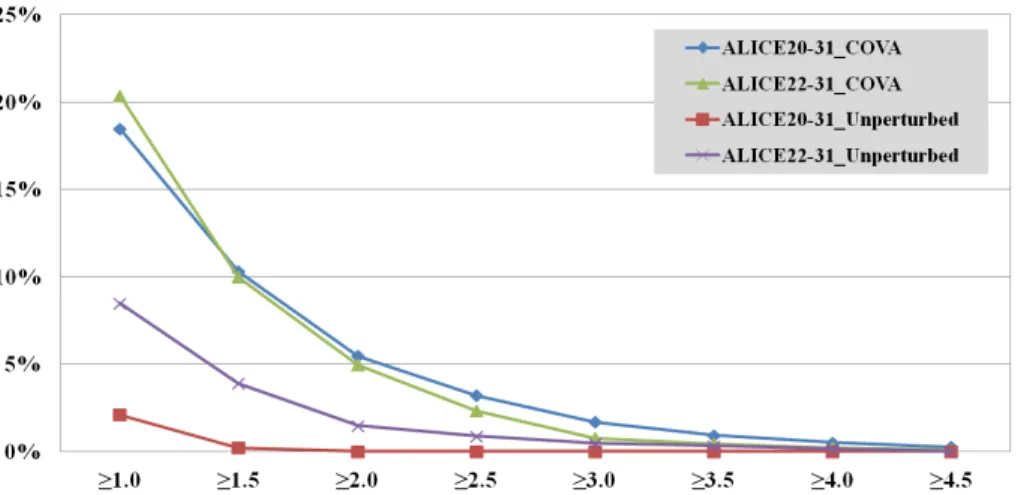
Figure 5 describes the occurrence (in percentage respect to the total number of ana-lyzed images) of thermal anomalies detected over both the COVA and the unperturbed pixels. Results achieved by using the two ALICE indices, at all the different selected
20
confidence levels, are reported.
Looking at the Fig. 5, some considerations can be done:
– regarding the COVA pixel, as expected, a higher number of thermal anomalies is detected compared to the unperturbed pixel, regardless the ALICE index and the confidence level used;
25
NHESSD
2, 4101–4133, 2014A satellite-based analysis of the Val d’Agri (South of Italy) Oil Center gas flaring
emissions
M. Faruolo et al.
Title Page
Abstract Introduction
Conclusions References
Tables Figures
◭ ◮
◭ ◮
Back Close
Full Screen / Esc
Printer-friendly Version
Interactive Discussion
Discussion
P
a
per
|
Discus
sion
P
a
per
|
Discussion
P
a
per
|
Discussion
P
a
per
|
– concerning the unperturbed pixel, a more distinctive behavior of the two indices is instead observed, with a more reliable character of the ALICE20–31which, already atc=1.5 and differently by the ALICE22–31, shows very low rates of false posi-tives. However, it should be stressed that the absolute maximum percentage of false identifications is 8.4 % (observed for MIR22−TIR31at the lowest confidence
5
level, confirming the high reliability of the RST approach);
– in general, a clear discrimination between the two sources can be observed at the lowest confidence levels of both the ALICE indices (i.e. between 1.0 and 2.0) as, for ALICE≥2.5, the number of thermal anomalies detected for both the pixels is very low. This circumstance, while obvious for the unperturbed pixel, for the COVA
10
is likely to be ascribed to the stability of the thermal source.
In conclusion, this analysis reveals:
– in terms of ALICE indices: the most suitable index for studying the COVA flaring is the ALICE20–31 (Eq. 2), because the rate of possible “false positives” is very low (i.e. less than 2.7 %), at whateverc≥1.0 (high reliability). Moreover, such an
15
index shows a better sensitivity than the other one in identifying instances at very high temperatures (high sensitivity).
– in terms of confidence levels: the best confidence level range is between 1.5 and 2.0, where the best trade-offbetween statistical population and reliability seems to be assured.
20
Concerning the sources of thermal anomalies identified over the unperturbed pixel, apart from local warning effects, they could be related to: (i) clouds edges not correctly identified by the cloud masking procedure; (ii) low quality data; (iii) possible fires oc-curred in the area. Although fires can be considered “actual” thermal anomalies, not having any independent and reliable information about their possible occurrence in
25
NHESSD
2, 4101–4133, 2014A satellite-based analysis of the Val d’Agri (South of Italy) Oil Center gas flaring
emissions
M. Faruolo et al.
Title Page
Abstract Introduction
Conclusions References
Tables Figures
◭ ◮
◭ ◮
Back Close
Full Screen / Esc
Printer-friendly Version
Interactive Discussion
Discussion
P
a
per
|
Discus
sion
P
a
per
|
Discussion
P
a
per
|
Discussion
P
a
per
|
providing a more conservative analysis. Therefore, the analysis seems to suggest that, with the chosen ALICE index and confidence levels, a maximum residual error of about 3 % in hot spot detection should be accounted for.
To better assess the nature of the detected hot spots and to verify their possible relationship with COVA plant operations and combustion processes, the excess of
ra-5
diance (defined as the numerator in Eq. (2), i.e. the difference between the measured MIR20−TIR31 and the mean value expected to be observed for such a band combi-nation in normal conditions) was computed for the identified “hot” pixels (i.e. the ones having values of ALICE20–31≥1.5/2.0). In detail, as before explained (see Sect. 3.1), being the COVA plant inside two MODIS pixels (Fig. 2), for the computation of the
ex-10
cess of radiance, the contributions of both were summed only when both ALICE20–31 were over 1.5 (or 2.0) (in 3 % and 1 % of cases, respectively), otherwise only the one over the selected confidence level has been considered.
Such excesses were then aggregated at annual basis, providing one value for each year from 2000 to 2012. Afterwards, a correlation analysis was carried out comparing
15
achieved satellite-based radiance values with data provided by ENI about gas and oil production.
In Fig. 6 the excess of radiance computed for the two levels of confidence of ALICE20–31 is reported, together with the COVA gas (in Sm
3
) and oil (m3) production values between 2000 and 2012 (histogram bars).
20
Firstly, observing temporal trends shown in Fig. 6, it is evident the good agreement between production and satellite data as well as a lower radiant power for COVA esti-mated for the year 2012 by satellite analyses, despite a gas and oil production higher than the one of the previous years. Such aspect can be explained considering the his-tory of the COVA production. About gas (Fig. 6a), an increasing production is observed
25
NHESSD
2, 4101–4133, 2014A satellite-based analysis of the Val d’Agri (South of Italy) Oil Center gas flaring
emissions
M. Faruolo et al.
Title Page
Abstract Introduction
Conclusions References
Tables Figures
◭ ◮
◭ ◮
Back Close
Full Screen / Esc
Printer-friendly Version
Interactive Discussion
Discussion
P
a
per
|
Discus
sion
P
a
per
|
Discussion
P
a
per
|
Discussion
P
a
per
|
2011 the two productions seem to flatten out (both growing up with the same relative increase), while in 2012, compared with the immediately previous years, the gas in-creases with a rate higher than the one observed for the oil, because of the higher GOR of the produced hydrocarbons. Since 2011, the facilities of COVA have been affected by a series of adaptation and modernization activities (Rapporto Istruttorio,
5
Regione Basilicata, 2011), still in progress, aimed at treating the crude extracted show-ing different chemical and physical properties (higher acid content and GOR). Such operations, obviously, have modified the emission framework of the plant, compared to its original configuration, resulting in lower emissions of some pollutants like CO2and NOxand in a better management of emergency operations (Local Report ENI, 2012).
10
About the results referred to the correlation analyses between the two data series, the computed correlation coefficients (R) are reported in Table 1.
TheRvalues reported in Table 1 show that, for both the considered ALICE levels, the thermal radiative power of COVA, identified by RST and characterized in terms of the BT excess, is well correlated with the production chains of the plant (both in terms of
15
oil and gas productions). In particular, the records selected at ALICE20–31≥1.5 show the highest correlation coefficients, withRequal to 0.84. So that the main conclusion of this analysis is that the RST approach, by using the ALICE20–31 index at values≥1.5, allowed to select thermal features that, with a high level of accuracy and reliability, are likely to be associated to the COVA production chains. Therefore, thermal emissions
20
selected, in this way, using RST, can be further used to better characterize the source in terms of gas emissions due to the flaring operations.
4.2 The FRP computation
To quantify the radiative energy emitted by the COVA during the flaring activity the FRP was computed using the simplified formula proposed by Kaufman et al. (1998).
25
NHESSD
2, 4101–4133, 2014A satellite-based analysis of the Val d’Agri (South of Italy) Oil Center gas flaring
emissions
M. Faruolo et al.
Title Page
Abstract Introduction
Conclusions References
Tables Figures
◭ ◮
◭ ◮
Back Close
Full Screen / Esc
Printer-friendly Version
Interactive Discussion
Discussion
P
a
per
|
Discus
sion
P
a
per
|
Discussion
P
a
per
|
Discussion
P
a
per
|
1998):
FRP=4.34×10⁻¹⁹T8 4−T
8 4b
[W m−2
] (4)
whereT4andT4bare the brightness temperatures (K) measured in the 4 µm, MIR region (i.e. band 22, although band 21 is used when band 22 saturates) for the target (i.e. the
5
COVA, in this case) and the background pixels, respectively. The constant in Eq. (4) is derived empirically for the spectral interval of MODIS channel 21–22 (Kaufman et al., 1998). The empirical derivation of Eq. (4) is valid for FRP retrievals of hotspots with flaming temperatures ranging from 600 to 1500 K (Wooster et al., 2003).
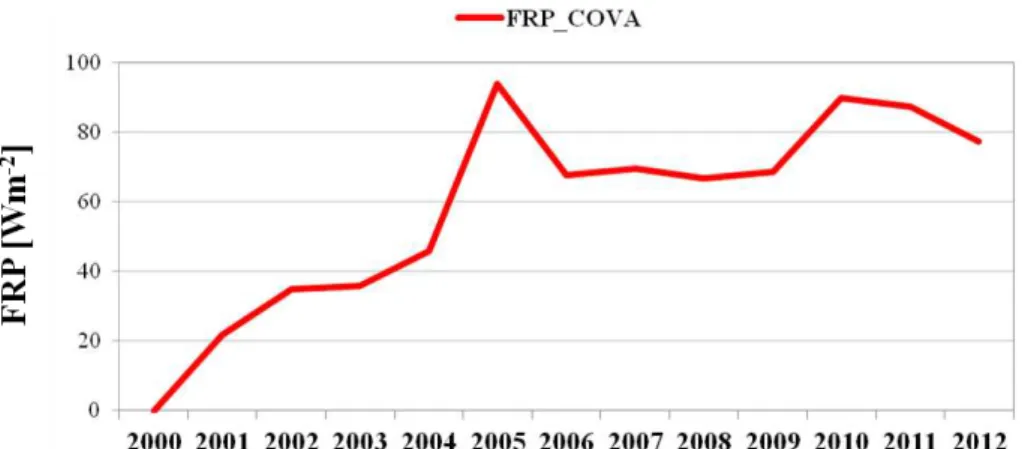
In this paper, the FRP (Eq. 4) was computed for the thermal anomalies previously
10
identified implementing ALICE20–31≥1.5, in the period 2000–2012, again aggregating values annually. To define the mean radiance of the neighboring pixels, images having at least 50 % of clear pixels in the box surrounding the COVA were taken into account. The FRP temporal trend is reported in Fig. 7, where a clear increasing trend of FRP from 2000 to 2005 can be noted, with a maximum measured in 2005; in the following
15
years, until 2012, FRP seems to be quite stable in time, with a mean value around 80 W m−2.
4.3 The flaring regression model
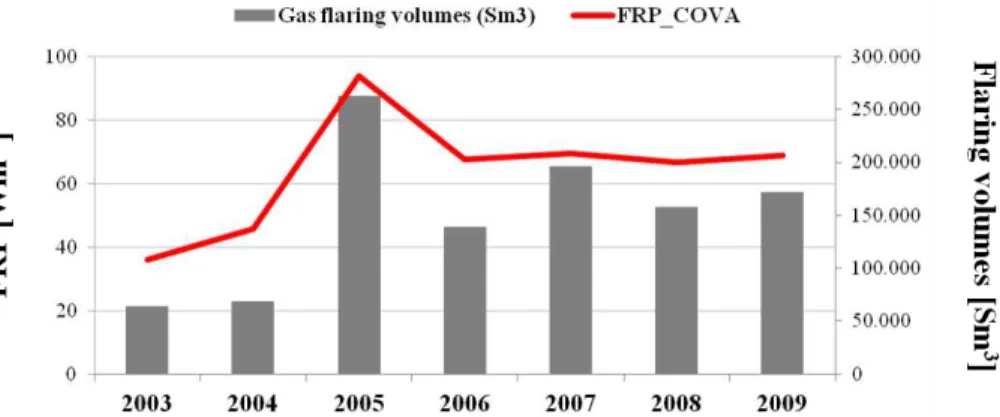
As previously explained (see Sect. 3.2), ENI provided data about the volumes of gas flared associated to the main blow down events (i.e. waste flaring) occurred between
20
2003 and 2009. Satellite-based FRPs were then correlated with waste flaring volumes, for the whole temporal range they were available. In Fig. 8 the temporal behavior of the two observables is shown. Looking at the figure, a pretty good correlation seems to appear and, in fact, a linear correlation coefficient equal to 0.97 was obtained.
On these bases, a MODIS-based linear regression model (with an imposed zero
25
NHESSD
2, 4101–4133, 2014A satellite-based analysis of the Val d’Agri (South of Italy) Oil Center gas flaring
emissions
M. Faruolo et al.
Title Page
Abstract Introduction
Conclusions References
Tables Figures
◭ ◮
◭ ◮
Back Close
Full Screen / Esc
Printer-friendly Version
Interactive Discussion
Discussion
P
a
per
|
Discus
sion
P
a
per
|
Discussion
P
a
per
|
Discussion
P
a
per
|
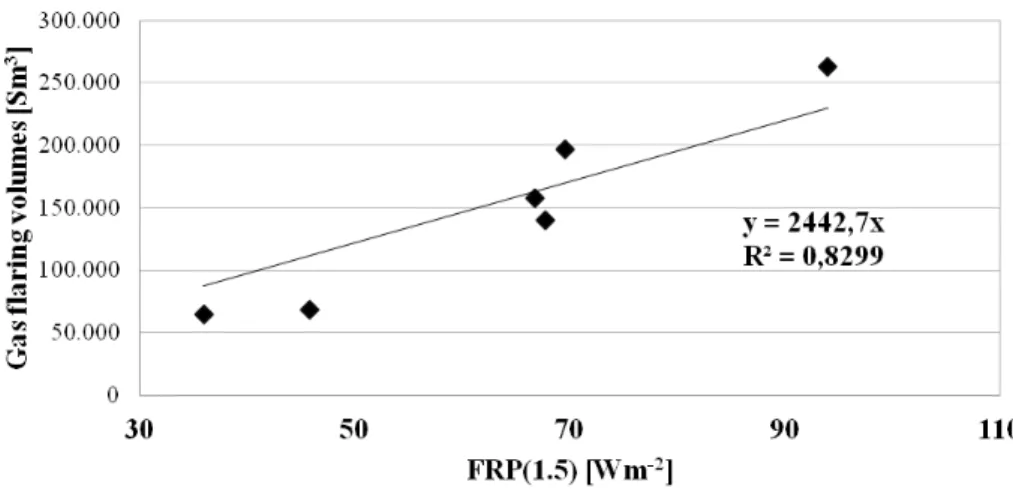
estimate the flaring emitted in 2009. The regression model (see Fig. 9) is:
Gas Flared Volumes (Sm3)=2442.7×FRP(1.5)
where FRP(1.5) is the FRP computed over thermal anomalies identified for the COVA implementing the ALICE20–31≥1.5. The derivedR
2
is 0.83 (Fig. 9).
By exploiting the COVA FRP derived from satellite for 2009 (69 W m−2), the gas
flar-5
ing volume emitted for the same year was estimated by applying the above defined model and compared with the true value provided by ENI. Using the regression model, a volume of gas flared in 2009 was estimated equal to 167 854 Sm3. This should be compared to the actual value which, according to ENI measurements, is 171 759 Sm3. Therefore, the satellite derived waste flaring is underestimating the real measurement
10
of about 2 %. Considering all the possible limits (e.g. temporal sampling, spatial reso-lution) and noise contributions (e.g. clouds, residual false positives/negatives, missing data) of the satellite observations as well as that the analysis is referred to nighttime conditions, the achieved results encourage future investigations.
5 Conclusions
15
Recently, satellite-based methodologies have been developed to detect and monitor the flares and the emitted gas volumes, both at a global and country scale, mainly focusing on sources characterized by relatively large flares emissions (from a few to some hundreds of BCM).
In this paper a satellite based analysis of flaring activity of the on-shore crude oil
20
pre-treatment plant (i.e. the ENI Val d’Agri Oil Center, COVA), located in the Basilicata Region (South of Italy), characterized by low/moderate emission rates (less than one million of cubic meters), mainly due to emergency depressurization, was assessed. To this aim, thirteen years of MODIS data, acquired in its medium and thermal in-frared bands were processed. The RST approach was implemented for the first time to
NHESSD
2, 4101–4133, 2014A satellite-based analysis of the Val d’Agri (South of Italy) Oil Center gas flaring
emissions
M. Faruolo et al.
Title Page
Abstract Introduction
Conclusions References
Tables Figures
◭ ◮
◭ ◮
Back Close
Full Screen / Esc
Printer-friendly Version
Interactive Discussion
Discussion
P
a
per
|
Discus
sion
P
a
per
|
Discussion
P
a
per
|
Discussion
P
a
per
|
analyze such kind of phenomenon, allowing to select the highly radiant records (com-pared to the normal behaviour of the plant), which can be associated to the COVA flares emergency discharges. Once identified these anomalous values, the emitted en-ergy was estimated through the FRP to quantify the COVA radiant power during these emergency flaring activities. Using such a parameter and exploiting the data provided
5
by ENI about the volumes of gas flared in emergency conditions (i.e. waste flaring) occurred between 2003 and 2009, a MODIS-based regression model was defined for the COVA source and a very accurate estimation of gas flared in 2009 was obtained (error of about 2 %).
The achieved results are unique for the investigated area. They represent the first
10
independent analysis of the area by using satellite data; in addition, they highlight the reliability of the proposed methodology for a thermal characterization of the site, with reference to the emergency flaring activity. Such outcomes are much more significant considering that the COVA, in contrast to most of similar industrial plants, is located inside a natural park, in an area (i.e. the Val d’Agri) where the main activities are based
15
on agriculture and farming.
Starting from the very satisfactory results carried out by these preliminary analyses, further studies will be carried out in order to test the reliability and accuracy of the proposed methodology in estimating gas flared volumes of other worldwide oil plants, provided that in situ data (i.e. gas flaring volumes) are available. Besides, thanks to
20
the intrinsic exportability of the RST algorithm on whatever satellite system and geo-graphic area, also the performances of new generation satellite data (i.e. VIIRS) will be investigated. Moreover, the capability of the proposed RST configuration in daytime conditions to detect and characterize such combustion source will be also tested. In addition, the already proposed RST configuration for hot spot detection (i.e. RSTVOLC)
25
will be tested and possibly adapted to this specific phenomenon.
NHESSD
2, 4101–4133, 2014A satellite-based analysis of the Val d’Agri (South of Italy) Oil Center gas flaring
emissions
M. Faruolo et al.
Title Page
Abstract Introduction
Conclusions References
Tables Figures
◭ ◮
◭ ◮
Back Close
Full Screen / Esc
Printer-friendly Version
Interactive Discussion
Discussion
P
a
per
|
Discus
sion
P
a
per
|
Discussion
P
a
per
|
Discussion
P
a
per
|
system, to promptly identify anomalous event at COVA and activate intensive monitor-ing surveys and campaigns.
Acknowledgements. This work has been carried out in the framework of the scientific agree-ment among Basilicata Region, the National Research Council – Institute of Methodologies for Environmental Analysis and the Osservatorio Ambientale Val d’Agri.
5
The authors would like to thank Eng. Vincenzo Lisandrelli, from the ENI S.p.A Divisione E&P Distretto di Produzione Val d’Agri for having provided data about the Val d’Agri Oil Center production.
References
Baldassarre, G., Benigno, G., Corrado, R., Coviello, I., Filizzola, C., Lacava, T., Marchese, F.,
10
Mazzeo, G., Paciello, R., Pergola, N., Sannazzaro, F., Serio, S., and Tramutoli, V.: Assess-ment of the Robust Satellite Technique (RST) in real time detection of summer fires, Fifth International Workshop on the Analysis of Multitemporal Remote Sensing Images (Multi-Temp), 216–223, 2009.
Casadio, S., Arino, O., and Serpe, D.: Gas flaring monitoring from space using the ATSR
in-15
strument series, Remote Sens. Environ., 116, 239–249, 2012a.
Casadio, S., Arino, O., and Minchella, A.: Use of ATSR and SAR measurements for the moni-toring and characterisation of night-time gas flaring from off-shore platforms: the North Sea test case, Remote Sens. Environ., 123, 175–186, 2012b.
Cholakov, G. S.: Control of pollution in the petroleum industry, Pollution Control Technologies,
20
III, 86–107, 2009.
Croft, T. A.: Night-time images of the earth from space, Sci. Am., 239, 68–79, 1978.
Cuomo, V., Filizzola, C., Pergola, N., Pietrapertosa, C., and Tramutoli, V.: A self-sufficient ap-proach for GERB cloudy radiance detection, Atmos. Res., 72, 39–56, 2004.
Dehn, J., Dean, K. G., and Engle, K.: Thermal monitoring of North Pacific volcanoes from
25
space, Geology, 28, 755–758, 2000.
NHESSD
2, 4101–4133, 2014A satellite-based analysis of the Val d’Agri (South of Italy) Oil Center gas flaring
emissions
M. Faruolo et al.
Title Page
Abstract Introduction
Conclusions References
Tables Figures
◭ ◮
◭ ◮
Back Close
Full Screen / Esc
Printer-friendly Version
Interactive Discussion
Discussion
P
a
per
|
Discus
sion
P
a
per
|
Discussion
P
a
per
|
Discussion
P
a
per
|
Elvidge, C. D., Imhoff, M. L., Baugh, K. E., Hobson, V. R., Nelson, I., Safran, J., Dietz, J. B., and Tuttle, B. T.: Night-time lights of the world: 1994–1995, ISPRS J. Photogramm., 56, 81–99, 2001.
Elvidge, C. D., Baugh, K. E., Tuttle, B. T., Howard, A. T., Pack, D. W., Milesi, C., and Erwin, E. H.: A twelve year record of national and global gas flaring volumes estimated using satellite data,
5
Final report to the World Bank, available at: http://siteresources.worldbank.org/INTGGFR/ Resources/DMSP_flares_20070530_b-sm.pdf, 2007.
Elvidge, C. D., Ziskin, D., Baugh, K. E., Tuttle, B. T., Ghosh, T., Pack, D. W., Erwin, E. H., and Zhizhin, M.: A fifteen year record of global natural gas flaring derived from satellite data, Energies, 2, 595–622, 2009.
10
Elvidge, C. D., Baugh, K. E., Anderson, S., Ghosh, T., and Ziskin, D.: Estimation of gas flar-ing volumes usflar-ing NASA MODIS fire detection products, NOAA National Geophysical Data Center (NGDC), annual report, 2011.
Elvidge, C. D., Baugh, K. E. Hsu, F. C, Zhizhin, M., and Ghosh, T.: Improving global observa-tions of gas flares with data from the suomi NPP Visible Infrared Imaging Radiometer Suite
15
(VIIRS), GGFR global forum London, 24 and 25 October 2012.
Elvidge, C. D., Zhizhin, M., Hsu, F. C. and Baugh, K. E.: VIIRS Nightfire: satellite pyrometry at night, Remote Sens., 5, 4423–4449, doi:10.3390/rs5094423, 2013.
Environmental Protection Agency (EPA): Oil and Natural Gas Air Pollution Standards, Basic Information, available at: http://www.epa.gov/airquality/oilandgas/basic.html, 2012.
20
Filizzola, C., Baldassarre, G., Benigno, G., Corrado, R., Coviello, I., Lacava, T., Marchese, F., Mazzeo, G., Paciello, R., Pergola, N., Sannazzaro, F., Serio, S., and Tramutoli, V.: Automatic RST-based system for a rapid detection of fires, in: Proceedings of the VI International Con-ference on Forest Fire Research (ICFFR), edited by: Viegas, D. X., 43 pp. (proceeding of 15 pages), 2010.
25
Flasse, S. P. and Ceccato, P.: A contextual algorithm for AVHRR fire detection, Int. J. Remote Sens., 17, 419–424, doi:10.1080/01431169608949018, 1996.
Giglio, L., Descloitres, J., Justice, C. O., and Kaufman, Y.: An enhanced contextual fire detection algorithm for MODIS, Remote Sens. Environ. 87, 273–282, 2003.
Ismail, O. S. and Umukoro, G. E.: Global impact of gas flaring, Energy and Power Engineering,
30
NHESSD
2, 4101–4133, 2014A satellite-based analysis of the Val d’Agri (South of Italy) Oil Center gas flaring
emissions
M. Faruolo et al.
Title Page
Abstract Introduction
Conclusions References
Tables Figures
◭ ◮
◭ ◮
Back Close
Full Screen / Esc
Printer-friendly Version
Interactive Discussion
Discussion
P
a
per
|
Discus
sion
P
a
per
|
Discussion
P
a
per
|
Discussion
P
a
per
|
Kaufman, Y. J., Justice, C. O., Flynn, L. P., Kendall, J. D., Prins, E. M., Giglio, L.,Ward, D. E., Menzel, W. P., and Setzer, A. W.: Potential global fire monitoring from EOS-MODIS, J. Geo-phys. Res., 103, 32215–32238, 1998.
Kervyn, M., Harris, A., Mbede, E., Belton, F., Jacobs, P., and Ernst, G. G. J.: MODLEN: a semi automated algorithm for monitoring small-scale thermal activity at Oldoinyo Lengai Volcano,
5
Tanzania, Quantitative Geology from Multiple Sources, IAMG Annual Conference, Extended abstract with conference volume, Liège 3–8 September 2006.
Local Report Ente Nazionale Idrocarburi (ENI) in Basilicata: Eni in Basilicata, Lo-cal Report 2012, http://www.eni.com/it_IT/attachments/sostenibilita/impegno-sostenibilita/ eni-in-basilicata.pdf, 2012 (in Italian).
10
Marchese, F., Filizzola, C., Genzano, N., Mazzeo, G., Pergola, N., and Tramutoli, V.: Assess-ment and improveAssess-ment of a Robust Satellite Technique (RST) for thermal monitoring of vol-canoes, Remote Sens. Environ., 115, 1556–1563, 2011.
Marchese, F., Lacava, T., Pergola, N., Hattori, K., Miraglia, E., and Tramutoli, V.: Inferring phases of thermal unrest at Mt. Asama (Japan) from infrared satellite observations, J. Volcanol.
15
Geotherm. Res., 237–238, 10–18, 2012.
Muirhead, K. and Cracknell, A. P.: Identification of gas flares in the North Sea using satellite data, Int. J. Remote Sens., 5, 199–212, doi:10.1080/01431168408948798, 1984.
NOAA-NGDC: VIIRS Nightfire – Nighttime Detection and Characterization of Combustion Sources, available at: http://ngdc.noaa.gov/eog/viirs/download_viirs_fire.html, 2013.
20
Noguchi, T., Ohno, N., Hattori, K., and Oyama, K.: Detection of thermal changes possibly asso-ciated with volcanic activity and discrimination of faint changes from MODIS, J. Asian Earth Sci., 41, 467–475, 2011.
Ohio Environmental Protection Agency (EPA): Exploration, Production and Processing of Oil and Natural Gas from the Marcellus and Utica Shales in Ohio, available at: http://www.epa.
25
state.oh.us/portals/0/General%20pdfs/gas%20flaring.pdf, 2012.
Pietrapertosa, C., Pergola, N., Lanorte, V., and Tramutoli, V.: Self Adaptive Algorithms for Change Detection: OCA (the One-channel Cloud-detection Approach) an adjustable method for cloudy and clear radiances detection, Technical Proceedings of the Eleventh International (A)TOVS Study Conference (ITSC-XI) BUDAPEST, HUNGARY 20–26 SEPTEMBER 2000,
30
NHESSD
2, 4101–4133, 2014A satellite-based analysis of the Val d’Agri (South of Italy) Oil Center gas flaring
emissions
M. Faruolo et al.
Title Page
Abstract Introduction
Conclusions References
Tables Figures
◭ ◮
◭ ◮
Back Close
Full Screen / Esc
Printer-friendly Version
Interactive Discussion
Discussion
P
a
per
|
Discus
sion
P
a
per
|
Discussion
P
a
per
|
Discussion
P
a
per
|
Rapporto Istruttorio Regione Basilicata: Dipartimento Ambiente, Territorio, Politiche della Sostenibilità “ALLEGATO 3” – artt. 29 quater e 29 sexies del Decreto Legislativo 3 aprile 2006 n◦ 152, Aggiornamento dell’ A. I. A. relativa all’impianto denominato “Centro Olio Val D’Agri”, 2011 (in Italian).
Steffke, A. M. and Harris, A. J.: A review of algorithms for detecting volcanic hot spots in satellite
5
infrared data, B. Volcanol., 73, 1109–1137, 2011.
Tramutoli, V.: Robust AVHRR Techniques (RAT) for environmental monitoring: theory and ap-plications, in: Earth Surface Remote Sensing II, edited by: Cecchi, G. and Zilioli, E., Proc. SPIE, 3496, 101–113, 1998.
Tramutoli, V.: Robust Satellite Techniques (RST) for natural and environmental hazards
monitor-10
ing and mitigation: ten years of successful applications, in: The 9th International Symposium on Physical Measurements and Signatures in Remote Sensing, edited by: Liang, S., Liu, J., Li, X., Liu, R., and Schaepman, M., ISPRS, Beijing, China, Vol. XXXVI (7/W20), 792–795, ISSN 1682–1750, 2005.
Tramutoli, V.: Robust Satellite Techniques (RST) for natural and environmental hazards
mon-15
itoring and mitigation: theory and applications, in: Fourth International Workshop on the Analysis of Multitemporal Remote Sensing Images, 18–20 July 2007, Louven, Belgium, doi:10.1109/MULTITEMP.2007.4293057, 2007.
Van Manen, S. M. and Dehn, J.: Satellite remote sensing of thermal activity at Bezymianny and Kliuchevskoi from 1993 to 1998, Geology, 37, 983–986, 2009.
20
Welch, R.: Monitoring urban population and energy utilization patterns from satellite data, Re-mote Sens. Environ., 9, 1–9, 1980.
Wooster, M. J., Shukiv, B., and Oertel, D.: Fire radiative energy for quantitative study of biomass burning: derivation from the BIRD experimental satellite and comparison to MODIS fire prod-ucts, Remote Sens. Environ., 86, 83–107, 2003.
25
World Bank: Global Gas Flaring Reduction, available at: http://web.worldbank.org/ WBSITE/EXTERNAL/TOPICS/EXTOGMC/EXTGGFR/0,,contentMDK:21023030~menuPK: 2856589~pagePK:64168445~piPK:64168309~theSitePK:578069,00.html, 2012.
Wright, R., Flynn, L., Garbeil, H., Harris, A., and Pilger, E.: Automated volcanic eruption detec-tion using MODIS, Remote Sens. Environ., 82, 135–155, 2002.
NHESSD
2, 4101–4133, 2014A satellite-based analysis of the Val d’Agri (South of Italy) Oil Center gas flaring
emissions
M. Faruolo et al.
Title Page
Abstract Introduction
Conclusions References
Tables Figures
◭ ◮
◭ ◮
Back Close
Full Screen / Esc
Printer-friendly Version
Interactive Discussion
Discussion
P
a
per
|
Discus
sion
P
a
per
|
Discussion
P
a
per
|
Discussion
P
a
per
|
Table 1. Correlation coefficients (R) between excess of radiance measured by satellite and COVA gas/oil production in the period 2000–2012.
R Radiance excess Radiance excess (ALICE20–31≥2.0) (ALICE20–31≥1.5) Gas production 84 % 84 %
NHESSD
2, 4101–4133, 2014A satellite-based analysis of the Val d’Agri (South of Italy) Oil Center gas flaring
emissions
M. Faruolo et al.
Title Page
Abstract Introduction
Conclusions References
Tables Figures
◭ ◮
◭ ◮
Back Close
Full Screen / Esc
Printer-friendly Version
Interactive Discussion
Discussion
P
a
per
|
Discus
sion
P
a
per
|
Discussion
P
a
per
|
Discussion
P
a
per
|
≥
NHESSD
2, 4101–4133, 2014A satellite-based analysis of the Val d’Agri (South of Italy) Oil Center gas flaring
emissions
M. Faruolo et al.
Title Page
Abstract Introduction
Conclusions References
Tables Figures
◭ ◮
◭ ◮
Back Close
Full Screen / Esc
Printer-friendly Version
Interactive Discussion
Discussion
P
a
per
|
Discus
sion
P
a
per
|
Discussion
P
a
per
|
Discussion
P
a
per
|