Proton magnetic resonance spectroscopy and perfusion
magnetic resonance imaging in the evaluation
of musculoskeletal tumors*
Espectroscopia de prótons e perfusão por ressonância magnética na avaliação dos tumores do sistema musculoesquelético
Flávia Martins Costa1, Evandro Miguelote Vianna2, Rômulo Côrtes Domingues2, Marcela Setti3, Walter Meohas4, José Francisco Rezende4, Romeu Côrtes Domingues5, Emerson Leandro Gasparetto6
OBJECTIVE: To assess the role of proton magnetic resonance spectroscopy and dynamic contrast-enhanced magnetic resonance imaging in the differentiation between malignant and benign musculoskeletal tumors. MATERIALS AND METHODS: Fifty-five patients with musculoskeletal tumors (27 malignant and 28 benign) were studied. The examinations were performed in a 1.5 T magnetic resonance scanner with standard protocol, and single voxel proton magnetic resonance spectroscopy with 135 msec echo time. The dynamic contrast study was performed using T1-weighted gradient-echo sequence after intravenous gadolinium injection. Time-signal intensity curves and slope values were calculated. The statistical analysis was performed with the Levene’s test, followed by a Student’s t-test, besides the Pearson’s chi-squared and Fischer’s exact tests. RESULTS: Proton magnetic resonance spectroscopy sensitivity, specificity and accuracy were, respectively, 87.5%, 92.3% and 90.9% (p < 0.0001). Statistically significant difference was observed in the slope (%/min) between benign (mean, 27.5%/min) and malignant (mean, 110.9%/min) lesions (p < 0.0001). CONCLUSION: The time-intensity curve and slope values using dynamic-enhanced perfusion magnetic resonance imaging in association with the presence of choline peak demonstrated by single voxel magnetic resonance spectroscopy study are useful in the differentiation between malignant and benign musculoskeletal tumors.
Keywords: Proton magnetic resonance spectroscopy; Perfusion magnetic resonance imaging; Magnetic resonance imaging.
OBJETIVO: Avaliar a espectroscopia de prótons e o estudo dinâmico do contraste por ressonância magné-tica na diferenciação dos tumores musculoesqueléticos benignos e malignos. MATERIAIS E MÉTODOS: Foram estudados 55 pacientes com tumores musculoesqueléticos (27 malignos e 28 benignos). Os exames foram realizados em aparelho de ressonância magnética de 1.5 T com protocolo convencional e espectroscopia de prótons com TE de 135 ms. O estudo dinâmico do contraste foi adquirido pela sequência T1 gradiente-eco após a administração intravenosa de gadolínio. Curvas de intensidade de sinal versus tempo e valores de slope
foram calculados. A análise estatística foi realizada pelo teste de Levene, seguido pelo teste t de Student, além dos testes qui-quadrado de Pearson e exato de Fischer. RESULTADOS: A sensibilidade, especificidade e acurácia da espectroscopia de prótons foram, respectivamente, de 87,5%, 92,3% e 90,9% (p < 0,0001). Além disso, houve significativa diferença entre o valor quantitativo da curva entre as lesões benignas (média de 27,5% por minuto) e malignas (média de 110,9% por minuto) (p < 0,0001). CONCLUSÃO: Os estudos quantitativo e qualitativo da análise dinâmica do contraste por ressonância magnética associados à presença do pico de colina são úteis na diferenciação dos tumores musculoesqueléticos em benignos e malignos. Unitermos: Espectroscopia de prótons; Perfusão; Imagem por ressonância magnética.
Abstract
Resumo
* Study developed at Clínicas de Diagnóstico Por Imagem (CDPI) and Multi-Imagem, Department of Radiology – Universi-dade Federal do Rio de Janeiro (UFRJ), and Instituto Nacional de Câncer (INCA), Rio de Janeiro, RJ, Brazil.
1. MD, Radiologist at Clínica de Diagnóstico Por Imagem (CDPI), Rio de Janeiro, RJ, Brazil.
2. MDs, Radiologists at Clínicas de Diagnóstico Por Imagem (CDPI) and Multi-Imagem, Rio de Janeiro, RJ, Brazil.
3. Physicist at Clínicas de Diagnóstico por Imagem (CDPI) and Multi-Imagem, Rio de Janeiro, RJ, Brazil.
4. MDs, Orthopedists at Instituto Nacional de Câncer (INCA), Rio de Janeiro, RJ, Brazil.
Costa FM, Vianna EM, Domingues RC, Setti M, Meohas W, Rezende JF, Domingues RC, Gasparetto EL. Proton magnetic resonance spectroscopy and perfusion magnetic resonance imaging in the evaluation of musculoskeletal tumors. Radiol Bras. 2009;42(4):215–223.
5. MD, Radiologist, Clinical Director, Clínicas de Diagnóstico por Imagem (CDPI) and Multi-Imagem, Rio de Janeiro, RJ, Bra-zil.
6. Post-Doctorate, Associate Professor of Radiology, Univer-sidade Federal do Rio de Janeiro (UFRJ), MD, Radiologist at Clí-nicas de Diagnóstico por Imagem (CDPI) and Multi-Imagem, Rio de Janeiro, RJ, Brazil.
Mailing address: Dra. Flávia M. Costa. Avenida das Américas, 4666, sala 325, Barra da Tijuca. Rio de Janeiro, RJ, Brazil, 22631-004. E-mail: flá[email protected]
Received May 7, 2009. Accepted after revision June 29, 2009.
INTRODUCTION
Magnetic resonance imaging (MRI) is the “gold standard” in the characterization of tumors of the musculoskeletal system, on account of its high resolution, tissue con-trast, and multiplanar capacity(1–6).
216
the evaluation and staging of bone and soft tissue tumors(3).
Several studies have already demon-strated morphological parameters as a cri-terion for differentiating benign from ma-lignant musculoskeletal tumors, such as size, margins demarcation, involvement of adjacent vital structures, homogeneity in signal intensity, and measurements of re-laxation time(7–11). However, in several
cases conventional MRI presents low specificity in the differential diagnosis of musculoskeletal tumors, as many of the lesions present nonspecific characteristics. Nevertheless, advanced MRI techniques, such as perfusion and proton spectroscopy, have been associated with conventional MRI, with the objective of improving the diagnostic accuracy of this imaging method, in particular in the assessment of the malignancy potential of a lesion(12–18).
Perfusion MRI has been frequently uti-lized in the study of musculoskeletal sys-tem tumors(15,18–23). Previous studies have
demonstrated that the first contrast passage in the dynamic study characterizes the tis-sue vascularization and perfusion in tu-mors(22,24–28). Tissues with high
vasculariza-tion and high capillary permeability tend to an early and intense contrast uptake as compared with less vascularized tissues(27).
With this technique, tumor-like lesions may be qualitatively evaluated by time to signal intensity curves (TIC – time intensity curves) and quantitatively by calculating the numerical value of the curve in percent-age of signal increase per minute (slope – % per minute). However, an overlapping between the values of the perfusion curves (quantitative and qualitative) was demon-strated in highly vascularized benign le-sions and in poorly vascularized malignant tumors(6,15,18,19,22). For this reason, the
com-bination of the qualitative pattern of the curves (TIC) and the quantitative value (slope in % per minute), associated with conventional MRI and proton spectros-copy, could be useful for narrowing the differential diagnosis of musculoskeletal tumors.
Proton spectroscopy is a noninvasive advanced MRI technique that is useful for evaluating musculoskeletal system tu-mors(12,14,29). By means of this technique,
one can detect malignancy markers such as
increased choline peak, a component of cell membrane that reflects the high cell turn-over, suggesting the malignancy potential of the lesions(30–32). A previous study has
demonstrated good results of spectroscopy in the differentiation between benign and malignant musculoskeletal tumors, with sensitivity, specificity and accuracy of re-spectively 95%, 82% and 89%(12).
How-ever, the combination of this technique with perfusion and conventional MRI may further increase the MRI accuracy in the differential diagnosis of musculoskeletal tumors.
The present study was aimed at evalu-ating the role played by advanced MRI techniques, such as proton spectroscopy and perfusion, in the differential diagnosis of musculoskeletal system tumors.
MATERIALS AND METHODS
Patients
In the period between April, 2005 and January, 2007, 55 patients with musculosk-eletal system tumors were studied (40 men and 15 women; mean age of 39 years, rang-ing between 20 days and 80 years). The patients had not undergone any surgical procedure or adjuvant treatment in the pre-vious 10-year period. All the patients and/ or family members signed a term of free and informed consent, and the study was approved by the Committee for Ethics in Research of the Institution.
Conventional MRI
All studies were performed in a 1.5 T Avanto® equipment (Siemens Medical
Sys-tems, Erlangen, Germany), with body coils or surface coils, depending upon the site and diameter of the lesion. The conven-tional protocol was performed, including coronal, sagittal and axial sections on weighted T1-fast spin echo (FSE) se-quences (repetition time (TR)/echo time (TE): 426/15 ms; matrix: 521 × 512) and short inversion time recovery (STIR) (TR/ TE: 3500/130 ms; inversion time (TI): 30 ms; matrix: 512 × 512) and T2-weighted FSE in the axial plane (TR/TE: 3600/104 ms; matrix: 512 × 512). Field of view (FOV), slice thickness and spacing be-tween slices varied according with the tu-mor size.
Perfusion (dynamic contrast enhancement study) MRI
Dynamic contrast enhancement study was performed during intravenous bolus injection of 0.1 mmol/kg of gadolinium (Magnevist®; Schering AG, Berlin,
Ger-many) with an infusion pump at a 2 ml/s flow rate, followed by 20 ml of saline so-lution. This study was performed with T1-weighted gradient echo sequence (TR/TE/ TI: 606/1.34/300 ms; flip angle: 20°; ma-trix: 256 × 102), with a total of five sec-tions with slice thickness and spacing be-tween slices varying according with the tumor size. Total acquisition time was ap-proximately five minutes and, at the end, T1-weighted FSE images were acquired with fat suppression in the axial and coro-nal planes (TR/TE: 759/10 ms; matrix: 512 × 512).
In order to evaluate perfusion data three regions of interest (ROI) of equal size were positioned in three different points: 1) within the lesion, in areas where there was intense early contrast uptake; 2) within an artery; 3) in the contralateral healthy muscle. All ROIs were positioned by an experienced radiologist specialized in mus-culoskeletal imaging. Based on the selected ROI, quantitative and qualitative analyses of the perfusion curves were performed with a standard software (mean curve) available in the workstation (Leonardo®;
Siemens Medical Systems, Erlangen, Ger-many). Besides the qualitative evaluation of the TICs, the slope (% per minute) was calculated with the following formula: slope = (SImax – SIprior) × 100/(SIprior× Tmax) where: SIpriorrepresents the values of the signal intensity before the intravenous ga-dolinium injection; SImax is the value of signal intensity at Tmax; and Tmax indicates the time in which the relative value of sig-nal intensity SI (SI/SIprior) does not present an increase > 3% compared with the val-ues at Tmax.(15).
Two experienced radiologists special-ized in musculoskeletal imaging, who did not have access to the histopathologic di-agnosis of the lesions, classified the TICs patterns into the following types(16,18,20):
early contrast uptake, followed by a plateau phase; type IV – rapid and early contrast uptake followed by a washout phase; type V – rapid and early contrast uptake fol-lowed by slow and sustained uptake.
Proton spectroscopy
Proton spectroscopy was performed with a single voxel with the point-resolved spectroscopy sequence and TE = 135 ms. The volumes of interest (ranging from 3.4 cm3 to 8 cm3) were positioned by two
ex-perienced radiologists, in the areas present-ing early and intense contrast uptake, avoiding the inclusion of bone structures, fat and muscles. In patients presenting with tumor with subtle and slow contrast uptake or absence of uptake after the five minutes of the perfusion study, the voxel was posi-tioned on areas presenting contrast uptake in the delayed images. Spectroscopy data were post-processed by means of a
stan-dard software (Spectroscopy®; Siemens,
Erlangen, Germany). The presence of a choline peak within the lesion was defined by the 3.2 ppm peak on the spectral curve(12).
Histological data
The final diagnosis of the tumors was based on the results of histological evalu-ation, as shown on Table 1. Only the pa-tients with lesions < than 4 cm and typical imaging findings of hemangioma (n = 2)
and lipoma (n = 3), which did not present
characteristics of malignancy and were stable after one-year follow-up, were not submitted to biopsy.
Statistical analysis
Statistical analysis was performed with the Statistical Package for Social Sciences (SPSS) 11.0 software (SPSS Inc.; Chicago, USA), and p < 0.01 values were considered
as statistically significant. In order to
evalu-ate the difference of the mean value of the quantitative analysis of the curve amongst the different groups, the Levene test was utilized to access the variables homogene-ity, followed by the Student t test. The
chi-squared test was utilized for categorical variables, and for the 2 × 2 tables, the Fischer’s exact test was utilized.
RESULTS
Table 1 demonstrates histopathological findings, proton spectroscopy and qualita-tive and quantitaqualita-tive analyses of the perfu-sion curves of the 55 studied tumors (Fig-ures 1 to 6).
Qualitative analysis – time-signal intensity curves (TIC)
Considering the TICs patterns, curves type I and II were found in 17 (85%) be-nign tumors and in only 3 (15%) malignant
Table 1 Summary of data regarding the 55 cases of musculoskeletal tumors.
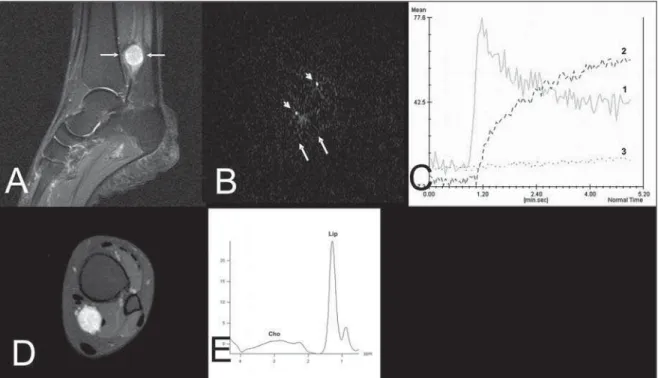
Case 1 2 3 4 5 6 7 8 9 10 11 12 13 14 15 16 17 18 19 20 21 22 23 24 25 26 27 28 29 30 Age (years) 25 68 25 19 33 18 54 59 62 19 80 13 13 25 40 40 39 64 10 49 13 46 30 49 48 51 20 days 54 25 8 Sex M M M M F M M M M F F F F M M M M M F F F M M F M M M M M M Location Arm Axillary region Thigh Thigh Hip Thigh Pelvis Lumbar spine Hip Thigh Thigh Pelvis Thigh Forearm Thigh Gluteus Knee Thigh Thigh Pelvis Thigh Thorax Thigh Ankle Shoulder Shoulder Thigh Knee Thigh Shoulder Histological diagnosis Synovial sarcoma Breast metastasis Hemangioma
Low-grade myxoid liposarcoma Grade I chondrosarcoma
Indifferentiated high-grade sarcoma Osteoblastic osteosarcoma Stomach matastasis Synovial sarcoma Hemangioma
Malignant fibrous histiocytoma Chodroblastic osteosarcoma High-grade sarcoma (spindle and ovoid cells) Low-grade mixofibrosarcoma Undifferentiated liposarcoma Intermuscular lipoma Hemorrhagic bursitis Hemangioma
Leiomiosarcoma (high grade)
Primitive neuroectodermal tumor (PNET) Lipoma
Synovial sarcoma Fibrosarcoma (high grade) Benign schwannoma
Lipoma Desmoid tumor
Highly calcified fibrous bone tumor Osteosarcoma
Synovial sarcoma
Aneurysmal bone cyst
Malignant or benign Malignant Malignant Benign Malignant Malignant Malignant Malignant Malignant Malignant Benign Malignant Malignant Malignant Malignant Malignant Benign Benign Benign Malignant Malignant Benign Malignant Malignant Benign Benign Benign Benign Malignant Malignant Benign
Type of TIC
IV III II II III IV IV IV III II IV III III II III I V I IV IV I IV III II I III I IV IV III Slope value (% per minute)
36% 27% 8% 16% 18% 87% 218% 83% 135% 11% 106% 81% 101% 11% 80% 2% 16% 1% 153% 75% 1% 101% 104% 21% 1% 41% 1% 44% 233% 19% Choline peak Yes No No No No Yes Yes Yes Yes No Yes Yes Yes Yes Yes No No No Yes Yes No Yes Yes No No Yes No Yes Yes No Tumor size (cm) 17 4.3 3 13 2.9 8 23 6 20 3.6 15 7.5 9 14 8.2 10 8 5 4.5 18 5 15 18 3.6 6 9 14 12 6 8.9
218
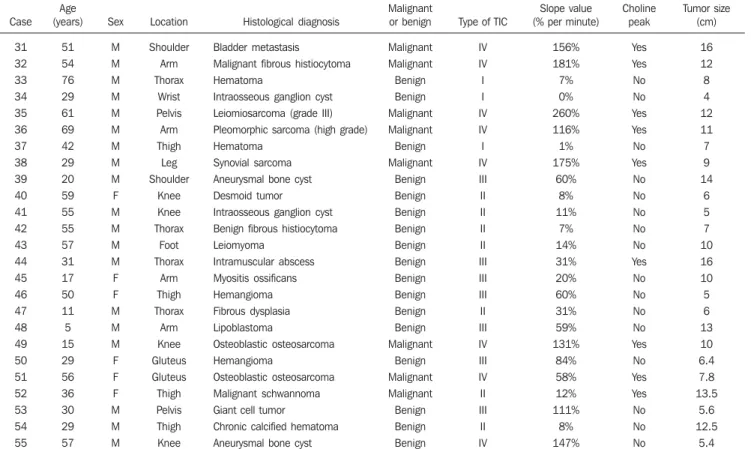
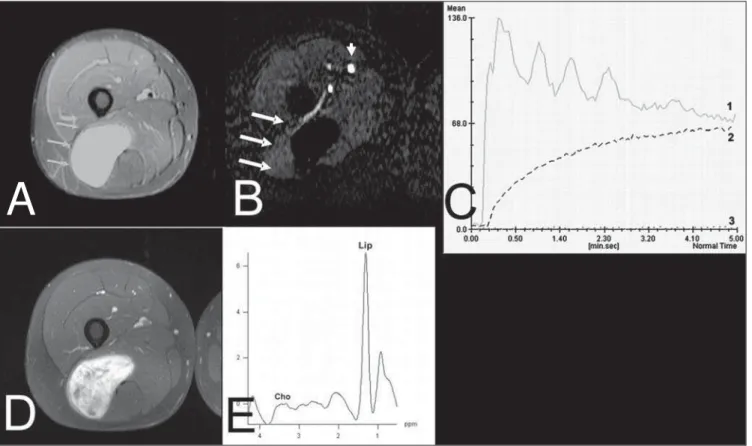
Figure 1. Case 35. Grade III leiomyosarcoma. A: Axial, STIR image showing extensive ovoid lesion with hyperintense signal (arrows) in the left iliac bone. B: Image submitted to the technique subtraction in the axial plane of the arterial phase of the dynamic contrast-enhancement study demonstrating the contrast uptake by the tumor (arrows), external iliac arteries (arrowheads) and the healthy muscle. C: The artery (1) and tumor (2) TIC patterns correspond to type IV and that of the healthy muscle (3) corresponds to type I. The slope value of the tumor curve is 260%/minute. D: The tumor presents homogeneous contrast uptake demonstrated on the T1-weighted sequence with fat suppression in the axial plane after intravenous gadolinium injection and dynamic study. E: The spectral analysis shows the choline peak (Cho) at 3.2 ppm, suggesting malignancy potential.
Table 1 Summary of data regarding the 55 cases of musculoskeletal tumors.
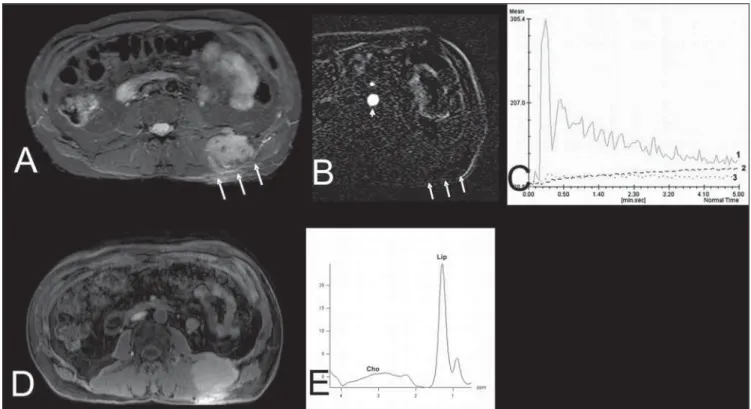
Case 31 32 33 34 35 36 37 38 39 40 41 42 43 44 45 46 47 48 49 50 51 52 53 54 55 Age (years) 51 54 76 29 61 69 42 29 20 59 55 55 57 31 17 50 11 5 15 29 56 36 30 29 57 Sex M M M M M M M M M F M M M M F F M M M F F F M M M Location Shoulder Arm Thorax Wrist Pelvis Arm Thigh Leg Shoulder Knee Knee Thorax Foot Thorax Arm Thigh Thorax Arm Knee Gluteus Gluteus Thigh Pelvis Thigh Knee Histological diagnosis Bladder metastasis
Malignant fibrous histiocytoma Hematoma
Intraosseous ganglion cyst Leiomiosarcoma (grade III)
Pleomorphic sarcoma (high grade) Hematoma
Synovial sarcoma Aneurysmal bone cyst
Desmoid tumor Intraosseous ganglion cyst
Benign fibrous histiocytoma Leiomyoma Intramuscular abscess Myositis ossificans Hemangioma Fibrous dysplasia Lipoblastoma Osteoblastic osteosarcoma Hemangioma Osteoblastic osteosarcoma Malignant schwannoma Giant cell tumor
Chronic calcified hematoma Aneurysmal bone cyst
Malignant or benign Malignant Malignant Benign Benign Malignant Malignant Benign Malignant Benign Benign Benign Benign Benign Benign Benign Benign Benign Benign Malignant Benign Malignant Malignant Benign Benign Benign
Type of TIC
IV IV I I IV IV I IV III II II II II III III III II III IV III IV II III II IV Slope value (% per minute)
156% 181% 7% 0% 260% 116% 1% 175% 60% 8% 11% 7% 14% 31% 20% 60% 31% 59% 131% 84% 58% 12% 111% 8% 147% Choline peak Yes Yes No No Yes Yes No Yes No No No No No Yes No No No No Yes No Yes Yes No No No Tumor size (cm) 16 12 8 4 12 11 7 9 14 6 5 7 10 16 10 5 6 13 10 6.4 7.8 13.5 5.6 12.5 5.4
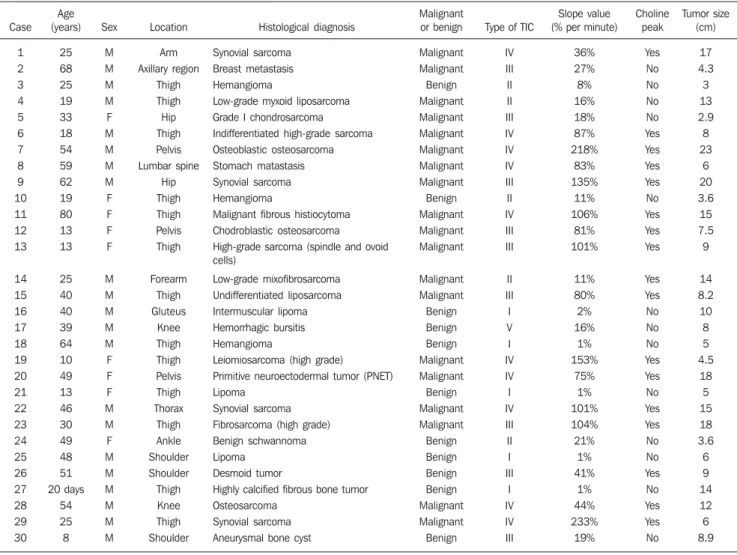
Figure 2. Case 24. Benign schwannoma. A: Sagittal, STIR image showing an ovoid, solid, well defined hyperintense lesion (arrows), in the tarsal tunnel. B: Image submitted to the subtraction technique in the axial plane in the arterial phase of the contrast dynamic study showing the contrast uptake by the arteries (arrowheads), but not by the tumor (arrows). C: The artery TIC pattern (1) is of type IV, the tumor’s (2) is of type II and the healthy muscle’s (3) is of type I. The slope value of the tumor is 21%/minute. D: The tumor presents homogeneous contrast uptake in the delayed phase, identified only on axial T1-weighted images with fat suppression. E: The spectral analysis did not demonstrate choline peak (Cho) at 3.2 ppm.
220
Figure 4. Case 42. Benign fibrous histiocytoma. A: Axial, STIR image showing expansile hyperintense ovoid, well defined lesion in the soft parts of the dorso-lumbar transition at left (arrows). B: Arterial phase of the dynamic contrast enhancement study in the axial plane, submitted to the subtraction technique, showing the contrast within the arteries (arrowheads) and absence of contrast within the tumor (arrows). C: The TIC pattern of the artery (1) is of type IV, and the tumor’s (2) and healthy muscle’s are type I. The slope value of the tumor is 7%/minute. D: The tumor presented late contrast uptake, seen on the T1-weighted images with fat suppression in the axial plane. E: The spectral analysis did not demonstrate choline peak (Cho) at 3.2 ppm.
tumors (low-grade myxoid liposarcoma, low-grade myxofibrosarcoma and malig-nant schwannoma). The type IV curve was found in 17 (89.5%) malignant tumors and in only one benign tumor (aneurismal bone cyst). The type V curve was found in only one benign lesion (hemorrhagic prepatel-lar bursitis). The type III curve was found in nine (56.2%) benign tumors and in seven (43.8) malignant tumors. There was a strong relation between curves of types I and II and benign tumors, and between type IV curves and malignant tumors (p < 0.0001).
Quantitative analysis – slope values
There was a significant difference of the slope values of benign lesions (mean, 27.5% per minute; ranging from 0–147%) in re-lation to malignant lesions (mean, 110.9% per minute; ranging from 11–260%) (p <
0.0001). Although an overlapping between the slope values of some benign and ma-lignant lesions was found, the best cutoff value for the differentiation of these lesions
was 39.9%/minute, with sensitivity, speci-ficity, accuracy, positive and negative pre-dictive values of 81%, 75%, 78%, 76% and 81% respectively.
Proton spectroscopy
The presence of choline peak (3.2 ppm) was demonstrated in 26 (47.3%) of the 55 cases of musculoskeletal tumors. In 24 of the 27 (88.9%) patients with malignant tu-mors, choline peaks were demonstrated. The three cases which did not present the peak were the following: one breast me-tastasis recurrence after 20 years, one grade I intraosseous chondrosarcoma and one low-grade myxoid liposarcoma. Of the 28 benign lesions, only 2 (7.1%) demonstrated choline peaks (one intramuscular abscess and one desmoid tumor). There was a sta-tistically significant difference in the dif-ferentiation between benign and malignant tumors evaluated by proton spectroscopy (p < 0.0001). The choline peak accuracy
was of 91%, specificity was 92%,
sensitiv-ity was 87.5%, negative predictive value was 88.5% and positive predictive value was 92%.
DISCUSSION
Proton spectroscopy of musculoskeletal tumors has been described in other stud-ies(12,14,29). Wang et al.(12) have analyzed the
presence of choline peaks in 36 patients with soft parts and bone tumors. These authors have found 89% accuracy of this technique in the differentiation between benign and malignant lesions. Fayad et al.(29) have evaluated histopathological
specimens from 13 musculoskeletal tumors with proton spectroscopy and demon-strated choline peaks significantly higher in areas of histologically confirmed malig-nant tumors. In the present study, the accu-racy of the presence of choline peaks de-tected by proton spectroscopy for differen-tiation between malignant and benign musculoskeletal tumors was 91%. In this Figure 6. Case 4. Low-grade myxoid liposarcoma. A: Coronal, STIR sequence shows extensive, hyperintense, elongated, well defined lesion (arrows) in the posterior region of the right thigh. B: Arterial phase of the dynamic contrast enhancement study, submitted to the subtraction technique in the axial plane, showing contrast within the femoral arteries (arrowhead), absence of contrast within the tumor (arrows) and in the healthy muscle. C: The TIC pattern of the artery (1) is of type IV, the tumor’s (2) is of type II and the healthy muscle (3) is of type I. The slope value of the tumor is 16%/minute. D: The tumor demon-strates homogeneous contrast uptake at the delayed phase, visualized on the T1-weighted sequence with fat suppression in the axial plane. E: The spectral analysis did not demonstrate choline peak (Cho) at 3.2 ppm.
222
casuistic three false negative results were found: one case of late recurrence from a breast tumor metastasis, one hypocellular myxoid liposarcoma, according to histo-pathological analysis, and a grade I intraosseous chondrosarcoma (< 3.0 cm). Wang et al.(12) have suggested that the small
amount of available protons in the tissue, associated with the effects of magnetic susceptibility found in the bone, may con-tribute for a false negative result in the choline detection. Considering the two false positive results (one intramuscular abscess and one hypercellular desmoids tumor), previous studies(12,30) have
demon-strated that hypercellular benign tumors and inflammatory cells may demonstrate choline peaks at spectral analysis without presenting malignant cells(12,30,32–34).
Previous researches have utilized, albeit with some limitations, dynamic contrast enhancement study (perfusion) to differen-tiate benign from malignant musculoskel-etal tumors(22,35). The slope values obtained
in the dynamic study provides information on tissue vascularization and perfusion in a lesion. This variable may be related with the malignancy potential of the tumors, although there is some overlapping be-tween the values from benign and malig-nant tumors(19). In the present study, slope
values < 39.9% per minute were demon-strated preferably in benign tumors, while slope values > 39.9% per minute were mostly observed in malignant tumors. In some cases in the present study, results demonstrated high slope values in quite avascular benign tumors, a finding already described in previous studies(19,22). As
pre-viously described, malignant tumors with low slope values were generally lesions with a low malignancy degrees, recur-rences and necrotic tumors(15,16).
Considering soft tissue tumors, van Rijswijk et al.(18) have described intense
and early contrast uptake followed by a plateau or washout phase (TIC types III and IV) as suggestive of malignancy. Van der Woude et al.(22) have differentiated soft
tis-sue tumors between malignant and benign ones by utilizing the different TIC patterns, with 86%sensitivity and 81% specificity. On the other hand, bone tumors could not be differentiated by the same method. In the present series, the majority of malignant
soft tissue and bone tumors demonstrated TIC curves of type IV with washout, which is present in highly vascularized lesions with small interstitial spacing(20). Only one
benign lesion (highly vascularized aneurys-mal bone cyst) presented a TIC of type IV. TICs of types I and II were found in most of the benign lesions. Only three malignant tumors presented type II TIC: one low grade myxoid liposarcoma, one low grade myxofibrosarcoma, hypocellular and hypovascular at histopathological study, and one malignant schwannoma with ex-tensive necrosis. In this study, type III TIC was not useful in differentiating benign from malignant tumors.
Considering the dynamic contrast en-hancement study (perfusion) in association with proton spectroscopy, one observed that 23 of the 27 patients with malignant tumors presented slope values > 39.9% as-sociated with the detection of choline peaks. By analyzing the benign tumors, only one of the 28 patients obtained the same result (desmoid tumor). Sensitivity, specificity and positive and negative pre-dictive values of the association of both techniques were 85.1%, 96.4%, 95.8% and 87%, respectively. On the other hand, 17 of the 27 patients with malignant tumors ob-tained TIC type IV and detected choline peak, while no benign tumor presented the same result. The sensitivity, specificity and positive and negative predictive values were, respectively, 62.9%, 100%, 100% and 73%.
Finally, perfusion MRI (TIC and slope values) associated with proton spectros-copy (choline peak detection) may be use-ful in the differentiation of benign from malignant musculoskeletal tumors. The presences of type IV TIC, slope > 39.9% per minute and choline peak detection are highly suggestive of malignancy. Besides the diagnostic role, such techniques may also contribute in the planning of biopsy sites, as they indicate areas of viable tumor, allowing higher accuracy in the histopatho-logical diagnosis, and facilitating the therapy planning.
Further studies with larger casuistics should confirm the importance of advanced MRI in the differential diagnosis of mus-culoskeletal tumors.
REFERENCES
1. Ma LD, Frassica FJ, McCarthy EF, et al. Benign and malignant musculoskeletal masses: MR im-aging differentiation with rim-to-center differen-tial enhancement ratios. Radiology. 1997;202: 739–44.
2. Blacksin MF, Ha DH, Hameed M, et al. Superfi-cial soft-tissue masses of the extremities. Radiographics. 2006;26:1289–304.
3. Catalan J, Fonte AC, Lusa JRB, et al. Tumor de células gigantes ósseo: aspectos clínicos e radio-gráficos de 115 casos. Radiol Bras. 2006;39:119– 22.
4. Gomes ACN, Silveira CRS, Paiva RGS, et al. Condrossarcoma em paciente com osteocondro-matose múltipla: relato de caso e revisão da lite-ratura. Radiol Bras. 2006;39:449–51. 5. Kransdorf MJ, Jelinek JS, Moser RP Jr, et al.
Soft-tissue masses: diagnosis using MR imaging. AJR Am J Roentgenol. 1989;153:541–7.
6. Öztekin O, Argin M, Oktay A, et al. Intraosseous lipoma: radiological findings. Radiol Bras. 2008; 41:81–6.
7. Berquist TH, Ehman RL, King BF, et al. Value of MR imaging in differentiating benign from ma-lignant soft-tissue masses: study of 95 lesions. AJR Am J Roentgenol. 1990;155:1251–5. 8. Totty WG, Murphy WA, Lee JK. Soft-tissue
tu-mors: MR imaging. Radiology. 1986;160:135–41. 9. Crim JR, Seeger LL, Yao L, et al. Diagnosis of soft-tissue masses with MR imaging: can benign masses be differentiated from malignant ones? Radiology. 1992;185:581–6.
10. Sundaram M, McGuire MH, Schajowicz F. Soft-tissue masses: histologic basis for decreased sig-nal (short T2) on T2-weighted MR images. AJR Am J Roentgenol. 1987;148:1247–50. 11. Moulton JS, Blebea JS, Dunco DM, et al. MR
imaging of soft-tissue masses: diagnostic efficacy and value of distinguishing between benign and malignant lesions. AJR Am J Roentgenol. 1995; 164:1191–9.
12. Wang CK, Li CW, Hsieh TJ, et al. Characteriza-tion of bone and soft-tissue tumors with in vivo 1H MR spectroscopy: initial results. Radiology. 2004;232:599–605.
13. Geirnaerdt MJA, Hogendoorn PCW, Bloem JL, et al. Cartilaginous tumors: fast contrast-enhanced MR imaging. Radiology. 2000;214:539–46. 14. Fayad LM, Barker PB, Jacobs MA, et al.
Char-acterization of musculoskeletal lesions on 3-T proton MR spectroscopy. AJR Am J Roentgenol. 2007;188:1513–20.
15. Erlemann R, Reiser MF, Peters PE, et al. Muscu-loskeletal neoplasms: static and dynamic Gd-DTPA-enhanced MR imaging. Radiology. 1989;171:767–73.
16. Van Herendael BH, Heyman SRG, Vanhoenacker FM, et al. The value of magnetic resonance im-aging in the differentiation between malignant peripheral nerve-sheath tumors and non-neuro-genic malignant soft-tissue tumors. Skeletal Radiol. 2006;35:745–53.
17. Shapeero LG, Vanel D, Verstraete KL, et al. Dy-namic contrast-enhanced MR imaging for soft tissue sarcomas. Semin Musculoskelet Radiol. 1999;3:101–14.
dynamic gadopentetate dimeglumine-enhanced MR imaging in prediction of malignancy. Radi-ology. 2004;233:493–502.
19. Verstraete KL, De Deene Y, Roels H, et al. Benign and malignant musculoskeletal lesions: dynamic contrast-enhanced MR imaging – parametric “first-pass” images depict tissue vascularization and perfusion. Radiology. 1994;192:835–43. 20. Tokuda O, Hayashi N, Taguchi K, et al. Dynamic
contrast-enhanced perfusion MR imaging of diseased vertebrae: analysis of three parameters and the distribution of the time-intensity curve patterns. Skeletal Radiol. 2005;34:632–8. 21. Kajihara M, Sugawara Y, Sakayama K, et al.
Evaluation of tumor blood flow in musculo-skeletal lesions: dynamic contrast-enhanced MR imaging and its possibility when monitoring the response to preoperative chemotherapy – work in progress. Radiat Med. 2007;25:94–105. 22. van der Woude HJ, Verstraete KL, Hogendoorn
PC, et al. Musculoskeletal tumors: does fast dy-namic contrast-enhanced subtraction MR imag-ing contribute to the characterization? Radiology. 1998;208:821–8.
23. Fletcher BD, Hanna SL, Fairclough DL, et al. Pediatric musculoskeletal tumors: use of dy-namic, contrast-enhanced MR imaging to moni-tor response to chemotherapy. Radiology. 1992; 184:243–8.
24. Verstraete KL, van der Woude HJ, Hogendoorn PCW, et al. Dynamic contrast-enhanced MR im-aging of musculoskeletal tumors: basic principles and clinical applications. J Magn Reson Imag-ing. 1996;6:311–21.
25. Verstraete KL, Dierick A, De Deene Y, et al. First-pass images of musculoskeletal lesions: a new and useful diagnostic application of dynamic contrast-enhanced MRI. Magn Reson Imaging. 1994;12:687–702.
26. Fletcher BD, Hanna SL. Musculoskeletal neo-plasms: dynamic Gd-DTPA-enhanced MR imag-ing. Radiology. 1990;177:287–8.
27. Verstraete KL, Vanzieleghem B, De Deene Y, et al. Static, dynamic and first-pass MR imaging of musculoskeletal lesions using gadodiamide injection. Acta Radiol. 1995;36:27–36. 28. Daldrup H, Shames DM, Wendland M, et al.
Cor-relation of dynamic contrast-enhanced MR im-aging with histologic tumor grade: comparison of macromolecular and small-molecular contrast media. AJR Am J Roentgenol. 1998;171:941–9. 29. Fayad LM, Bluemke DA, McCarthy EF, et al. Musculoskeletal tumors: use of proton MR spec-troscopic imaging for characterization. J Magn Reson Imaging. 2006;23:23–8.
30. Maheshwari SR, Mukherji SK, Neelon B, et al. The choline/creatine ratio in five benign neo-plasms: comparison with squamous cell
carci-noma by use of in vitro MR spectroscopy. AJNR Am J Neuroradiol. 2000;21:1930–5.
31. Bartella L, Morris EA, Dershaw DD, et al. Pro-ton MR spectroscopy with choline peak as ma-lignancy marker improves positive predictive value for breast cancer diagnosis: preliminary study. Radiology. 2006;239:686–92.
32. Rand SD, Prost R, Haughton V, et al. Accuracy of single-voxel proton MR spectroscopy in dis-tinguishing neoplastic from nonneoplastic brain lesions. AJNR Am J Neuroradiol. 1997;18:1695– 704.
33. Bitsch A, Bruhn H, Vougioukas V, et al. Inflam-matory CNS demyelination: histopathologic cor-relation with in vivo quantitative proton MR spec-troscopy. AJNR Am J Neuroradiol. 1999;20: 1619–27.
34. Krouwer HG, Kim TA, Rand SD, et al. Single-voxel proton MR spectroscopy of nonneoplastic brain lesions suggestive of a neoplasm. AJNR Am J Neuroradiol. 1998;19:1695–703.