ISSN 0104-6632 Printed in Brazil
www.abeq.org.br/bjche
Vol. 33, No. 04, pp. 1083 - 1090, October - December, 2016 dx.doi.org/10.1590/0104-6632.20160334s20150374
*To whom correspondence should be addressed
Brazilian Journal
of Chemical
Engineering
TOWARD PREDICTIVE MODELS FOR
ESTIMATION OF BUBBLE-POINT PRESSURE AND
FORMATION VOLUME FACTOR OF CRUDE OIL
USING AN INTELLIGENT APPROACH
D. Abooali
1and E. Khamehchi
2*1
School of Chemical Engineering, Iran University of Science and Technology, (IUST), Postal Code, 16765-163, Tehran, Iran. 2
Faculty of Petroleum Engineering, Amirkabir University of Technology, Hafez Avenue, 15914, Tehran, Iran. Phone: + 98 (21) 64545154; Fax: + 98 (21) 64543528
E-mail: [email protected]
(Submitted: June 14, 2015 ; Revised: September 1, 2015 ; Accepted: September 2, 2015)
Abstract - Accurate estimation of reservoirs fluid properties, as vital tools of reservoir behavior simulation and reservoir economic investigations, seems to be necessary. In this study, two important properties of crude
oil, bubble point pressure (Pb) and formation volume factor (Bob), were modelled on the basis of a number of
basic oil properties: temperature, gas solubility, oil API gravity and gas specific gravity. Genetic programming, as a powerful method, was implemented on a set of 137 crude oil data and acceptable correlations were
achieved. In order to evaluate models, two test datasets (17 data for Pb and 12 data for Bob) were used. The
squared correlation coefficient (R2) and average absolute relative deviation (AARD %) over the total dataset
(training + test) are 0.9675 and 8.22% for Pb and 0.9436 and 2.004% for Bob, respectively. Simplicity and high
accuracy are the advantages of the obtained models.
Keywords: Crude oil; Bubble point pressure; Formation volume factor; Genetic programming.
INTRODUCTION
Thermodynamic quantities of crude oil are a set of important features in order to determine technical specifications of oil production process equipment. Designing plenty of systems such as upstream and underground devices, surface operation equipment, etc., requires adequate and accurate information about oil parameters which are achieved, in many cases, from experimental tests along with mathemati-cal correlations and formulas.
Laboratory tests are usually expensive and some-times difficult and time-consuming. However, the application of correlations is economically advanta-geous and increases the speed of works. Further-more, the other great use of the correlations is to
determine oil future specifications and changes taken into great consideration in reservoir simulators.
Various pressure-volume-temperature (PVT) prop-erties of crude oil can be estimated by means of equations of state or oil PVT analysis, if a complete set of variables of the oil including temperature, pressure and fluid composition are available. But in many cases, the composition of reservoir fluid is not predetermined, especially in the primary stages of recovery processes. Thus, some correlations are re-quired to be functions of a number of readily availa-ble reservoir parameters in order to be used by engi-neers and scientists in this area.
volume factor (Bob) solely as functions of simple and quickly accessible live crudeoil parameters. The parameters are temperature (T), gas solubility (Rs), oil API gravity and gas specific gravity (γg).
In a hydrocarbon system at constant temperature, whether single-component or mixture, the bubble point pressure is the maximum pressure at which the first gas bubbles appear (Ahmed, 2010). The state of the system in this condition is called “saturated liquid”.
The oil formation volume factor (FVF) is the ra-tio of the specific volume of oil at its natural tem-perature and pressure to the specific volume of the oil at standard conditions (i.e. P = 1 atm and T = 60 ˚F). If Bo is measured in the bubble point condition, it will be the bubble point oil formation volume factor (Bob).
There are several correlations and methodologies developed and proposed so far for prediction of Pb and Bob. Methods of Standing (1947), Vasquez and Beggs (1980), Glaso (1980), Marhoun (1988) and Petrosky and Farshad (1993), as famous correlations, have been introduced in the literature (Ahmed, 2010). Elsharkawy and Alikhan (1997) presented a set of correlations for gas solubility, oil compressibil-ity (Co) and Bob. Their relation for Bob is as follows:
( )
( )
(
)
( )
(
)
(
)
5 5
ob s
5
s g o
B 1 40.428 10 R 63.802 10
T – 60 0.78 10
R T –60 /
− −
−
= + × +
× +
× γ γ
(1)
in which, γg is gas specific gravity. Khamehchi et al. (2009) also proposed three models for Pb, Rs and bubble point oil viscosity (μob). They called the achieved models “AUT”. Their Pb correlation is given below:
0.9129 0.666 0.2122 1.08
b s g
P = 107.93 R × γ − ×T ×API− (2)
Some presented correlations or algorithms are based on consistencies of a number of oil compo-nents or assays, which should be predetermined (El-sharkawy, 2003; AlQuraishi, 2009; Bandyopadhyay and Sharma, 2011; Farasat et al., 2013). However, the composition-based models have some limitations in their uses in preliminary reservoir investigations and simulations.
There are also several methods using the artificial neural network (ANN) technique to predict Pb and Bob (Rasouli et al., 2008; Asadisaghandi and Tah-masebi, 2011). Adaptive network-based fuzzy
infer-ence system (ANFIS) is another new approach that has been applied in this area (Shojaei et al., 2014).
Different procedures and methodologies can be used for model development. Artificial neural net-work (ANN), generalized regression neural netnet-works (GRN), imperialist competitive algorithm (ICA), particle swarm optimization (PSO), adaptive net-work-based fuzzy inference system (ANFIS), genetic programing (GP), etc. are applied as famous methods in various fields, especially for optimization and pre-diction purposes. In the present study, a genetic pro-gramming based multi-gene symbolic regression al-gorithm called “GPTIPS” (Searson, 2009) was ap-plied. This is an approved method used by the authors in some projects (Abooali and Khamehchi, 2014).
The application of genetic programming for de-veloping simple-to-use correlations for Pb and Bob seems novel. Moreover, applying natural ranges of bubble point pressure, bubble point formation volume factor, temperature, gas solubility, oil API gravity and gas specific gravity has increased the applicabil-ity and accuracy of the new developed models.
MATERIALS AND METHODS Data Set
The total dataset includes 137 training sets of data from 137 oil samples. Each set includes temperature, solution gas ratio, oil API gravity, gas specific grav-ity, oil bubble point pressure and formation volume factor. The data were collected from different geo-graphical zones.
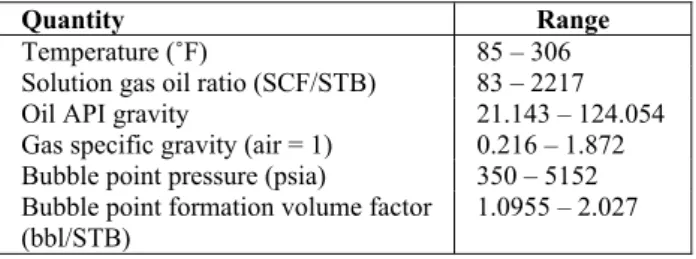
In order to determine the predictive capability of the models and also to implement a comparison be-tween the new developed models and other correla-tions, two additional sets – one for Pb including 17 sets of data and the other for Bob which has 12 sets of data – were applied. The data of the additional sets known as “test sets” were gathered from several papers and reference books (Ahmed, 2010; McCain, 1990; Shojaei et al., 2014). The ranges of all parame-ters are presented in Table 1.
Table 1: The range of parameters in the dataset of present study.
Quantity Range
Temperature (˚F) 85 – 306
Solution gas oil ratio (SCF/STB) 83 – 2217
Oil API gravity 21.143 – 124.054
Gas specific gravity (air = 1) 0.216 – 1.872 Bubble point pressure (psia) 350 – 5152 Bubble point formation volume factor
(bbl/STB)
M o fr g b (1 ap an fa tr n fa k o co m th u re tu m tr g fo p m ca “s at b B se b F to la b as Toward Predic Model Develo Genetic pr logy and its rom biologi
ramming wa een develop 1992). As an pplications i nd modeling amous algori rusted metho
ew models h ar, for differ
ind of regre f GP. GP is omputer pro machine learn
he random nder predete epresented as ures. The pri mathematical ree structure ene is shown or a functio
opulations a mined by the When the al models o symbolic reg t first, the fo y the user an But in a sym
earches for b ehavior and
Figure 1: A s ors: ×, + and
In GA, aft ation (parents
y weighted s genes with
ctive Models for
Brazilian J opment Pro rograming (G s programing cal generati as introduced ped mostly b n efficient to in mathemati g projects. G
ithm based o od in correl have been p rent phenome
ssion metho an evolution ograms in ord
ning method population ermined rest s chromosom imary popul operators op is often kno n in Figure on. The num
and complex user.
process is s r functions, gression”. In orm of the m nd then, mod mbolic regre both the mod also the mod
simple gene tanh.
ter random g s), the overal summation o h a bias term
Estimation of Bu
Journal of Chemic
ocedure GP) is a pow g procedure ion systems d in the early by its innova ool, it has a
ical and also enetic algori on genetic p lation devel produced by
ena. In the p od was applie nary methodo der to perfor d that biologi of mathema trictions. Th mes like synt lation of fun perating on i own as a “g 1. Each gene mber of gen xity of genes
specification the GP is o n convention model should del parameter ession, the a del form desc del paramete
(tree structu
generation of ll primary mo of all functio m. The weig
ubble-Point Pressu
cal Engineering V werful meth
was pattern . Genetic p y 1990s and h
ator John Ko wide variety o computatio ithm (GA), a rograming, i lopment. Ma use of GA, present study
ed on the ba ology involv rm tasks. It i ically genera atical functio
e population tactic tree str nctions inclu nput data. Ea gene”. A sim
e mainly stan nes, number s can be det
n of mathem often known nal regressio d be determin
rs will be fitt algorithm its cribing the d
rs.
ure) with ope
f the first po odel is achiev ons represen ght of each t
ure and Formatio
Vol. 33, No. 04, hod-ned pro-has oza y of onal as a is a any , so y, a asis ving is a ates ons n is ruc-udes ach mple nds of ter- mati-n as ons, ned ted. self data era- opu-ved nted tree an squ inc As som the we are squ Fig ter gen tre of sel (ch sum we Th ate tio (Se GA 19 of app rel gen an pro mo son sho wa MA gen pre ing
on Volume Factor
pp. 1083 - 1090, d the bias te uares techni cluding two s can be see me mathema e input variab eights of gen e automatica uares. x1, x2
gure 2: Ove rm. d0, d1 a
nes.
In the next ees and mod trees and e lves) are im hildren), i.e. mmation of eights and al his process is ed until the la ons) that are
earson, 2010 A are found e
92).
If the algori one, in fact, plied for pro lations (mult
ne consists o individually oaches often odels consist
n, 2010). Th own in Figur
A genetic as prepared
ATLAB soft ne symbolic evious opera g over the be
r of Crude Oil Us
October - Decem erm are calcu
que. A simp gene structu n in Figure atical operat bles. d0 is a b nes. The opti ally obtained and x3 are in
erall model and d2 are
step, crossin ifications of exchanging plemented to , new tree all new gene lso the new s iterated and ast population able to solve 0). Complem elsewhere (S
ithm creates , a more accu oducing a po ti-gene symb of one or m y usual GP t n give simp ting of one m he flowchar re 3.
algorithm t by Searso tware. It was c regression ations (gener est trees, mut
sing an Intelligent
ember, 2016 ulated by an ple schemati ures is show
2, in each g tors which a bias term and imal weights d by use of nput variable
of two gene linear coeff
ng over the be f trees (cuttin cut parts b to make a ne
structures. es is repeate
bias term ar d new popul
n contains ne e the problem mentary expla
Searson et al
a number of urate method opulation of bolic regress more genes e
tree. Thus, m pler function
monolithic G rt of genetic
toolbox call on (2009) s written ma application rating parent utating, produ
t Approach 10 ordinary lea ic of a mod wn in Figure gene there a are applied o
d d1 and d2 a s for the gen ordinary lea s.
es with a bi ficients of th
est performin ng some par between them
ew populatio The weighte d and the ne re determine lations are cr ew trees (fun m successful anations abo l., 2010; Koz
f genes instea dology will b f mathematic sion). A mult ach one bein multi-gene a
ns than oth GP tree (Sea c algorithm
et co in 2 li se so al fo T tr ob an P B
tc.) are carri orrelation. M n the refere
010). In this stu inear correlat
ets), includin olubility, oil long with bu ormation vo Then, tuning rolled. Runn btained with nd good accu
Figure
b
P 169 ln R
1.934 ln ( = +
(
ob B 0.0007 0.00031.622 1
=
−
ied out by G More details a ences (Sears
udy, GPTIPS tions. Input ng experimen l API gravit
ubble point lume factor, g parameters ning the prog
h acceptable uracy.
e 3: Genetic
3 s g s g R 2614 R γ n T 2 API ) γ ⎛ ⎞⎛ ⎜ ⎟⎜ ⎝ − ⎝ ⎠
(
(
)
(
(
6 s 004 T 0.00518 exp
10− R –
+
γ
GPTIPS to a about GPTIP son, 2009; S
S was used t data (trainin ntal sets of te ty and gas s pressure an , were fed t s were adju gram, each c values of sta
algorithm flo
(
(
gs 4 ln γ ln R
R ln(AP T
T API
+ +
)
( )
( )
(
s g s g03542 R 0
ln R
– exp ln
+
γ +
γ
achieve the b PS can be fou Searson et
o develop n ng and test su
emperature, specific grav nd bubble po to the GPTIP usted and c
correlation w atistical crite
owchart.
)
)
s g 2
g 2 g R γ γ I) 0.00
2 γ
⎛ + ⎜ ⎜ ⎝ ⎞ − ⎟ + ⎠
(
( )
)
(
2 s 0.0003534 APR ln 2 T
T 3 T –
+ best und al., non- ub-gas vity oint PS. on-was eria Ev mo cor tio per AA 2 R RM AR AA wh pre var dat cor vo as 2 2 s 1
API γ
04272R 0.05948 AP ⎞ + ⎟ ⎟ + ⎠ +
)
)
)
2 g s API 0.00042 API– API R A
+
− γ −
+
valuation of For evaluati on statistical rrelation coe on (RMSD) a rcentage (AA ARD is prefe
n i 1 n 2 i 1 (y (y 1 = = = −
∑
∑
1 MSD n ⎛ = ⎜⎝( )
yRD % =
( )
ARD % =
here yexp.i , y edicted, and riables (Bob taset, respect RESU Applying th rrelations fo lume factor follows: s 3 g 2 g 11.54 R γ 0.05948 2746 I + + γ
( )
(
(
( )
)
2 g g275 A
0.003894 API ln γ − γ Model Valid ion of the dev l parameters efficient (R2) and average ARD %). A erred. R2 shou
exp. cal. 2 i i
exp. exp. 2 i
y y )
y y )
− − n exp. i i 1 (y = ⎞ − ⎟ ⎠
∑
exp. cal. i i exp. i y y − × n ex i i 1 y 1 n = ⎛ ⎞ ⎜ ⎟ ⎝ ⎠∑
cal. iy , yexp. an d average of and Pb) and tively.
ULTS AND he genetic pr r bubble poi of crude oil
2 8 API 472.5 +
(
( )
(
s 2 g gAPI ln R
exp 0.945 − γ γ + dity veloped mod s were calcu ), root-mean absolute rela A low value o uld be near t
2 cal. 2 i y ) − 100 xp. cal. i exp. i y 10 y − ×
nd n are the f experimen
number of s
DISCUSSIO rogramming
int pressure l were obtai
)
)
)
s
+
dels, three com ulated: square
-square devi ative deviatio of RMSD an to one.
(3
(4
(5
00 (6
experimenta ntal depende
samples in th
ONS
approach, tw and formatio ined. They a
m B v v T m P
Toward Predic The statist models are gi Bob, respectiv alues predic ersus exper Table 3, Figu models are ca Pb and Bob. I
ntotal = RMSD R2total = AARD Subscripts “to
ntotal = RMSD R2total = AARD
Subscripts “to
F c
F R
ctive Models for
Brazilian J tical parame iven in Tabl vely. Figure cted by Equ rimental dat ure 4 and Fi apable of pr In Figure 6
Tab
154
Dtotal = 190.8408 = 0.9675 Dtotal = 8.2206%
tal”, “train”, and
Tabl
149
Dtotal = 0.0449 bb = 0.9436 Dtotal = 2.0040%
tal”, “train”, and
Figure 4: P correlation co
Figure 5: P R2train and R2t
Estimation of Bu
Journal of Chemic eters of the n le 2 and Tab
4 and Figu ation (7) an ta. Accordin
gure 5, the rediction and
and Figure
le 2: Statisti
8 psia
%
“test” are used to
le 3: Statisti
bl/STB
%
“test” are used to
Predicted ver oefficients o
redicted ver
test are correl
ubble-Point Pressu
cal Engineering V new develop ble 3 for Pb a ure 5 show nd Equation
ng to Table new develop d estimation
7, cumulat
ical parame
ntrain = RMSD R2train AARD o distinguish the r
cal paramet
ntrain = RMSD R2train AARD
o distinguish the r
rsus experim f training and
rsus experim ation coeffic
ure and Formatio
Vol. 33, No. 04, ped
and the (8) 2, ped n of tive
fre tiv da the for les ati tha
eters of the n
= 137
Dtrain = 169.112 n = 0.9695
Dtrain = 8.0395% results related to
ters of the n
= 137
Dtrain = 0.0456 b n = 0.9419
Dtrain = 2.0069% results related to
mental bubbl d test data, r
mental bubbl cients of train
on Volume Factor
pp. 1083 - 1090, equency per ve deviation ta set for Pb ese figures, t r 90.26% of ss than 20% ion percent f an 10%.
new develop
26 psia
%
total data set, trai
new develope
bbl/STB
%
total data set, trai
le point pres espectively.
e point oil ning and test
r of Crude Oil Us
October - Decem cent versus
percent are
b and Bob, r the absolute f all data esti . For Bob, th for 97.315%
ed model fo
ntest = RMS R2test AAR ining data set, and
ed model for
ntest = RMS R2test AAR
ining data set, and
ssure. R2train
formation v data, respec
sing an Intelligent
ember, 2016 maximum re shown ov respectively. relative dev imated by E he absolute of all the da
or Pb.
= 17
SDtest = 315.356 st = 0.9131 RDtest = 9.6795% nd test data set, re
r Bob.
= 12
SDtest = 0.0360 st = 0.9322 RDtest = 1.9700% nd test data set, re
and R2test ar
volume facto ctively.
t Approach 10 absolute rel ver the enti As shown viation perce Equation (7)
relative dev ataset is low
62 psia
% spectively.
bbl/STB
%
spectively.
re
or.
087 la-ire
w m
Figure 6: maximum developed m whole data absolute rel are less tha for 90.26%
In order t with other m mented over
Table 4: C
Method
Standing Glaso Marhoun Petrosky and AUT Present study
Figure 8: versus cum pressure of absolute re veloped mo correlations
Cumulative absolute rel model for bu a set (154 d lative deviat an 10% and
of all data a
to evaluate t models, a co
test dataset
Comparison
d Farshad
y
Maximum mulative num f the test set ( elative devia odel is lower s.
e frequency lative deviat ubble point p data). As ca tions for 73.3 absolute re are less than 2
the new cor omparison ha
ts and the r
between em
Pb
AARD % 16.951 21.740 11.190
- 35.199
9.680
absolute re mber of data (17 data). As ation curve r than that of
percent ve tion of the pressure over an be seen, 377% of all lative deviat 20%.
rrelations alo as been imp results are p
mpirical corr
(Number of d
R2 R
( 0.431 80 0.461 78 0.676 60
-
-0.944 14 0.913 31
elative devia for bubble p s can be seen
of the new f other empi
ersus new r the , the
data tions
Figu max velo fact seen the atio
ong ple-
pre-sen the els
relations and
data=17) RMSD
(psia) Max
AAR 07.127 59 85.440 50 08.592 43
-
491.11 94 15.356 29
ation point n, the w
de-irical
Figu vers poin data of t othe
ure 7: Cum ximum absol oped model or over all n, absolute re
data are less ns for 97.315
nted in Table e prediction s is higher th
d the new de
ximum RD%
AAR % .054 2.62 .763 2.1 .582 2.2 - 2.1 .462 -.317 1.9
ure 9: Max sus cumulati nt formation a). The avera the new dev er empirical
mulative fre ute relative d for bubble p the data set elative devia
than 5% an 5% of all the
e 4, Figure 8 capability of an that of pre
eveloped mo
Bob (Num
RD
% R
2
21 0.888 71 0.901 92 0.902 09 0.916 - 70 0.932
ximum abso ive number n volume fac age of the ab
eloped mode correlations.
equency per deviation of point format t (149 data). ations for 91. nd absolute re
e data are les
8 and Figure f the new de revious relati
odels over te
mber of data= RMSD (bbl/STB 8 0.0462 1 0.0435 2 0.0434 6 0.0402 - 2 0.0360
olute relativ of data for ctor for the bsolute relativ del is lower
.
rcent versus the new de-tion volume . As can be .275% of all elative
devi-s than 10%.
9. As a resu eveloped mo
ons.
est data set.
=12) D
B)
Maximum AARD% 2 5.773 5 6.484 4 6.774 2 7.074
- 0 4.788
ve deviation the bubble test set (12 ve deviation than that of
ult,
od-m %
Toward Predictive Models for Estimation of Bubble-Point Pressure and Formation Volume Factor of Crude Oil Using an Intelligent Approach 1089
Brazilian Journal of Chemical Engineering Vol. 33, No. 04, pp. 1083 - 1090, October - December, 2016 These comparisons demonstrate the superiority of
the correlations developed in the present project among proposed models.
The experimental values of all dataset along with predicted data have been provided in the supporting materials and information.
CONCLUSIONS
By application of genetic programing methodol-ogy, two new models have been achieved for estima-tion and predicestima-tion of bubble point pressure and bub-ble point formation volume factor, as functions of a number of rapidly measurable oil parameters. One of the useful applications of this kind of model is pre-diction of oil properties in the future during the reser-voir lifetime that is very important, especially for economic studies as well as effective uses in reser-voir simulators. A comparison between the new pro-posed models and some other correlations shows the greater accuracy of the proposed models over previ-ous works.
NOMENCLATURE
AARD% average absolute relative deviation percentage
ANN artificial neural network
API oil API gravity
ARD% absolute relative deviation percent bbl STB-1 barrel(s) per standard barrels Bo oil formation volume factor
Bob bubble point oil formation volume factor Co oil compressibility at constant
temperature
FVF formation volume factor GP genetic programing
GRN generalized regression neural networks ICA imperialist competitive algorithm n number of samples in the dataset Pb bubble point pressure
PSO particle swarm optimization PVT pressure – volume – temperature R2 squared correlation coefficient RMSD root-mean-square deviation
Rs gas solubility
SCF STB-1 standard cubic feet of solution gas per standard barrels of oil
T temperature
cal. i
y predicted dependent variable of component i
exp. i
y experimental dependent variable of component i
exp.
y average of experimental dependent variables
γg gas specific gravity
γo oil specific gravity
μob oil bubble point viscosity
REFERENCES
Abooali, D. and Khamehchi, E., Estimation of dy-namic viscosity of natural gas based on genetic pro-gramming methodology. J. Nat. Gas. Sci. Eng., 21, 1025 (2014).
Ahmed, T., Reservoir Engineering Handbook. Gulf Professional Publishing (2010).
AlQuraishi, A. A., Determination of crude oil satura-tion pressure using linear genetic programming. Energy Fuels, 23, 884 (2009).
Asadisaghandi, J. and Tahmasebi, P., Comparative evaluation of back-propagation neural network learning algorithms and empirical correlations for prediction of oil PVT properties in Iran oilfields. J. Pet. Sci. Eng., 78, 464 (2011).
Bandyopadhyay, P. and Sharma, A., Development of a new semi analytical model for prediction of bub-ble point pressure of crude oils. J. Pet. Sci. Eng., 78, 719 (2011).
Elsharkawy, A. M., An empirical model for estimat-ing the saturation pressures of crude oils. J. Pet. Sci. Eng., 38, 57 (2003).
Elsharkawy, A. M. and Alikhan, A. A., Correlations for predicting solution gas/oil ratio, OFVF and undersaturated oil compressibility. J. Pet. Sci. Eng., 17, 291 (1997).
Farasat, A., Shokrollahi, A., Arabloo, M., Ghara-gheizi, F. and Mohammadi, A. H., Toward an in-telligent approach for determination of saturation pressure of crude oil. Fuel Process Technol., 115, 201 (2013).
Glaso, O., Generalized pressure-volume-temperature correlations. J. Pet. Technol., 32, 785 (1980). Khamehchi, E., Rashidi, F., Rasouli, H. and
Ebrahim-ian, A., Novel empirical correlations for estima-tion of bubble point pressure, saturated viscosity and gas solubility of crude oils. J. Petrol Sci., 6, 86 (2009).
Koza, J., Genetic Programming. Massachusetts Insti-tute of Technology. New York (1992).
Marhoun, M. A., PVT Correlations for Middle East Crude Oils. J. Pet. Technol., 40, 650 (1988). McCain, W. D., The Properties of Petroleum Fluids.
Petrosky, Jr. G. E. and Farshad, F., Pressure-volume-temperature correlations for Gulf of Mexico crude oils. SPE Res. Eval. Eng., 416-420 (1998). Rasouli, H., Rashidi, F. and Ebrahimian, A.,
Estimat-ing the bubble point pressure and formation vol-ume factor of oil using artificial neural networks. Chem. Eng. Technol., 31, 493 (2008).
Searson, D. P., GPTIPS: Genetic Programming & Symbolic Regression for MATLAB. http://gptips. sourceforge.net (2009).
Searson, D. P., Leahy, D. E. and Willis, M. J., GPTIPS: An open source genetic programming
toolbox for multigene symbolic regression. IMECS, March 17-19, Hong Kong (2010).
Shojaei, M-J., Bahrami, E., Barati, P. and Riahi, S., Adaptive neuro-fuzzy approach for reservoir oil bubble point pressure estimation. J. Nat. Gas. Sci. Eng., 20, 214 (2014).
Standing, M. B., A Pressure-volume-temperature correlation for mixtures of California oils and gases. API Drill Prod. Pract., 275-287 (1947). Vazquez, M. and Beggs, H. D., Correlations for fluid