: QUERCETINASE PRODUCTION AND GENETIC DIVERSITY
Costa, Eula Maria de M. B.1; Pimenta, Fabiana Cristina2; Luz, Christian3; Oliveira, Valéria de1; Oliveira, Marília4; Bueno, Elda4; Petrofeza, Silvana4*
1Laboratório de Bioconversão-LaBioCon, Faculdade de Farmácia, Universidade Federal de Goiás, Goiânia, GO, Brasil; 2Laboratório de Bacteriologia, Instituto de Patologia Tropical e Saúde Pública, Universidade Federal de Goiás, Goiânia, GO,
Brasil; 3Laboratório de Patologia de Invertebrados, Instituto de Patologia Tropical e Saúde Pública, Universidade Federal de Goiás, Goiânia, GO, Brasil; 4Laboratório de Biologia Molecular de Fungos, Instituto de Ciências Biológicas, Universidade Federal
de Goiás, Goiânia, GO, Brasil.
Submitted: June 03, 2010; Approved: November 04, 2010.
ABSTRACT
Beauveria bassiana genetic diversity and ability to synthesize quercetin 2,3-dioxygenase (quercetinase) were analyzed. B. bassiana isolates, obtained from Brazilian soil samples, produced quercetinase after induction using 0.5 g/L quercetin. B. bassiana ATCC 7159 (29.6 nmol/mL/min) and isolate IP 11 (27.5 nmol/ml/min) showed the best performances and IP 3a (9.5 nmol/mL/min) presented the lowest level of quercetinase activity in the culture supernatant. A high level of polymorphism was detected by random amplified polymorphic DNA (RAPD) analysis. The use of internal-transcribed-spacer ribosomal region restriction fragment length polymorphism (ITS-RFLP) did not reveal characteristic markers to differentiate isolates. However, the ITS1-5.8S-ITS2 region sequence analysis provided more information on polymorphism among the isolates, allowing them to be clustered by relative similarity into three large groups. Correlation was tested according to the Person's correlation. Data of our studies showed, that lower associations among groups, level of quercetinase production, or geographical origin could be observed. This study presents the production of a novel biocatalyst by B. bassiana and suggests the possible industrial application of this fungal species in large-scale biotechnological manufacture of quercetinase.
Key words: Beauveria bassiana, quercetinase, quercetin-2,3-dioxygenase, genetic diversity.
INTRODUCTION
Beauveria bassiana is a cosmopolitan, soil-born, and the most important entomopathogenic fungus (31, 33). Its characterization is based on isozymatic activities, entomopathogenicity, physiological characteristics, and
different DNA markers obtained by restriction fragment length polymorphism (RFLP), random amplified polymorphic DNA (RAPD), internal- transcribed-spacer ribosomal region (ITS) nucleotide sequences (4, 20), and microsatellites (7). Considerable genetic variability among B. bassiana isolates obtained from different insects and several geographical
origins has been described (6, 10).
B. bassiana secretes toxic proteins, such as beauvericin and oosporein (14). A toxic metabolite, named bassiacridin, and 19 enzymes produced by B. bassiana EABb 90/2-Dm, detected by API-ZYMTM (bioMérieux, Marcy l'Étoile, France)
system, have also been described (23).
Quercetin is a flavonoid that occurs widely in plants and is generally known to have a broad set of pharmacological effects on human health, including antimicrobial properties (13, 21). This compound is degraded by different fungi species in their extracellular enzyme system (27). In these organisms, quercetin-2,3-dioxygenase or quercetinase (EC.1.13.11.24) catalyzes the oxidative transformation of quercetin into 2-protocatechuoylphloroglucinol carboxylic acid by the insertion of molecular oxygen with the concomitant production of carbon monoxide (12, 16, 29).
A combination of screening for enzymes and biotechnology opens new and important possibilities for the industrial and commercial use of microbial enzymes (18). Quercetinase production has been reported for several fungi and any bacteria species, among which the most important are
Aspergillus japonicus, A. flavus, A. awamori, A. niger, A.
foetidus, A. oryzae, A. soyae, Penicillium minioluteum, P.
roquefortii, P. olsonii, Bacillus subtilis, Diapothe eres,
Neurospora crassa, and Diplodia gossypin (27, 29). However,
as far as we are concerned, no information on the production of quercetinase by B. bassiana is currently available.
This study aimed to verify quercetinase production by the isolates of B. bassiana, investigate the genetic variability of these isolates, and verify a possible correlation between genetic diversity and quercetinase production so that the results can improve our knowledge on B. bassiana enzyme production and help establish a novel biotechnological use for this fungus.
MATERIALS AND METHODS
Microorganisms
A total of 10 isolates of B. bassiana obtained from
Brazilian Cerrado soils plus the reference isolate ATCC 7159 strain were used in this study. The samples were collected in 2001 in natural reserves as follows: isolates IP 3a, IP 6, IP 8, IP 11, and IP 94 – Parque Nacional das Emas (17º50’–18º15’S, 52º30’–53º10’W) near the municipality of Chapadão do Céu; isolates IP 98, IP 129, and IP 132 – Chapada dos Veadeiros (13º51’–14º10’S, 47º25’–47º42’W) near the municipality of Alto Paraíso; isolates IP 147 and IP 153 – Estação Florestal do IBAMA (11º40’–55º7’S, 49º04’–03º09’W) near the municipality of Silvânia, all of them located in the state of Goiás, in the Midwestern Region of Brazil. The minimum distance between sampling areas was 350 km. The isolates were maintained in potato-dextrose agar (PDA) and stored in refrigerator at 4ºC until further use.
Induction of quercetinase production
A conidial suspension of each isolate (final concentration – 106 conidia/L), prepared in 25% (v/v) sterile glycerol to
7-day-old grown B. bassiana PDA plates, was inoculated into 100 mL of basic liquid medium (16) and incubated at 29ºC for 3 days on an orbital shaker at 200 rpm. Quercetinase production was induced at the end of the fungus exponential growth phase. To test quercetin as an inducer, this compound was dissolved in 5 mL of dimethylsulfoxyde (DMSO) to reach a final concentration of 0.5 g/L and aliquots of the culture were taken for analysis every 24 h for 4 days. All the experiments were carried out in triplicate. In the control experiment, the inducer was replaced with 5 mL of DMSO.
Optimal fungal growth had been previously established by our research group for B. bassiana (strain ATCC 7159) under non-induced (basal medium, no inducer) and non-induced (quercetin 0.5 g/L) conditions.
Enzyme assay
(0.1 M, pH 6) containing 30 L of a 10mM stock solution of quercetin in dimethyl sulfoxide and 30 L of centrifuged culture supernatant. Enzyme activities were expressed as specific activity (units mg -1 protein). Protein assays were
performed using the Protein Assay kit (Quant-iT -Invitrogen). One unit of quercetinase was defined as the amount of enzyme oxidizing 1 mol of quercetin per min.
Genotypic characterization
The extraction of genomic DNA from all the 11 isolates of B. bassiana was performed according to the CTAB method (5).
RAPD-PCR analysis
RAPD analysis of the isolates was carried out using 16 primers OPC, OPE, and OPW (Operon Technologies, Inc., Alameda, CA, USA). We prepared a final reaction volume of 30 µL containing 10 ng of template genomic DNA, 2.5 mM of
each of four dNTPs, 2.5 U Taq DNA polymerase (Invitrogen, Carlsbad, CA, USA), 1.5 mM MgCl2, 10X buffer. PCR
amplification was performed using a DNA thermocycler PTC 100 MJ with the following temperature profiles: 1 cycle at 95ºC for 5 min; 35 cycles at 94ºC for 1 min; 45ºC for 1 min; 72ºC for 2 min; and 1 cycle at 72ºC for 5 min. To ensure the reproducibility, PCR reactions for each isolate were performed in duplicate. RAPD-PCR products were separated by electrophoresis in 1.5% agarose gel using TBE buffer (2 mM EDTA; 0.1 M Tris-HCl; 0.1 M boric acid, pH 8.0) at 4 V/cm, visualized under UV light after ethidium bromide staining (0.5
µg/mL), and photographed using the Eagle Eye II photodocumentation system (Stratagene, New Jersey, USA). The λ phage DNA digested with EcoRI and HindIII was used as a molecular weight marker.
Data analysis
The RAPD bands were scored for their presence (1) or absence (0) at positions and the scores were assembled in a rectangular data matrix. Bands of the same size obtained by the same primer were scored as identical and only the ones repeated in at least two different PCR amplifications with the
same primer were evaluated. Dendrogram constructions were performed by cluster analysis using Jaccard’s coefficient and the unweighted pair-grouped method with arithmetic average (UPGMA). Person’s correlation coefficient (r) was estimated among the matrix of genetic distance (1 – index of similarity of Jaccard) and of geographical distances or level of quercetinase production. These data were analyzed using the NTSYSpc (Numerical Taxonomy and Multivariate Analysis System) package, Version 2.2 (24).
ITS-RFLP and ITS sequencing
A fragment of the ITS spacer region (ITS1 region, 5.8S gene and ITS2 region) was amplified by PCR utilizing the universal oligonucleotides ITS5 (5′GGAAGTAAAAGTCGTA ACAA-3′) and ITS4 (5′TCCTCGCTTATTGATATGA-3′)
(34). The reaction consisted of 0.25 µM of each oligonucleotide, 0.2 µM of each dNTP, 1.5 µM MgCl2, 50 mM
KCl, 10 mM Tris-HCl pH 8.4, 2.5 U Taq DNA polymerase (Invitrogen), 10 ng of genomic DNA, and Milli-Q H2O to a
final volume of 30 µL. Amplification was carried out in a PTC 100 thermocycler, programmed for a cycle of 94ºC for 3 min, followed by 40 cycles at 92ºC for 1.5 min, 42ºC for 1.5 min, 72ºC for 2.5 min, and a final extension at 72ºC for 5 min. The size and quality of the PCR product were determined by electrophoresis in 0.8% agarose gel stained with ethidium bromide (0.5 µg/mL) and visualized under UV light (25). The DNA size marker employed was λ phage DNA digested with Eco RI and Hind III (Gibco/BRL).
The PCR products of the ITS regions of the 11 isolates were digested according to the manufacturer’s recommendations, using 5 µL of each PCR product (300 ng)
and 5 to 10 units of the following restriction enzymes: Msp I,
Hae III, Taq I, and Ava I. The restriction fragments were
separated in 1.5% agarose gel, stained with ethidium bromide (0.5 µg/mL), and visualized under UV light. The size of the
After the analyses, the PCR products were sequenced directly according to the manufacturer’s instructions using a MegaBace 1000 automatic sequencer (Amersham Biosciences, Piscataway, NJ, USA). Each reaction mixture comprised 1 µL of ITS-PCR product (100 ng/µL), 4 µL of DYEnamic Kit ET DYE (Terminator Cycle Sequencing for MegaBace; Pharmacia Biotech, Denver, CO), 0.5 µL of oligonucleotide (0.5 µM), and Mili-Q water to a final volume of 10 µL. The amplification reactions were performed in a 96-well GeneAmp PCR System 9700 thermocycler (Applied Biosystem, Foster City, CA, USA) under the following conditions: initial denaturation at 96ºC for 2 min, 35 cycles at 96ºC for 10 s, 50ºC for 5 s, and 60ºC for 4 min. The quality of the chromatograms obtained was examined using the Phred program (8). The sequences generated were compared with existing data available in GenBank using the similarity search program Basic Local Alignment Search Tool (BLAST) (1,2), thereby exploring available sequences of DNA databanks. The sequences belonging to isolates classified as
Beauveria showing Phred quality scores > 20 were aligned
using the ClustalW program, and the genetic distance was calculated using the Kimura coefficient (17). The phylogenetic relationship among the nucleotide sequences of the isolates was determined using the phylogeny inference package (PHYLIP) program, version 3.5 (28). The confidence levels for the generated groupings were determined by bootstrap analysis (1000 repetitions) (9).
RESULTS
Enzyme assay
In this study, we focused only on quercetinase activity in the supernatant fraction, since we assumed that this activity would be more relevant to the role of quercetinase during the quercetin biotransformation process in order to obtain derivatives for pharmaceutical use.
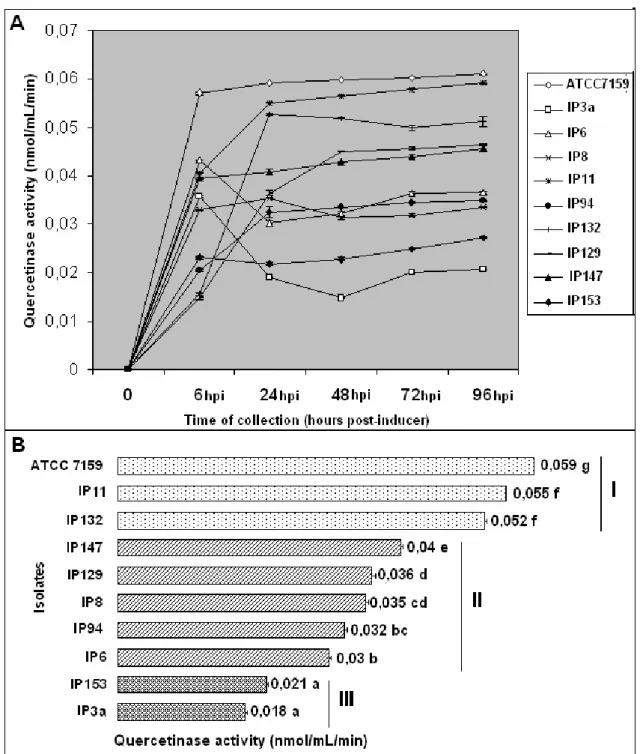
All isolates tested, including the reference strain, B. bassiana ATCC 7159, were able to produce quercetinase when grown on culture medium supplemented with quercetin.
Quercetinase production was monitored for a period of 96 h after induction. The accumulated enzyme activities showed markedly different patterns among the B. bassiana isolates tested. The analysis of variance of the scores given to the quercetinase production is shown in Table 1. A significant difference was detected among isolates (P < 0.01). Quercetinase activity varied by a factor of approximately 3 between the isolates under cultivation conditions. B. bassiana ATCC 7159 and IP 11 showed the highest levels of quercetinase activity and the isolate IP 3a showed the lowest one.
The highest level of quercetinase production was observed within the period of 24 h after induction with quercetin (Figure 1A). Considering this time, the isolates were separated into groups based on their quercetinase activity level: Group I, comprising high-productive isolates, ATCC 7159 (29.6 nmol/mL/min), IP 11 (27.5 nmol/ml/min), and IP 132 (26.4 nmol/mL/min); Group II, comprising isolates that presented an intermediary level of quercetinase production, IP 147 (20.4 nmol/mL/min), IP 129 (18.3 nmol/mL/min), IP 8 (18.2 nmol/mL/min), IP 94 (16.3 nmol/mL/min), and IP 6 (15.1 nmol/mL/min); and Group III, comprising low-productive isolates, IP 153 (10.9 nmol/mL/min) and IP 3a (9.5 nmol/mL/min) (Figure 1B). The Tukey test clearly showed that the patterns of enzyme production vary among isolates, but a specific pattern may also be shared by several isolates (Figure 1B). This evaluation time was chosen considering previous studies carried out by our group, which demonstrated drastic decrease in quercetin in the supernatant 24 h after the quercetin biotransformation process started.
Table 1. Analysis of variance for quercetinase production in the B. bassiana isolates.
Summary growth AV DF Sum Sq Mean Sq F value
Strains 10 0.00507 0.00056 432.2403 *
Residuals 20 0.00003 0.00000
Total 30 0.00510
Genotypic characterization
RAPD-PCR analysis: We selected 11 out of the 16 arbitrary primers tested since they generated reproducible banding patterns for RAPD-PCR. A total of 164 distinct bands, consistent with repeated amplifications, were amplified using the DNAs from the 11 B. bassiana isolates as templates. Depending on the isolate–primer combination, the bands were scored ranging in size from 0.4 kb to 3.2 kb among the isolates
of B. bassiana collected from different geographical areas
(Figure 2).
Distinct fingerprint types were observed for isolates
Figure 2. Agarose electrophoresis showing the random amplified polymorphic DNA (RAPD) and dendrogram constructed with UPGMA clustering method among isolates of Beauveria sp and B. bassiana ATCC 7159. Banding patterns amplified with six of the arbitrary primers used in this study: (A) Primer OPE 02; (B) Primer OPE 07; (C) Primer OPE 11; (D) Primer OPE 12; (E) Primer OPE 14; (F) Primer OPE 18. Lane 1 represents Beauveria bassiana ATCC 7159 and lanes 2 to 11 represent the isolates of Beauveria bassiana, IP3a, IP6, IP8, IP11, IP94, IP98, IP129, IP132, IP147, IP153, respectively; MM – molecular marker: Eco RI
and Hind III digested phage λ DNA; Similarities in dendrogram were computed from 164 random amplified polymorphic DNA
loci (G). The scale in the dendrogram is the genetic similarity coefficient calculated according to Jaccard. Numbers where the notes represent 1,000 replications were bootstrap-generated using the program WinBoot (32).
ITS-RFLP analysis and ITS sequencing
The ITS4 and ITS5 primers amplification for the 11 B. bassiana isolates tested resulted in a single product of approximately 600 bp, which was digested with four restriction enzymes. Two to five restriction fragments per PCR product were obtained among the 11 isolates depending on the enzyme used (data not shown). Ava I had no site in the amplified fragment. Hae III presented similar restriction fragments pattern for 9 isolates, and only isolates IP 147 and IP 153 showed different patterns. Msp I also presented similar restriction fragments pattern for 9 out of the 11 isolates, and Taq I digestion resulted in the same restriction pattern for all isolates.
The alignment of the partial sequences corresponding to the ITS1 region, 5.8S gene, and ITS2 region revealed similarity among the 11 isolates. The highest similarity was observed in the region corresponding to the 5.8S gene, and the highest diversity, in the corresponding ITS1 and ITS2 regions.
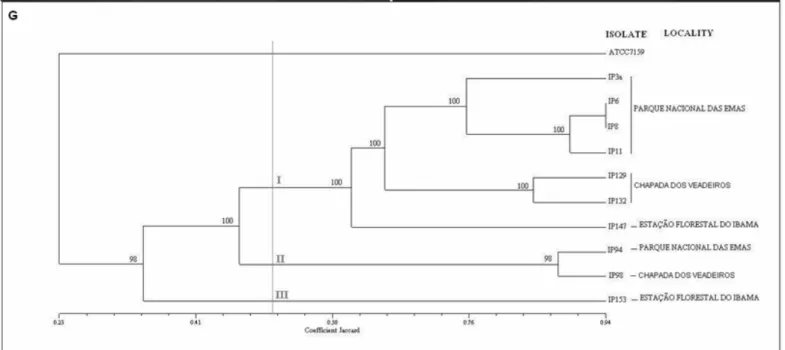
The genetic distance analysis permitted the distribution of the isolates into three groups (Figure 3), and those presenting the same restriction profile, determined by PCR-RFLP, showed variability in the sequence. These results suggest that ITS-RFLP does not provide characteristic markers for differentiating isolates of B. bassiana.
matrix of genetic distance and of geographical distances or level of quercetinase production, and a lower correlation (r=
0.003, and r = - 0,024, p <0.001) was found, respectively.
Figure 3. Neighbor-joining tree generated by Clustal X for the 11 partial sequences ITS1-5.8S-ITS2 regions of Beauveria bassiana. The sequences have been deposited in the GenBank and their accession numbers are in parentheses: IP 3a (FJ827072), IP 6 (FJ827070), IP 8 (FJ827075), IP 11 (FJ827071), IP 94 (FJ827074), IP 98 (FJ827076), IP 129 (FJ827073), IP 132 (FJ827077), IP 147 (FJ827079), IP 153(FJ827078).
DISCUSSION
To the best of our knowledge, quercetinase production by B. bassiana has been herein reported for the first time. All isolates investigated presented quercetinase activity using quercetin as potential quercetinase inducer. A study on inducers of quercetinase activity in Penicillium olsonii concluded that rutin, quercetin, and phloroglucinol carboxylic acid act as quercetinase inducers (30).
In our study, B. bassiana isolates presented different quercetinase activities. The kinetics of quercetinase production
by P. olsonii was fully expressed 4 days post-induction (29),
while for B. bassiana we observed rapid quercetinase secretion between 6 h to 24 h after induction, possibly because of quercetin antimicrobial properties (13), since rapid quercetinase production by microorganims could be a self-protection mechanism in response to the antimicrobial activity this flavonoid exhibits (19).
B. bassiana strain ATCC 7159 presented only 23%
quercetinase synthesis. The reasons for these facts remain unknown and should be investigated.
All the 11 isolates of B. bassiana presented high level of polymorphism based on RAPD-PCR analysis, which reflects a considerable genetic variability among isolates from the same geographical area or not. Our results are in agreement with data reported for the Beauveria genus fungi isolated in South America, which presented considerable genetic diversity (11), and are also in accordance with the high variability amongst B. bassiana populations from natural reserves already observed (33). It seems that isolates from natural reserves present considerable genetic diversity due to multiplicity of habitats and hosts.
In contrast with RAPD, the results obtained for ITS-RFLP did not provide characteristic markers to differentiate the isolates, probably because there is not enough variation in the region analyzed by the restriction enzymes tested. This lack of correlation could be explained by the fact that the primers and the restriction enzymes used in different molecular typing methods detect polymorphisms in different regions of the genome.
The ITS primers utilized in this study amplified a fragment with approximately 600 bp for all isolates, data also reported for B. bassiana collected in different Brazilian regions (26). Analysis at nucleotide level provided more informative and discriminatory results and the ITS sequences from all strains suggested that the isolates examined could have a common genetic basis with low variation at conserved regions. ITS sequences confirmed the identity of the isolates analyzed and discriminated them in three groups.
The genetic analysis, RAPD, and ITS did not provide a correlation between the geographical origin of the isolates and their genetic diversity. These observations are in consonance with data described in the literature (10).
Genetic variability among Beauveria species has been associated with toxin production and enzymatic activity (22). In our experiment, the isolates were clustered according to their
genetic diversity and lower association, according to the Person's correlation, could be established between the groups and their quercetinase production potential or geographical origin.
Future industrial-scale application of B. bassiana in biotechnological manufacturing of quercetinase is promising. Our results present a novel biocatalyst synthesized by B. bassiana and show that this can be a remarkable way to produce quercetinase using a biotechnological process.
REFERENCES
1. Altschul, S.F. (1991). Amino acid substitution matrices from an information theoretic perspective. J. Mol. Biol., 219(3): 555–565.
2. Altschul, S.F.; Madden, T.L.; Schäffer, A.A.; Zhang, J.; Zhang, Z.; Miller, W.; Lipman, D.J. (1997). Gapped BLAST and PSI-BLAST: a new generation of protein database search programs. Nucleic Acids Res., 25(17): 3389–3402.
3. Barney, B.M.; Schaab, M.R.; LoBrutto, R.; Francisco, W.A. (2004). Evidence for a new metal in a known active site: purification and characterization of an iron-containing quercetin 2,3-dioxygenase from
Bacillus subtilis. Protein Express. Purif., 35(1): 131–141.
4. Coates, B.S.; Hellmich, R.L.; Lewis, L.C. (2002). Beauveria bassiana
haplotype determination based on nuclear rDNA internal transcribed spacer PCR-RFLP. Mycol.Res., 106(1): 40–50.
5. Del Sal, G.; Manfioletti, G.; Schneider, C. (1989). The CTAB-DNA precipitation method: a common mini-scale preparation of template DNA from phagemids, phages or plasmids suitable for sequencing.
Biotechniques, 7(5): 514–520.
6. Devi, K.U.; Reineke, A.; Reddy, N.N.R.; Rao, C.U.M.; Padmavathi, J. (2006). Genetic diversity, reproductive biology, and speciation in the entomopathogenic fungus Beauveria bassiana (Balsamo) Vuillemin.
Genome, 49(5): 495–504.
7. Estrada, M.E.; Camacho, M.V.; Benito, C. (2007). The molecular diversity of different isolates of Beauveria bassiana (Bals.) Vuill. as
assessed using intermicrosatellites (ISSRs). Cell. Molec. Biol. Lett., 12(2): 240–252.
8. Ewing, B.; Hillier, L.; Wendl, M.C.; Green, P. (1998). Base-calling of automated sequencer traces using Phred. I. Accuracy assessment. Genome Res., 8(3): 175–185
9. Felsenstein, J. (1993). PHYLIP (Phylogeny Inference Package) version 3.5c. Seattle: Distributed by the author.
genetic variability of Beauveria bassiana isolates obtained from
Boophilus microplus tick. Parasitol. Res., 98(4): 324–332.
11. Glare, T.R.; Inwood, A. (1998). Morphological and genetic characterisation of Beauveria spp. from New Zealand. Mycol. Res., 102(2): 250–256.
12. Gurmu, D; Lu, J; Johnson, K.A.; Nordlund, P.; Holmgren, A.; Erlandsen, H. (2008). The crystal structure of the protein Yhak from Escherichia
coli reveals a new subclass of redox sensitive enterobacterial bicupins.
Proteins, 74(1): 18–31.
13. Havsteen, B.H. (2002). The biochemistry and medical significance of the flavonoids. Pharmacol. Ther., 96(2): 67–202.
14. Hegedus, D.D.; Khachatourians, G.G. (1995). The impact of biotechnology on hyphomycetous fungal insect biocontrol agents.
Biotechnol. Adv., 13(3): 455–490.
15. Hund, H.K.; Breuer, J.; Lingens, F.; Hüttermann, J.; Kappl, R.; Fetzner, S. (1999). Flavonol 2,4-dioxygenase from Aspergillus niger DSM 821, a
type 2 CuII-containing glycoprotein.
Eur. J. Biochem., 263(3): 871–878.
16. Iacazio, G. (2005). Increased quercetinase production by Penicillium
olsonii using fractional factorial design. Process Biochem., 40(1): 379–
384.
17. Kimura, M. (1993). The neutral theory of molecular evolution. Cambridge: Cambridge University Press.
18. Larsen, T.O.; Smedsgaard, J.; Nielsen, K.F.; Michel, E.H.; Frisvad, J.C. (2005). Phenotypic taxonomy and metabolite profiling in microbial drug discovery. Nat. Prod. Rep., 22(6): 672–695.
19. Merkens, H.; Fetzner, S. (2008). Transcriptional analysis of the queD gene coding for quercetinase od Streptomyces sp. FLA. FEMS Microbial
Lett., 287: 100–107.
20. Muro, M.A.; Mehta, S.; Moore, D. (2003). The use of amplified fragment length polymorphism for molecular analysis of Beauveria
bassiana isolates from Kenya and other countries, and their correlation with host and geographical origin. FEMS Microbiol. Lett., 229(2): 249– 257.
21. Murota, K.; Terao, J. (2003). Antioxidative flavonoid quercetin: implication of its intestinal absorption and metabolism. Arch. Biochem.
Biophys., 417(1):12–17.
22. Paccola-Meirelles, L.D.; Azevedo, J.L. (1990). Variabilidade natural do fungo entomopatogênico Beauveria bassiana. Arch. Biol. Technol., 33(3): 657–672.
23. Quesada-Moraga, E.; Vey, A. (2004). Bassiacridin, a protein toxic for locusts secreted by the entomopathogenic fungus Beauveria bassiana.
Mycol. Res., 108(4):441–452.
24. Rohlf, F.J. (1998). NTSYS-PC: Numerical Taxonomy and Multivariate
Analysis System. New York: Exeter Publishing.
25. Sambrook, J.; Fritsch, E.F.; Maniatis, T. (1989). T. Molecular cloning: a laboratory manual. 2nd ed. New York: Cold Spring Harbor Laboratory Press.
26. Santoro, H.P.; Neves, P.M.O.J.; Alexandre, T.M.; Sartori, D.; Alves, L.F.A.; Fungaro, M.H.P. (2008). Selection of Beauveria bassiana
isolates to control Alphitobius diaperinus. J. Invert. Pathol., 97(2): 83–
90.
27. Schaab, M.R.; Barney, B.M.; Francisco, W.A. (2006). Kinetic and spectroscopic studies on the quercetin 2,3-dioxygenase from Bacillus
subtilis. Biochem., 45(3): 1009–1016.
28. Serb, J.M.; Phillips, C.A.; Iverson, J.B. (2001). Molecular phylogeny and biogeography of Kinosternon flavescens based on complete mitochondrial control region sequences. Mol. Phylogenet. Evol., 18(1):
149–162.
29. Tranchimand, S.; Ertel, G.; Gaydou, V.; Gaudin, C.; Tron, T.; Iacazio, G. (2008). Biochemical and molecular characterization of a quercetinase from Penicillium olsonii. Biochimie, 90(5): 781–789.
30. Tranchimand, S.; Tron, T.; Gaudin, C.; Iacazio, G. (2005). Evaluation of phenolics and sugars as inducers of quercetinase activity in Penicillium
olsonii. FEMS Microbiol. Lett., 253(2): 289–294.
31. Uribe, D.; Khachatourians, G.G. (2004). Restriction fragment length polymorphism of mitochondrial genome of the entomopathogenic fungus
Beauveria bassiana reveals high intraspecific variation. Mycol. Res.,
108(9): 1070–1078.
32. Yap, I.V.; Nelson, R.J. (1996). Winboot: a program for performing bootstrap analysis of binary data to determine the confidence limits of UPGMA-based dendrograms. Manila: International Rice Research Institute.
33. Wang, S.; Miao, X.; Zhao, W.; Huang, B.; Fan, M.; Li, Z.; Huang, Y. (2005). Genetic diversity and population structure among strains of the entomopathogenic fungus, Beauveria bassiana, as revealed by inter-simple sequence repeats (ISSR). Mycol. Res., 109(12): 1364–1372. 34. White, T.J.; Bruns, T.; Lee, S.; Taylor, J.W. (1990). Amplification and
direct sequencing of fungal ribosomal RNA genes for phylogenetics, In: Innis, M.A.; Gelfand, D.H.; Sninsky, J.J.; White, T.J. (eds.). PCR
protocols: a guide to methods and applications. New York: Academic