R E S E A R C H A R T I C L E
Open Access
Global analysis of gene expression in mineralizing
fish vertebra-derived cell lines: new insights into
anti-mineralogenic effect of vanadate
Daniel M Tiago
1, Vincent Laizé
1, Luca Bargelloni
2, Serena Ferraresso
2, Chiara Romualdi
3and M Leonor Cancela
1,4*Abstract
Background: Fish has been deemed suitable to study the complex mechanisms of vertebrate skeletogenesis and
gilthead seabream (Sparus aurata), a marine teleost with acellular bone, has been successfully used in recent years
to study the function and regulation of bone and cartilage related genes during development and in adult
animals. Tools recently developed for gilthead seabream, e.g. mineralogenic cell lines and a 4 × 44K Agilent
oligo-array, were used to identify molecular determinants of in vitro mineralization and genes involved in
anti-mineralogenic action of vanadate.
Results: Global analysis of gene expression identified 4,223 and 4,147 genes differentially expressed (fold change
-FC > 1.5) during in vitro mineralization of VSa13 (pre-chondrocyte) and VSa16 (pre-osteoblast) cells, respectively.
Comparative analysis indicated that nearly 45% of these genes are common to both cell lines and gene ontology
(GO) classification is also similar for both cell types. Up-regulated genes (FC > 10) were mainly associated with
transport, matrix/membrane, metabolism and signaling, while down-regulated genes were mainly associated with
metabolism, calcium binding, transport and signaling. Analysis of gene expression in proliferative and mineralizing
cells exposed to vanadate revealed 1,779 and 1,136 differentially expressed genes, respectively. Of these genes, 67
exhibited reverse patterns of expression upon vanadate treatment during proliferation or mineralization.
Conclusions: Comparative analysis of expression data from fish and data available in the literature for mammalian
cell systems (bone-derived cells undergoing differentiation) indicate that the same type of genes, and in some
cases the same orthologs, are involved in mechanisms of in vitro mineralization, suggesting their conservation
throughout vertebrate evolution and across cell types. Array technology also allowed identification of genes
differentially expressed upon exposure of fish cell lines to vanadate and likely involved in its anti-mineralogenic
activity. Many were found to be unknown or they were never associated to bone homeostasis previously, thus
providing a set of potential candidates whose study will likely bring insights into the complex mechanisms of
tissue mineralization and bone formation.
Background
Vertebrate skeleton is a multifunctional organ providing
protection for soft tissues, structural support for muscle
and connective tissues, storage for calcium and
phos-phorus, and a site for haematopoietic cell production
and B lymphocyte maturation in adults [1].
Skeletogen-esis, i.e. skeleton formation during development, is a
process involving complex cellular and molecular
mechanisms associated with ossification and bone
remodeling. Both processes are known to be responsible
for maintaining bone mass and skeletal integrity
throughout life [2]. Skeletogenesis requires concerted
interplay between various cellular activities (e.g.
osteo-blast and chondrocyte differentiation [1]) and numerous
molecular determinants (e.g. skeletal proteins, growth
factors, transcriptional regulators and signaling pathways
[2]). Although human and mouse genetics have greatly
contributed to unveil the mechanisms involved in
skele-togenesis, information remains often insufficient for the
successful development of therapies targeting skeletal
diseases. Recent studies, reviewed by McGonnell and
* Correspondence: [email protected]1Centre of Marine Sciences (CCMAR), University of Algarve, Faro, Portugal
Full list of author information is available at the end of the article
© 2011 Tiago et al; licensee BioMed Central Ltd. This is an Open Access article distributed under the terms of the Creative Commons Attribution License (http://creativecommons.org/licenses/by/2.0), which permits unrestricted use, distribution, and reproduction in any medium, provided the original work is properly cited.
Fowkes [3], have demonstrated the suitability of fish
models to investigate vertebrate development and in
particular skeletogenesis. The resemblance of
biochem-ical and physiologbiochem-ical processes from fish to mammals,
the presence in fish of orthologs for most mammalian
genes, the similarities in organ morphology and systems
composition are among the traits that contributed to
the recent and rapid interest in fish models. Those
com-bined with technical advantages, e.g. large progeny,
external reproduction fast growth and translucent larvae,
and the power of fish genetics, have definitively
trans-formed fish systems as promising alternatives to
mam-malian systems. In fact, various fish mutants have
already been used to model human skeletal diseases:
osteogenesis imperfecta (an autosomal dominant
disor-der characterized by extreme bone fragility) can be
modeled by zebrafish chihuahua mutant [4]; craniofacial
syndromes (holoprosencephaly, campomelic dysplasia
and Ehlers-Danlos syndrome) can be modeled by
zebra-fish sonic you, jellyzebra-fish, and b4galt7 mutants [5,6],
idio-pathic scoliosis can be modeled by guppy curve back
mutant [7] and important efforts have consequently
been made towards the development of fish biochemical,
molecular, and cellular tools [8]. These include: (i) the
sequence of genomes of various fish models, e.g.
zebra-fish, green-spotted puffer zebra-fish, Japanese medaka and
stickleback; (ii) the development of large collections of
expressed sequence tags (EST) which were produced for
several fish species (e.g. Atlantic salmon [9], rainbow
trout [10], Atlantic halibut [11] or channel and blue
cat-fish [12]); (iii) the development of several microarray
platforms to explore these EST collections (e.g.
Nimble-gen Technology high-density oligo-array for the catfish
[13], parallel synthesis technology high-density DNA
microarray for the Atlantic halibut [14], Agilent
Sure-Print
™ Technology oligo-array for the largemouth bass
[15], the rainbow trout [16], and the gilthead seabream
Sparus aurata
[17]); and (iv) the development of several
fish-derived cell lines (the Fish Cell Line Database,
http://www.fcma.ualg.pt/edge/FICELdb.mht). To
investi-gate mechanisms of tissue mineralization, various
bone-derived cell lines of fish origin are available [18] and
gilthead seabream VSa13 and VSa16 cell lines (derived
from vertebra) are of particular interest due to their
pre-chondrocyte and pre-osteoblast phenotypes.
Although they are both capable of mineralizing their
extracellular matrix, VSa13 and VSa16 cell lines behave
differently regarding their degree of mineral deposition
[19], levels of alkaline phosphatase activity [19],
expres-sion of mineralogenic genes, e.g. matrix gla protein
(MGP), osteocalcin (OC), osteopontin (SPP1), bone
mor-phogenetic protein-2 (BMP-2)
[19-21], and susceptibility
to mineralogenic or anti-mineralogenic molecules,
e.g.
insulin, IGF-1, vanadate [22,23] and retinoic acid
[unpublished results]. They are therefore considered as
different bone cell types and common genes
differen-tially expressed during in vitro mineralization should
represent key mineralogenic genes, while other
differen-tially expressed genes would represent genes involved in
cell type-specific processes not related to mineralization.
In this work, we have used an Agilent Sureprint 4 ×
44K oligo-array, containing two non-overlapping probes
for each of 19,734 unique gene transcripts [17], to
ana-lyze global gene expression during in vitro
minerali-zation of these two cell lines. We have also identified
in VSa13 cell line the presence of mineralogenic
genes whose expression was altered upon cell
expo-sure to vanadate, a molecule with anti-mineralogenic
activity [23].
Results
Genes differentially expressed during
in vitro
mineralization of gilthead seabream vertebra-derived cell
lines
Confluent cultures of VSa13 and VSa16 cells were
culti-vated during 4 weeks under control (regular medium)
or mineralizing (regular medium supplemented with
cal-cium, phosphate and L-ascorbic acid) conditions.
Deposition of mineral nodules within extracellular
matrix was confirmed by von Kossa staining in cells
exposed to mineralization cocktail (Figure 1) and total
RNA was extracted from three biological replicates per
condition. After proper amplification and labeling, each
RNA sample was hybridized against the oligo-array and
raw expression data were extracted and filtered using
Figure 1 Pictures of chondrocyte (VSa13) and pre-osteoblast (VSa16) cells undergoing mineralization. Cultures were treated for 4 weeks under control or mineralizing conditions then von Kossa stained to reveal mineral deposition.
Agilent Feature Extraction 9.5.1 software, then
normal-ized. Quantile normalization showed the highest
agree-ment among replicates (i.e. lowest variation of
normalized fluorescence distribution among replicates;
data not shown) and was consequently used to
normal-ize raw data sets. Normalnormal-ized data sets were analyzed
through significance analysis of microarray (SAM) and
genes differentially expressed in control versus
minera-lizing conditions were identified. False discovery rate
(FDR) threshold was set at 5% and only probes with fold
change (FC) over 1.5 were considered. A total of 4,777
and 4,554 probes - corresponding to 3,011 and 3,049
unique genes - indicative of an up-regulated expression
were identified from VSa13 and VSa16 RNAs,
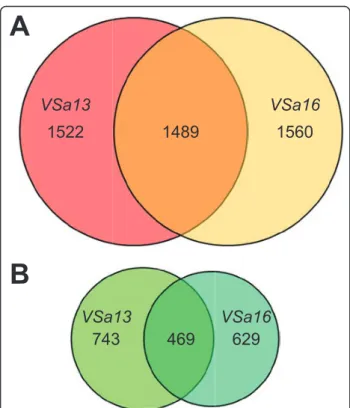
respec-tively. Among these genes, 1,489 were shown to be
common to both cell lines (Figure 2). Similarly, 2,359
and 1,642 probes - corresponding to 1,212 and 1,098
unique genes - indicative of a down-regulated
expres-sion were identified from VSa13 and VSa16 RNAs,
respectively. Among these genes, 469 were shown to be
common to both cell lines (Figure 2). In VSa13 and
VSa16 cells, 69% and 49% of differentially expressed
genes were simultaneously detected by two
non-overlap-ping probes, respectively, which could indicate the high
occurrence of alternative splicing. It could also be the
consequence of slight differences of hybridization
between the two probes. Indeed, most genes detected by
only one probe seem to follow the same pattern of
expression when compared to the second
non-signifi-cant probe. Raw and normalized fluorescence data have
been deposited in the GEO database under accession
numbers GSE18915 (VSa13) and GSE18941 (VSa16).
Ontology of mineralization-related genes
Genes differentially expressed during in vitro
mineraliza-tion were classified according to their putative Gene
Ontology (GO) - biological process (BP), molecular
function (MF) and cellular component (CP) - using
OBO-Edit software, AmiGO database [24] and SAPD
database [25], based on significant similarity with known
genes in public data bases. In general, a GO term could
be associated with less than 25% of
mineralization-related genes (% of BP/MF/CP was 19.2/24.3/18.5 in
VSa13 cells and 16.6/20.7/10.3 in VSa16 cells).
Com-parative analysis of GO classifications indicated that the
same type of genes, but not necessary the same genes,
were involved in extracellular matrix (ECM)
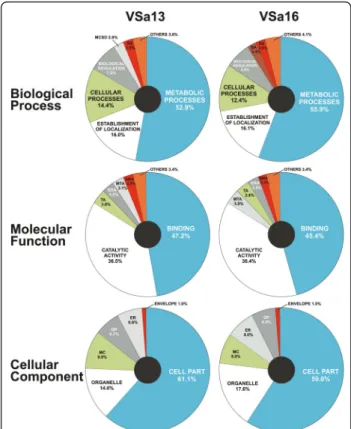
mineraliza-tion of both cell lines (Figure 3). Moreover, similar
occurrence of BP, MF and CP classes was observed in
genes common to both cell lines (Additional files 1, 2
and 3, Tables S1, S2 and S3). The most represented BP
classes (Figure 3A and Additional file 1, Table S1) were:
(i) metabolism (52.9% and 55.9% in VSa13 and VSa16
cells, respectively), (ii) establishment of localization (16%
and 16.1%; mostly related to transport), (iii) cellular
pro-cesses (14.4% and 12.4%, mostly related to signaling)
and (iv) regulation (7.8% and 6.9%, mostly associated to
cell cycle). Most MF classes were related to binding
activity (47.2% and 45.4%; mostly to nucleotides, ions
and nucleic acid) and catalytic activity (36.5% and
38.4%) (Figure 3B and Additional file 2, Table S2). A
smaller part was involved in transport, enzyme
regula-tion and molecular transducregula-tion activities (total of
10.1% and 10.7% in VSa13 and VSa16 cells,
respec-tively). Finally, most CP classes were related to cytosol
or membrane compartments (61.1% and 59.0%) and to
specific organelles (14.6% and 17.6%; nucleus,
endoplas-mic reticulum or Golgi complex). A smaller fraction was
associated to macromolecular complexes (9.9% and
8.0%), extracellular region (6.6% and 8.0%) and organelle
parts (6.7% and 6.4%). In a general manner, the
identifi-cation of numerous and diverse genes in both cell lines
suggested that ECM mineralization is a complex process
that requires tight regulatory mechanisms. In order to
understand which type of differentially expressed genes
were enriched in these cell lines, we performed a
func-tional annotation analysis using the
Database for
Anno-tation,
Visualization and Integrated Discovery (DAVID
v6.7, available at http://david.abcc.ncifcrf.gov[26,27]) and
VSa13
VSa16
1522
1489
1560
743
469
629
A
B
VSa13
VSa16
Figure 2 Venn diagrams of genes up-regulated (A) and down-regulated (B) during mineralization of VSa13 and VSa16 cells. A two class SAM test was performed; FDR and FC parameters were lower than 5% and higher than 1.5, respectively. Size of diagrams is proportional to the size of gene pools.
focused on processes with fold enrichment > 1.1 and
significance p-value < 0.05. In both cell lines, results
indicated an enrichment of genes associated with
bio-synthetic processes, cell cycle and growth, signaling,
protein synthesis, stress response, biological regulation
and metabolism (Table 1). Other processes such as
pro-tein interaction, DNA/RNA metabolism, development,
adhesion and bone, were cell type-specific (only
identi-fied in VSa16 cells), confirming that although both cell
lines are mineralogenic, they also represent different
bone cell types.
In an attempt to pinpoint the most relevant
mineralo-genic genes, we looked at genes with a FC > 10 (FDR
was maintained to < 5%). A total of 46/48 up-regulated
and 49/49 down-regulated genes were identified in
VSa13 and VSa16 cells, respectively. Most of them (61%
in VSa13 cells and 59% in VSa16 cells) did not match
any known gene (Additional files 4, 5, 6 and 7, Tables
S4, S5, S6 and S7). Of these genes, 33 were common to
both cell lines, GO analysis indicated that up-regulated
genes were mainly associated with (i) transport, (ii)
matrix/membrane, (iii) metabolism and (iv) signaling,
while down-regulated genes were mainly associated with
(i) metabolism, (ii) calcium binding, (iii) transport and
(iv) signaling.
Proliferative and anti-mineralogenic effects of vanadate:
identification of genes with significant patterns of
expression
In order to further investigate genes involved in ECM
mineralization, we exposed dividing and mineralizing
VSa13 cells to vanadate, an ultra-trace metal with
anti-mineralogenic effect in fish vertebra-derived cell lines,
and analyzed global gene expression. Any gene
differen-tially expressed upon vanadate treatments would be
potentially important for differentiation/mineralization
mechanisms. As expected from previous studies [23,28],
cell proliferation was stimulated by vanadate at
concen-trations up to 7.5
μM, while ECM mineralization was
inhibited by vanadate at concentrations up to 5
μM
(Figure 4). Total RNA was collected from three
biologi-cal replicates of proliferating and mineralizing VSa13
cells exposed to vanadate or left untreated. After proper
amplification and labeling, each RNA sample was
hybri-dized against gilthead seabream oligo-array and data
were extracted, normalized, and analyzed as previously
described. Differentially expressed genes were identified
through a two-class SAM analysis with FDR < 5% and
FC > 1.5 in the following data sets: i) control versus
mineralization: 4,223 differentially expressed genes
(3,011 up- and 1,212 down-regulated genes), ii)
minera-lization versus mineraminera-lization + vanadate: 1,136
differen-tially expressed genes (406 up- and 730 down-regulated
genes), and iii) proliferation versus proliferation +
vana-date: 1,779 differentially expressed genes (496 up- and
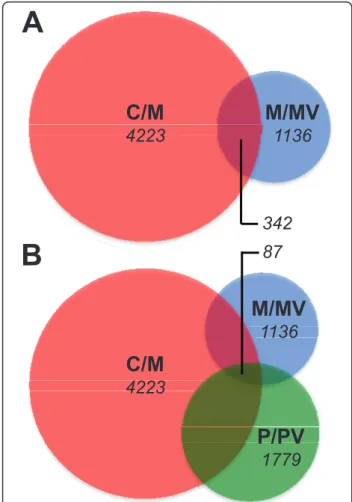
1283 down-regulated genes). Among those genes, 342
were common to conditions i) and ii) (Figure 5A). In
order to identify key mineralogenic genes in VSa13 cells,
we looked at genes which expression was oppositely
regulated during in vitro mineralization and upon
vana-date treatment. These genes and their respective GO
categories are listed in Table 2 and could be classified
according to a score calculated as the ratio between
FCM
(control versus mineralization) and FCMV
(minera-lization versus minera(minera-lization + vanadate). Most genes
Figure 3 Pie chart representations of GO entries occurrenceamong genes detected in VSa13 and VSa16 cells. Pie charts represent biological processes, molecular function and cellular component GO entries occurrence among differentially expressed genes in control versus mineralized VSa13 and VSa16 cells. Raw data were normalized using the quantile method and a two class SAM test was performed; FDR and FC were lower than 5% and higher than 1.5, respectively. Biological processes GO entries were associated with 19.2% (VSa13) and 16.6% (VSa16) of identified genes; molecular function GO entries were associated with 24.3% (VSa13) and 20.7% (VSa16) of identified genes; and cellular component GO entries were associated to 18.5% (VSa13) and 10.3% (VSa16) of identified genes. GO definitions: BA, biological adhesion; ER, extracellular region; ERA, enzyme regulator activity; MC, macromolecular complex; MCSO, macromolecular complex subunit organization; MTA, molecular transducer activity; OP, organelle part; RS, response to stimulus; SMA, structural molecule; TA, transporter activity. Additional information on GO definition is available in Additional files 1, 2 and 3, Tables S1, S2 and S3.
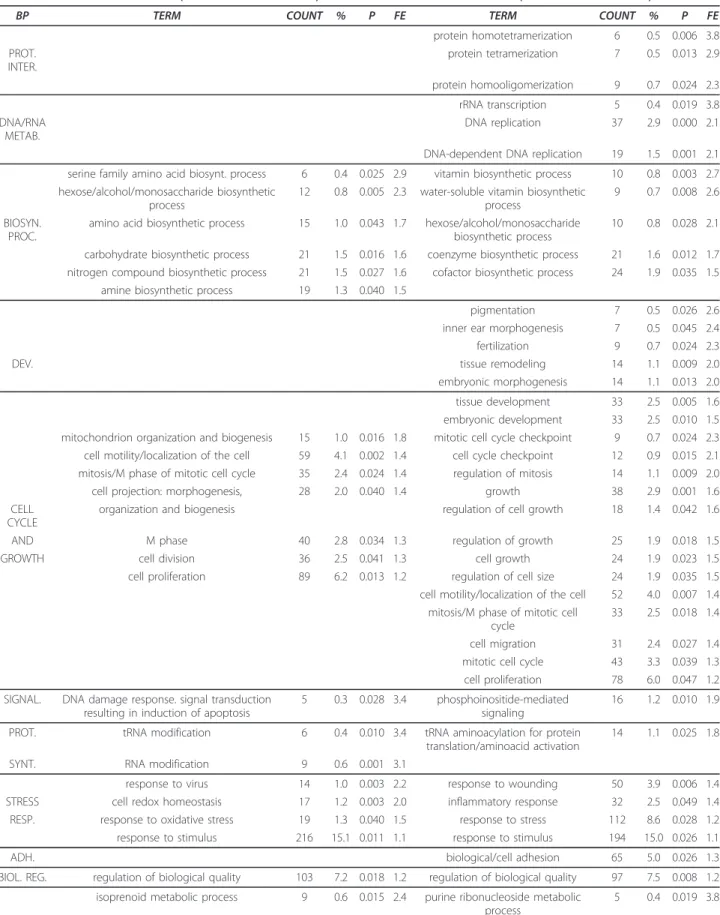
Table 1 List of biological processes GO categories enriched among genes differentially expressed in mineralizing
VSa13 and VSa16 cells
VSa13 (CHONDROCYTIC LINEAGE) VSa16 (OSTEOBLASTIC LINEAGE)
BP TERM COUNT % P FE TERM COUNT % P FE
protein homotetramerization 6 0.5 0.006 3.8 PROT. INTER. protein tetramerization 7 0.5 0.013 2.9 protein homooligomerization 9 0.7 0.024 2.3 rRNA transcription 5 0.4 0.019 3.8 DNA/RNA METAB. DNA replication 37 2.9 0.000 2.1 DNA-dependent DNA replication 19 1.5 0.001 2.1 serine family amino acid biosynt. process 6 0.4 0.025 2.9 vitamin biosynthetic process 10 0.8 0.003 2.7 hexose/alcohol/monosaccharide biosynthetic
process
12 0.8 0.005 2.3 water-soluble vitamin biosynthetic process
9 0.7 0.008 2.6 BIOSYN.
PROC.
amino acid biosynthetic process 15 1.0 0.043 1.7 hexose/alcohol/monosaccharide biosynthetic process
10 0.8 0.028 2.1 carbohydrate biosynthetic process 21 1.5 0.016 1.6 coenzyme biosynthetic process 21 1.6 0.012 1.7 nitrogen compound biosynthetic process 21 1.5 0.027 1.6 cofactor biosynthetic process 24 1.9 0.035 1.5
amine biosynthetic process 19 1.3 0.040 1.5
pigmentation 7 0.5 0.026 2.6 inner ear morphogenesis 7 0.5 0.045 2.4 fertilization 9 0.7 0.024 2.3
DEV. tissue remodeling 14 1.1 0.009 2.0
embryonic morphogenesis 14 1.1 0.013 2.0 tissue development 33 2.5 0.005 1.6 embryonic development 33 2.5 0.010 1.5 mitochondrion organization and biogenesis 15 1.0 0.016 1.8 mitotic cell cycle checkpoint 9 0.7 0.024 2.3 cell motility/localization of the cell 59 4.1 0.002 1.4 cell cycle checkpoint 12 0.9 0.015 2.1 mitosis/M phase of mitotic cell cycle 35 2.4 0.024 1.4 regulation of mitosis 14 1.1 0.009 2.0 cell projection: morphogenesis, 28 2.0 0.040 1.4 growth 38 2.9 0.001 1.6 CELL
CYCLE
organization and biogenesis regulation of cell growth 18 1.4 0.042 1.6 AND M phase 40 2.8 0.034 1.3 regulation of growth 25 1.9 0.018 1.5 GROWTH cell division 36 2.5 0.041 1.3 cell growth 24 1.9 0.023 1.5 cell proliferation 89 6.2 0.013 1.2 regulation of cell size 24 1.9 0.035 1.5 cell motility/localization of the cell 52 4.0 0.007 1.4
mitosis/M phase of mitotic cell cycle
33 2.5 0.018 1.4 cell migration 31 2.4 0.027 1.4 mitotic cell cycle 43 3.3 0.039 1.3 cell proliferation 78 6.0 0.047 1.2 SIGNAL. DNA damage response. signal transduction
resulting in induction of apoptosis
5 0.3 0.028 3.4 phosphoinositide-mediated signaling
16 1.2 0.010 1.9 PROT. tRNA modification 6 0.4 0.010 3.4 tRNA aminoacylation for protein
translation/aminoacid activation
14 1.1 0.025 1.8 SYNT. RNA modification 9 0.6 0.001 3.1
response to virus 14 1.0 0.003 2.2 response to wounding 50 3.9 0.006 1.4 STRESS cell redox homeostasis 17 1.2 0.003 2.0 inflammatory response 32 2.5 0.049 1.4 RESP. response to oxidative stress 19 1.3 0.040 1.5 response to stress 112 8.6 0.028 1.2 response to stimulus 216 15.1 0.011 1.1 response to stimulus 194 15.0 0.026 1.1
ADH. biological/cell adhesion 65 5.0 0.026 1.3
BIOL. REG. regulation of biological quality 103 7.2 0.018 1.2 regulation of biological quality 97 7.5 0.008 1.2 isoprenoid metabolic process 9 0.6 0.015 2.4 purine ribonucleoside metabolic
process
Table 1 List of biological processes GO categories enriched among genes differentially expressed in mineralizing
VSa13 and VSa16 cells (Continued)
glutathione metabolic process 8 0.6 0.033 2.3 ribonucleoside/glycine metabolic process
6 0.5 0.017 3.2 pyruvate metabolic process 11 0.8 0.017 2.1 retinoid/diterpenoid metabolic
process
5 0.4 0.046 3.1 gluconeogenesis 9 0.6 0.043 2.1 aldehyde metabolic process 6 0.5 0.035 2.8 mitochondrial transport 12 0.8 0.032 1.9 serine family amino acid metabolic
process
12 0.9 0.002 2.5 sulfur metabolic process 17 1.2 0.010 1.8 glutamine family amino acid metab.
process
12 0.9 0.004 2.4 water-soluble vitamin metabolic process 13 0.9 0.049 1.7 nucleoside/pyridine nucleotide
metab. process
10 0.8 0.011 2.4 glucose metabolic process 26 1.8 0.010 1.6 water-soluble vitamin metabolic
process
16 1.2 0.001 2.3 glucose catabolic process 17 1.2 0.037 1.6 gluconeogenesis 9 0.7 0.024 2.3 vitamin/alcohol metabolic process 18 1.3 0.039 1.6 oxygen and ROS metabolic process 8 0.6 0.033 2.3 nucleotide metabolic process 47 3.3 0.001 1.5 vitamin metabolic process 23 1.8 0.000 2.2 nucleobase. nucleoside and nucleotide
metabolic process
49 3.4 0.002 1.5 pyruvate metabolic process 10 0.8 0.028 2.1 monosaccharide metabolic process 32 2.2 0.016 1.5 glucose metabolic process 26 2.0 0.002 1.8 carboxylic/organic acid metab. process 102 7.1 0.000 1.4 glucose catabolic process 17 1.3 0.015 1.8 amino acid and derivative metabolic process 67 4.7 0.002 1.4 amino acid catabolic process 15 1.2 0.025 1.8 amino acid metabolic process 54 3.8 0.008 1.4 alcohol catabolic process 18 1.4 0.015 1.7 monocarboxylic acid metabolic process 45 3.1 0.015 1.4 hexose/monosaccharide catabolic
process
17 1.3 0.026 1.7 hexose metabolic process 31 2.2 0.023 1.4 amine/nitrogen compound
catabolic process
16 1.2 0.034 1.7 fatty acid metabolic process 31 2.2 0.034 1.4 monosaccharide metabolic process 31 2.4 0.007 1.6 METAB. lipid biosynthetic process 32 2.2 0.040 1.4 aromatic compound metabolic
process
23 1.8 0.012 1.6 amine metabolic process 74 5.2 0.006 1.3 carbohydrate catabolic process 21 1.6 0.025 1.6 nitrogen compound metabolic process 75 5.2 0.010 1.3 tRNA metabolic process 19 1.5 0.026 1.6
alcohol metabolic process 47 3.3 0.021 1.3 cellular carbohydrate catabolic process
20 1.5 0.032 1.6 cellular carbohydrate metabolic process 52 3.6 0.036 1.3 amino acid metabolic process 54 4.2 0.001 1.5
catabolic process 106 7.4 0.012 1.2 nucleobase. nucleoside and nucleotide metabolic process
46 3.5 0.001 1.5 lipid metabolic process 85 5.9 0.012 1.2 nucleotide metabolic process 42 3.2 0.003 1.5 cellular lipid metabolic process 69 4.8 0.037 1.2 coenzyme metabolic process 37 2.9 0.011 1.5 hexose metabolic process 30 2.3 0.011 1.5 carboxylic/organic acid metabolic
process
97 7.5 0.000 1.4 amine metabolic process 72 5.6 0.001 1.4 amino acid and derivative
metabolic process
62 4.8 0.002 1.4 nitrogen compound metabolic
process
73 5.6 0.002 1.4 cofactor metabolic process 46 3.5 0.007 1.4 cellular carbohydrate metabolic
process
51 3.9 0.009 1.4 carbohydrate metabolic process 67 5.2 0.009 1.3 alcohol metabolic process 43 3.3 0.026 1.3 cellular catabolic process 84 6.5 0.017 1.2 catabolic process 95 7.3 0.027 1.2 lipid metabolic process 75 5.8 0.037 1.2 cellular lipid metabolic process 63 4.9 0.043 1.2
were shown to be associated with metabolism, cell
matrix/adhesion, signaling and calcium binding. Fewer
genes were associated with apoptosis, transport,
proteo-lysis, structural activity, translation and growth.
Finally, proliferative and anti-mineralogenic effects of
vanadate suggest that its mechanism of action may be
associated with cell differentiation. Therefore, genes
that followed i) opposite expression between
minerali-zation and mineraliminerali-zation upon vanadate treatment and
ii) concordant expression between vanadate treatments
during proliferation and vanadate treatments during
mineralization should be of particular interest. A total
of 136 genes were differentially expressed when
com-paring data sets of dividing and mineralizing cell
cul-tures exposed to vanadate. Among those genes, 87
genes were also differentially expressed during in vitro
mineralization without vanadate (Figure 5B) and genes
that fit into the pattern of expression described above
were associated to their respective GO categories and
listed in Table 3 according to highest FC values. Most
genes were associated with metabolism, signaling
and cell matrix adhesion. Fewer genes were related to
proteolysis, calcium binding, cell cycle and DNA
replication.
Validation of microarray data by quantitative real-time
PCR analysis of gene expression
Twelve genes differentially expressed during in vitro
mineralization as for microarray data (6 up- and 6
down-regulated genes) were selected for validation by
quantitative real-time PCR (qPCR) according to the
fol-lowing criteria: two genes with FC > 10, two genes with
10 > FC > 2, and two genes with 2 > FC > 1.5 for each
cell line. Comparative analysis of microarray and qPCR
expression data is presented in Figure 6. Analysis of
Pearson correlation revealed coefficients higher than 0.9
for both cell lines (strong correlation) when comparing
data from microarray probes 1 and 2, and coefficients
between 0.4 and 0.5 for VSa13 cells (moderate
correla-tion) and between 0.5 and 0.8 for VSa16 cells
(moder-ately high correlation) when comparing data from
microarray and qPCR. The individual analysis of each
gene revealed that FC measured by qPCR were always
higher (p < 0.05) than that measured by microarray
(with the exception of RAR-b in VSa13 cells), suggesting
a higher sensitivity of qPCR analysis.
Similarly, 6 genes differentially expressed in
mineraliz-ing cells exposed to vanadate (3 up- and 3
down-regu-lated genes) were selected for validation of microarray
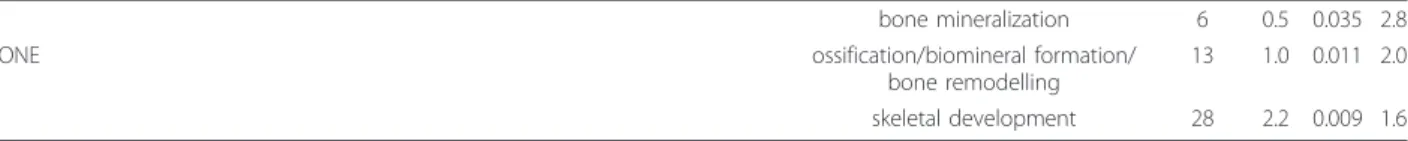
Table 1 List of biological processes GO categories enriched among genes differentially expressed in mineralizing
VSa13 and VSa16 cells (Continued)
bone mineralization 6 0.5 0.035 2.8
BONE ossification/biomineral formation/
bone remodelling
13 1.0 0.011 2.0 skeletal development 28 2.2 0.009 1.6
Functional annotation tool from the database for annotation, visualization and integrated discovery (DAVID; v6.7) has been used to identify significant biological processes among differentially expressed genes. p < 0.05 (P) and fold enrichment (FE) was higher than 1.1.
Figure 4 Effect of vanadate on VSa13 cell proliferation (A) and ECM mineralization (B). For proliferation experiments VSa13 cells were seeded in 96-well plates at 1.5 × 10³cells/well then either left untreated or treated with 2.5, 5 and 7.5μM of vanadate. Cell proliferation was evaluated after 8 days using MTS assay. For ECM mineralization experiments VSa13 cells were seeded in 24-well plates at 2 × 10⁴cells/well, grown until confluence then treated for mineralization. Mineralizing cultures were then either left untreated or treated with 5μM vanadate. Mineral deposition was revealed after 4 weeks by von Kossa staining and evaluated by densitometry analysis. Asterisk indicates values statistically different from corresponding controls (n≥ 3; P < 0.05; one-way ANOVA).
data by qPCR (Figure 7). Analysis of Pearson
correla-tion revealed coefficients higher than 0.99 (strong
cor-relation) when comparing data from microarray probes
1 and 2, and higher than 0.9 (strong correlation) when
comparing data from microarray and qPCR. In general,
correlation coefficients were shown to be higher
among genes analyzed in vanadate-treated VSa13
cells than among those analyzed in mineralizing VSa13
and VSa16 cells. This difference could in part be
explained by the lower FC values observed among
genes identified in vanadate-treated cells and
conse-quent lower tendency for FC compression of
oligo-array data.
Discussion
Gilthead seabream oligo-array is a suitable tool to
analyze global gene expression of mineralogenic gilthead
seabream cell lines
In the present study, a comprehensive set of data has
been produced following hybridization of an Agilent
4x44K oligo-array with RNA samples prepared from
control, mineralizing and vanadate-treated gilthead
seab-ream vertebra-derived cell samples. A two-class SAM
analysis identified mineralogenic genes, some of which
had already been previously investigated during in vitro
mineralization of VSa13 and VSa16 cells through a
can-didate gene approach, e.g. tissue non-specific alkaline
phosphatase
(TNAP; unpublished data), BMP-2 [21],
SPP1
[20], MGP and OC [19]. At first glance, a good
correlation (i.e. similar type and extent of regulation)
between microarray and pre-existing data was observed.
This good correlation was later confirmed through
qPCR analysis, although a tendency for FC value
com-pression of oligo-array data was also noted. A similar
fold-change compression was observed by Wang et al.
while validating two commercial long-oligonucleotide
microarray platforms, Applied Biosystems and Agilent,
through large scale qPCR analysis of gene expression
[29], and more recently by Ferraresso and colleagues
while using Agilent gilthead seabream oligo-array [17].
Although our microarray data exhibited a dynamic
range inferior to that of qPCR data, a situation which
was somehow expected, they were generally accurate;
Agilent seabream oligo-array therefore represent a
valu-able tool for simultaneous analysis of the expression of
thousands of genes.
In vitro mineralization recruits similar genes in fish and in
mammalian bone-derived systems
Putative mineralogenic genes, i.e. those differentially
expressed during in vitro mineralization of VSa13 and
VSa16 cells, presented a similar distribution into GO
categories. Approximately half of those genes were
shown to be common to VSa13 and VSa16 cells,
indi-cating that both cell lines, although representing
differ-ent cell types, recruit similar genes and processes
during mineralization. Some biological processes were
however differentially enriched in both cell lines. In
particular, genes related to GO categories bone
minera-lization, biomineral formation, remodeling, ossification
and skeletal development were enriched in mineralizing
VSa16 pre-osteoblast cells, and not in mineralizing
VSa13 pre-chondrocyte cells. Another goal of this
study was to investigate the conservation of
mineraliza-tion mechanisms throughout evolumineraliza-tion by comparing
pattern of gene expression in fish and mammalian
C/M
4223
M/MV
1136
P/PV
1779
C/M
4223
M/MV
1136
A
B
342
87
Figure 5 Venn diagrams of differentially expressed genes in vanadate-treated VSa13 cells. (A) Genes detected in mineralizing cells (C/M) were compared with genes detected in mineralizing cells treated with vanadate (M/MV). (B) Genes detected in C/M were compared with genes detected in M/MV and with genes detected in proliferating cells treated with vanadate (P/PV). Two-class SAM tests were performed with FDR and FC limits lower than 5% and higher than 1.5, respectively. Size of diagrams is proportional to the size of gene pools.
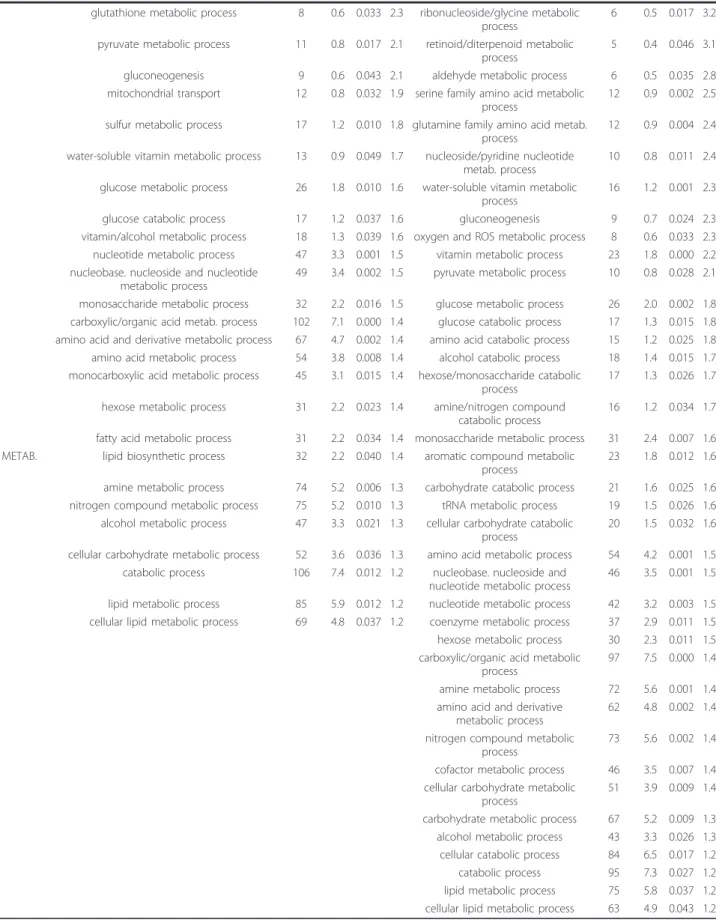
Table 2 Gene description (according to SAPD database [28]), GO classification, FC and scores of common genes
regulated during mineralization of VSa13 cells (FC
M)
versus mineralization with vanadate (FC
MV)
Gene description GOBP/MF FCM FCMV Score
Photoreceptor outer segment all-trans retinol dehydrogenase [Source:IPIAcc:IPI00024598]
metabolic process/oxidoreductase activity 34,8 0,14 240,1 AMBP protein precursor [Source:Uniprot/SWISSPROTAcc:P02760] -/- 47,4 0,36 131,5 Ependymin related protein-1 precursor [Source:IPIAcc:IPI00554718] cell-matrix adhesion/calcium ion binding 15,2 0,14 111,8 Xaa-Pro aminopeptidase 2 precursor [Source:Uniprot/
SWISSPROTAcc:O43895]
proteolysis, creatine metabolic process/ metalloexopeptidase activity, hydrolase activity, creatinase
activity
27,2 0,25 110,2
No match -/- 28,2 0,31 89,73
Microtubule-associated proteins 1A/1B light chain 3C precursor [Source:Uniprot/SWISSPROTAcc:Q9BXW4]
-/- 12,6 0,14 89,63
Cell death activator CIDE-3 [Source:Uniprot/SWISSPROTAcc: Q96AQ7]
apoptosis/protein binding 7,77 0,17 45,71
No match -/- 25,5 0,61 41,50
No match -/- 12,7 0,32 39,97
PREDICTED: hypothetical protein [Danio rerio] pore complex biogenesis/channel activity 18,3 0,52 35,20 Hypothetical protein LOC447879 [Source:RefSeq_peptideAcc:
NP_001004618]
integrin-mediated signaling pathway/- 9,55 0,29 32,64
No match -/- 17,5 0,54 32,31
Granulocyte-macrophage colony-stimulating factor receptor alpha chain precursor [Source:Uniprot/SWISSPROTAcc:P15509]
-/- 8,69 0,29 29,83
No match -/- 5,77 0,21 27,18
IgGFc-binding protein precursor [Source:Uniprot/SWISSPROTAcc: Q9Y6R7]
cell adhesion/- 4,35 0,19 23,12
No match -/- 6,28 0,28 22,13
Hydroxyacid oxidase 2 [Source:Uniprot/SWISSPROTAcc:Q9NYQ3] metabolic process, electron transport/oxidoreductase activity
5,21 0,24 21,38
No match -/- 7,70 0,39 19,85
No match -/- 7,35 0,37 19,79
Phosphatase and actin regulator 4 isoform 1 [Source: RefSeq_peptideAcc:NP_001041648]
-/- 4,95 0,27 18,08
Ependymin related protein-1 precursor [Source:IPIAcc:IPI00554718] cell-matrix adhesion/calcium ion binding 2,54 0,14 18,02
No match -/- 8,95 0,52 17,26
No match -/- 10,6 0,62 17,00
No match -/- 6,53 0,39 16,57
Glucose-6-phosphate 1-dehydrogenase [Source:Uniprot/ SWISSPROTAcc:P11413]
glucose metabolic process/glucose-6-phosphate dehydrogenase activity
4,30 0,27 16,05 Glutamate–cysteine ligase catalytic subunit [Source:Uniprot/
SWISSPROTAcc:P48506]
-/- 4,71 0,29 16,04
Complement factor I precursor [Source:Uniprot/SWISSPROTAcc: P05156]
proteolysis/catalytic activity, serine-type endopeptidase activity, hydrolase activity, scavenger receptor activity
2,58 0,16 15,91 No match -/- 5,66 0,41 13,71 No match -/- 4,30 0,33 12,95 No match -/- 3,64 0,29 12,77 No match -/- 4,93 0,39 12,73 No match -/- 5,41 0,43 12,69
Hypothetical protein LOC406276 [Source:RefSeq_peptideAcc: NP_998168]
Table 2 Gene description (according to SAPD database [28]), GO classification, FC and scores of common genes
regu-lated during mineralization of VSa13 cells (FC
M)
versus mineralization with vanadate (FC
MV) (Continued)
Hypothetical protein LOC336637 [Source:RefSeq_peptideAcc: NP_956317]
cell redox homeostasis/- 4,66 0,38 12,17 Actin filament-associated protein 1-like 2. [Source:Uniprot/
SWISSPROTAcc:Q8N4X5]
-/- 5,69 0,48 11,79
Transcribed locus, weakly similar to NP_175293.1 [Source: UniGeneAcc:Tru.931]
metabolic process/methyltransferase activity 2,82 0,24 11,69
No match -/- 5,96 0,51 11,66
Ornithine carbamoyltransferase, mitochondrial precursor [Source: Uniprot/SWISSPROTAcc:P00480]
-/ornithine carbamoyltransferase activity, amino acid binding
4,17 0,37 11,38
No match -/- 4,83 0,42 11,38
CDNA FLJ31025 fis, clone HLUNG2000501. [Source:Uniprot/ SPTREMBLAcc:Q96ND9]
-/- 3,80 0,34 11,25
No match -/- 3,71 0,34 11,05
No match -/- 4,39 0,40 10,89
No match -/- 4,76 0,45 10,59
Stromal cell-derived factor 1 precursor [Source:Uniprot/ SWISSPROTAcc:P48061]
-/- 3,94 0,38 10,36
ADM precursor [Source:Uniprot/SWISSPROTAcc:P35318] -/- 3,68 0,36 10,10 Beta-2-glycoprotein 1 precursor [Source:Uniprot/SWISSPROTAcc:
P02749]
-/- 4,44 0,44 10,05
No match -/- 3,37 0,34 10,03
No match -/- 0,05 5,03 102,8
Signal peptide, CUB and EGF-like domain-containing protein 2 precursor [Source:Uniprot/SWISSPROTAcc:Q9NQ36]
-/calcium ion binding 0,09 7,02 78,01
No match -/- 0,18 10,7 58,98
Actin, alpha skeletal muscle 1. [Source:Uniprot/SWISSPROTAcc: P68140]
-/structural molecule activity, ATP binding, protein binding 0,44 17,1 38,39
No match -/- 0,05 1,77 36,79
No match -/- 0,09 3,03 34,37
No match -/- 0,45 14,9 33,47
Inter-alpha globulIn InhIbItor H3 [Source:IPIAcc:IPI00028413] hyaluronan metabolic process/serine-type endopeptidase inhibitor activity
0,18 4,41 24,67
No match -/- 0,09 1,92 21,62
Hypothetical protein LOC553753 [Source:RefSeq_peptideAcc: NP_001018560]
-/protein binding 0,13 2,84 21,14
No match -/- 0,15 3,18 20,60
Tenascin precursor [Source:Uniprot/SWISSPROTAcc:P24821] signal transduction/receptor binding 0,19 3,87 20,56
No match -/- 0,14 2,77 20,33
Prolargin precursor [Source:Uniprot/SWISSPROTAcc:P51888] -/- 0,16 3,06 18,89 Eukaryotic translation initiation factor 4E-1A-binding protein
[Source:Uniprot/SWISSPROTAcc:Q98TT6]
negative regulation of translational initiation/eukaryotic initiation factor 4E binding
0,24 2,84 12,02
No match -/- 0,40 4,76 11,87
No match -/- 0,18 2,01 11,27
WNT1-inducible-signaling pathway protein 1 precursor [Source: Uniprot/SWISSPROTAcc:O95388]
regulation of cell growth/insulin-like growth factor binding 0,26 2,78 10,77
No match -/ 0,29 3,00 10,34
Genes were selected according to their patterns of expression (1st
group: FCM> 1.5 and FCMV< 0.67; 2ndgroup: FCM< 0.67 and FCMV> 1.5) and highest scores
(1st
group: FCM/FCMV> 10; 2ndgroup: FCMV/FCM> 10). GO classification was subdivided in biological processes (BP) and molecular function (MF). Two-class SAM
Table 3 Gene description (according to SAPD database [28]), GO classification and FC common genes regulated during
mineralization of VSa13 cells (FC
M)
versus mineralization + vanadate (FC
MV)
versus proliferation + vanadate
Gene description GOBP/MF FCM FCMV FCPV
Ependymin related protein-1 precursor [Source:IPIAcc:IPI00554718] cell-matrix adhesion/Ca ion binding 15.21 0.14 0.59
No match -/- 5.77 0.21 0.28
Xaa-Pro aminopeptidase 2 precursor [Source:Uniprot/ SWISSPROTAcc:O43895]
creatine metabolic process, proteolysis/metalloexopeptidase activity, hydrolase activity, creatinase activity
27.2 0.25 0.35
No match -/- 2.13 0.30 0.24
No match -/- 3.37 0.34 0.54
Beta-2-glycoprotein 1 precursor [Source:Uniprot/SWISSPROTAcc: P02749]
-/- 4.44 0.44 0.25
Translation initiation factor eIF-2B subunit [Source:Uniprot/ SWISSPROTAcc:Q9UI10]
-/- 1.96 0.49 0.58
Rap1b. [Source:Uniprot/SPTREMBLAcc:Q9YH37] small GTPase mediated signal transduction/GTP binding 2.08 0.51 0.51 Ribonucleoside-diphosphate reductase large subunit [Source:
Uniprot/SWISSPROTAcc:P23921]
DNA replication/ribonucleoside-diphosphate reductase activity, protein binding
2.19 0.51 0.66 C9orf119 [Source:Uniprot/SPTREMBLAcc:Q8N2W6] -/- 2.65 0.53 0.59
No match -/- 4.00 0.53 0.43
Protein arginine N-methyltransferase 1 [Source:Uniprot/ SWISSPROTAcc:Q99873]
-/- 3.90 0.54 0.62
ADP-ribosylation factor 5 [Source:RefSeq_peptideAcc:NP_001653] small GTPase mediated signal transduction/GTP binding 3.35 0.55 0.61 Argininosuccinate synthase [Source:Uniprot/SWISSPROTAcc:
P00966]
arginine biosynthetic process/argininosuccinate synthase activity, ATP binding
3.76 0.55 0.60 Serine/threonine-protein kinase 19. [Source:Uniprot/
SWISSPROTAcc:P49842]
-/- 2.25 0.57 0.54
No match -/- 3.82 0.59 0.53
Phosphate-regulating neutral endopeptidase [Source:Uniprot/ SWISSPROTAcc:P78562]
proteolysis/neprilysin activity; metallopeptidase activity, hydrolase activity, Zn ion binding
5.42 0.61 0.39
No match -/- 2.33 0.61 0.44
Kinetochore-associated protein [Source:Uniprot/SWISSPROTAcc: Q96IY1]
-/ 3.20 0.63 0.56
glyoxalase domain containing 5 [Source:RefSeq_peptideAcc: NP_001073958]
-/- 3.81 0.64 0.58
BolA-like protein 2. [Source:Uniprot/SWISSPROTAcc:Q9H3K6] -/- 1.53 0.66 0.59 Cyclin-dependent kinases regulatory subunit 1 [Source:IPIAcc:
IPI00015104]
cell cycle/cyclin-dependent protein kinase regulator activity, kinase activity
3.45 0.66 0.52 Signal peptide, CUB and EGF-like domain-containing protein 2
precursor [Source:Uniprot/SWISSPROTAcc:Q9NQ36]
-/Ca ion binding 0.09 7.02 5.19
No match -/- 0.05 5.03 2.48
Inter-alpha globulIn InhIbItor H3 [Source:IPIAcc:IPI00028413] hyaluronan metabolic process/serine-type endopeptidase inhibitor activity
0.18 4.38 2.71 Tenascin precursor [Source:Uniprot/SWISSPROTAcc:P24821] signal transduction/receptor binding 0.19 3.87 1.55 Prolargin precursor [Source:Uniprot/SWISSPROTAcc:P51888] -/- 0.16 3.06 2.05
No match -/- 0.29 3.00 1.82
No match -/- 0.54 2.76 2.82
No match -/- 0.29 2.69 2.87
No match -/- 0.29 2.62 1.75
Thrombospondin 1 precursor [Source:RefSeq_peptideAcc: NP_003237]
cell adhesion/structural molecule activity, Ca ion binding 0.29 2.53 2.28
No match -/- 0.34 2.14 1.74
No match -/- 0.51 1.81 2.02
Genes were selected according to their patterns of expression (1st
group: FCM> 1.5, FCMV< 0.67 and FCPV< 0.67; 2ndgroup: FCM< 0.67, FCMV> 1.5 and FCPV>
1.5). GO classification was subdivided in biological processes (BP) and molecular function (MF). Two-class SAM test were performed with FDR and FC limits lower than 5% and higher than 1.5.
Figure 6 Real-time PCR analysis of genes detected in VSa13 (A) and VSa16 (B) cells selected for validation. Genes were selected according to the following criteria: 2 genes with 1.5-2 FC, 2 genes with 2-10 FC, and 2 genes with FC higher than 10. All changes in gene expression evaluated by qPCR were significant according to Student’s test (p < 0.05) unless otherwise stated (non-significant - #). Genes selected for analysis were: i) secreted phosphoprotein 1 (SPP1; osteopontin), photoreceptor outer segment all-trans retinol dehydrogenase (short-chain dehydrogenase reductase; SDR), BMP-2, tissue non-specific alkaline phosphatase (TNAP), cell division protein kinase 10 (CDPK-10), S100 (calcium-binding), periostin precursor (PER), retinoic acid receptorb (RAR-b), suppressor of cytokine signaling 3 (SOCS-3), MGP, plasma retinol-binding protein precursor (PRBP) and betaine homocysteine methyltransferase (BHMT) in VSa13 cells; ii) SPP1, SDR, Ras GTPase-activating-like protein (RGAP), TNAP, stathmin 1/oncoprotein 18 (STMN-1), S100, SOCS-3, Ras-related protein 1A (Rap-1A), PER, MGP, PRBP and BHMT in VSa16 cells.
bone-derived cell lines. Global analysis of gene
expres-sion of ATDC5 cells - mouse pre-chondrocytes
similar to VSa13 cells - and MC3T3-E1 cells - mouse
pre-osteoblasts similar to VSa16 cells - identified
mineralogenic genes associated with catalysis, signal
transduction, transport, transcription, structure and
motor activity [30] and metabolism, cell cycle,
signal-ing, extracellular matrix, immune response and
tran-scription [31-33], respectively. Similarity in patterns of
gene expression of mammalian and fish
pre-chondro-cyte and pre-osteoblast cell lines, suggested that
mechanisms of tissue mineralization might be
con-served among vertebrates but also among
mineralo-genic cell types.
Anti-mineralogenic activity of vanadate as a way to
identify key/novel genes involved in mineralization
Although most of the genes identified in the first step of
this analysis certainly play a role during in vitro
minera-lization, some of them must be more important than
others. These key genes were identified from the initial
bulk of genes by using the anti-mineralogenic activity of
vanadate [22,23,34]. Indeed, those genes which
expres-sion levels were oppositely regulated during in vitro
mineralization and upon treatment with vanadate were
considered as good candidates. Vanadate stimulates
pro-liferation of VSa13 cells and strongly inhibits its ECM
mineralization, and these processes seem to involve
MAPK and putative PI-3K\Ras\ERK pathways [22,23].
Genes differentially expressed under these conditions
could represent new candidate genes crucial for bone
formation. Moreover, vanadium compounds have long
been known for their insulin-like properties [35] and
role in bone formation [34,36] but to the best of our
knowledge, their effects on gene expression have never
been investigated, in particular in relation to bone.
DAVID functional annotation tool for KEGG pathways
identified genes in vanadate-treated VSa13 cells
asso-ciated with insulin signaling pathway:
3-phosphoinosi-tide-dependent protein kinase-1 in proliferating cells
and Ras homolog gene family (member Q) in
differen-tiating cells. The involvement of signaling pathways
related to insulin activity is consistent with
insulin-mimetic properties of vanadium compounds [35] and
recent studies showing that mechanisms of action of
vanadate and insulin are similar in fish VSa13 cells and
that both molecules exhibit an anti-mineralogenic
activ-ity [23]. Among the genes oppositely regulated during in
vitro
mineralization and upon treatment with vanadate
(see Table 3), two have been associated to extracellular
matrix and previously shown to play an important role
in ECM structure: tenascin (normally expressed in
mesenchymal stem cells and osteoblasts) and
thrombos-pondin (normally expressed in mesenchymal stem cells
and chondrocytes). Both have been associated to
frac-ture healing, spinal curvafrac-ture and craniofacial defects in
knock-out mice [37]. Rap1b, intermediate of MAPK
(among other pathways), ADP-ribosylation factor 5,
GTP-binding and effector of phospholipase D signaling,
and cyclin-dependent kinases regulatory subunit 1, a Ras
effector protein, were also among the genes listed in
Table 3. Identification of MAPK and Ras intermediate
genes further demonstrates the strong involvement of
MAPK pathway in the ECM mineralization of
bone-derived cells, as recently demonstrated in VSa13 [23]
and ATDC5 [38] pre-chondrocyte cells. A signal peptide
CUB and EGF-like protein
(SCUBE-like) gene was of
particular interest since SCUBE family members have
been associated with HH signaling [39], a key pathway
Figure 7 Real-time PCR analysis of genes detected invanadate-treated VSa13 cells during mineralization (Mvs MV) and proliferation (Pvs PV) selected for validation. Genes were selected according to the following criteria: 3 up-regulated genes with 1.5-8 FC and 3 down-regulated genes with 1.5-8 FC. All changes in gene expression evaluated by qPCR were significant according to Student’s test (p < 0.05). Pearson correlation coefficients, calculated comparing probes 1 and 2 from oligo-array, and comparing probes 1 and 2 from oligo-array with qPCR, are indicated by r. Genes selected for analysis were: ependymin-related protein (ERP), arginine N-methyltransferase (RNM), cyclin-dependent kinase (CDK), signal peptide CUB and EGF-like protein (SCUBE-like), tenascin (TNS) and thrombospondin (TBSD).
in bone formation [1], and were recently shown to
mod-ulate/antagonize bone morphogenetic protein activity in
transgenic mouse and zebrafish [40,41]. Our data
showed an opposite regulation of SCUBE-like and
BMP-2
(associated with bone formation [21,42]) gene
expres-sion in mineralizing and vanadate-treated cells,
suggest-ing that SCUBE-like protein may play a key role in
anti-mineralogenic activity of vanadate through its action on
BMP-2 gene and/or protein. Further studies should
however be carried out in order to confirm this
hypoth-esis. Notably, numerous genes detected in this study
were classified as unknown. Absence of orthologs in
other vertebrate species, high divergence of fish genes
and/or low level of annotation in fish sequence
data-bases are likely to contribute to explain this situation. In
addition, the fact that numerous genes identified
throughout this work have not been previously linked to
bone formation, suggests that genetic mechanisms
involved in ECM mineralization and bone formation,
whether in mammalian or fish species, are still poorly
understood.
Conclusions
Global gene expression has been analyzed during ECM
mineralization of gilthead seabream vertebra-derived cell
lines using a recently developed oligo-array. A
consider-ably high number of differentially expressed genes was
detected, and occurrence of GO categories was found to
be similar in both cell lines, with approximately half of
the genes common to both cell lines. When comparing
occurrence of GO categories in VSa13 and VSa16 with
those found in mammalian systems, the similarities
found suggested conservation in
mineralization-asso-ciated processes across vertebrates. Interestingly,
enrich-ment for bone-related genes was observed in VSa16, but
not in VSa13, thus reinforcing the previously described
association of this cell line to osteoblast lineage.
Furthermore, analysis of genes differentially expressed
upon exposure to vanadate, a known anti-mineralogenic
molecule, has permitted the identification of key/novel
mineralogenic genes, which could be classified as: i)
annotated genes with known roles in bone formation (e.
g. tenascin and thrombospondin), ii) annotated genes
with unknown roles in bone formation (e.g. SCUBE-2)
and iii) unknown transcripts. Although further analyses
are required for genes included in the last two
cate-gories, the large number of transcripts detected in this
study should bring new insights into the process of
mineralization.
Methods
Cell culture and ECM mineralization
VSa13 and VSa16 cells were cultured in Dulbecco
’s
modified Eagle medium (DMEM) supplemented with
10% fetal bovine serum, 2 mM L-glutamine, antibiotics
and antimycotics (all from Invitrogen), as described
pre-viously [19]. ECM mineralization was induced in
conflu-ent cultures by supplemconflu-enting medium with 50
μg/ml
of L-ascorbic acid, 10 mM of
b-glycerophosphate and 4
mM of calcium chloride (all from Sigma-Aldrich).
Cul-ture medium was renewed every 3.5 days. At
appropri-ate times, mineral deposition was evaluappropri-ated through von
Kossa
’s staining and densitometry analysis [43].
Preparation of vanadate solution
Vanadate stock solution (5 mM, pH 6.7) was prepared
from ammonium metavanadate (Sigma-Aldrich) and
stored at 4°C.
RNA extraction and purification
Total RNA was extracted from cell cultures as described
by Chomczynski and Sacchi [44]. RNA samples were
purified using QIAGEN RNeasy Mini kit then treated
with QIAGEN RNase-free DNase according to
manufac-turer
’s instructions. RNA concentration was determined
by spectrophotometry (NanoDrop ND-1000, Thermo
Scientific) and RNA integrity evaluated by
electrophor-esis (2100 Bioanalyzer, Agilent Technologies). RNA
integrity number (RIN) index was calculated for each
sample using Agilent 2100 Expert software. Only RNA
samples with a RIN >8 were further processed.
RNA amplification, labeling and array hybridization
Total RNA (500 ng) was supplemented with a mixture
of 10 different viral polyadenylated RNAs (Agilent
Spike-In mix) then linearly amplified and labeled with
Cy3-dCTP using Agilent One-Color Microarray-Based
Gene Expression Analysis protocol. Labeled cRNA was
purified using QIAGEN RNeasy Mini kit, and sample
concentration and specific activity (pmol Cy3/
μg cRNA)
were measured by spectrophotometry. Labeled cRNA
(1650 ng) was fragmented by adding 11
μl of 10X
block-ing agent and 2.2
μl of 25X fragmentation buffer,
heat-ing at 60°C for 30 min, and finally addheat-ing 55
μl of 2X
GE hybridization buffer. Hybridization solution (100
μl)
was placed in the gasket slide and assembled to the
microarray slide (each slide containing four arrays).
Slides were incubated for 17 h at 65°C in an Agilent
hybridization oven, then dissociated from the
hybridiza-tion chamber and quickly submerged in GE wash buffer
#1 for 1 min. An additional wash was performed in
pre-warmed (37°C) GE wash buffer #2 for another 1 min.
Slides were scanned using Agilent G2565BA DNA
microarray scanner. Scan resolution was set to 5
μm
and two different sensitivity levels (XDR Hi 100% and
XDR Lo 10%) were used. Both images were analyzed
simultaneously using the standard procedures described
in Agilent Feature Extraction software 9.5.1.
Data normalization and statistical analysis
Spots with unsuitable integrity and intensity were
fil-tered out using Feature Extraction Software 9.5.1 flag
“glsFound”. Flag value is set to 1 if the spot has an
intensity value significantly different from the local
background, 0 otherwise. Spike-in control intensities
(Spike-In Viral RNAs) were used to identify the best
normalization procedure for each dataset. After
normali-zation, spike intensities are expected to be uniform
across the experiments of a given dataset. Quantile or
cyclic Lowess normalization was performed using R
sta-tistical software (available at http://www.r-project.org)
then SAM statistical test [45] was used to identify
differ-entially expressed genes between groups.
Analysis of gene expression by quantitative real-time PCR
QPCR was performed using iCycler iQ system
(Bio-Rad). Total RNA (1
μg) was treated with RQ1
RNase-free DNase (Promega) then reverse-transcribed at 37°C
according to manufacturer
’s instruction using Moloney
murine leukemia virus reverse transcriptase and
univer-sal oligo-dT adapter (5
’-ACGCGTCGACCTCGAGATC-GATG(T)13-3’). PCR amplification of cDNA fragments
was performed using the iQ SYBR Green I mix, specific
primers and 10 ng of reverse-transcribed RNA. The
fol-lowing PCR conditions were used: an initial
denatura-tion step at 95°C for 4 min then 40-50 cycles of
amplification (each cycle is 30 s at 95°C, 30 s at 68°C).
Fluorescence was measured at the end of each extension
cycle in the FAM-490 channel. Levels of gene expression
were calculated using the
ΔΔCt method and normalized
using expression levels of ribosomal protein L27a
(RPL27a) housekeeping gene.
Additional material
Additional file 1: Biological processes GO entries occurrence among common differentially expressed genes in controlversus
mineralized VSa13 and VSa16 cells. Raw data was normalized using quantile method. A two class SAM test was performed; FDR and FC parameters were lower than 5 and higher than 1.5, respectively. Additional file 2: Molecular function GO entries occurrence among common differentially expressed genes in controlversus
mineralized VSa13 and VSa16 cells. Raw data was normalized using quantile method. A two class SAM test was performed; FDR and FC parameters were lower than 5 and higher than 1.5, respectively. Additional file 3: Cellular component GO entries occurrence among common differentially expressed genes in controlversus
mineralized VSa13 and VSa16 cells. Raw data was normalized using quantile method. A two class SAM test was performed; FDR and FC parameters were lower than 5 and higher than 1.5, respectively. Additional file 4: Gene description (according to SAPD database [28]), GO classification and FC of up-regulated genes in VSa13 cells with FC higher than 10 in controlversus mineralization. GO classification was subdivided in biological processes (BP), molecular function (MF) and cellular component (CC). Raw data was normalized using quantile method and then a two class SAM test was performed; FDR was limited to 5%.
Additional file 5: Gene description (according to SAPD database [28]), GO classification and FC of up-regulated genes in VSa16 cells with FC higher than 10 in controlversus mineralization. GO classification was subdivided in biological processes (BP), molecular function (MF) and cellular component (CC). Raw data was normalized using quantile method and then a two class SAM test was performed; FDR was limited to 5%.
Additional file 6: Gene description (according to SAPD database [28]), GO classification and FC of down-regulated genes in VSa13 cells with FC higher than 10 in controlversus mineralization. GO classification was subdivided in biological processes (BP), molecular function (MF) and cellular component (CC). Raw data was normalized using quantile method and then a two class SAM test was performed; FDR was limited to 5%.
Additional file 7: Gene description (according to SAPD database [28]), GO classification and FC of down-regulated genes in VSa16 cells with FC higher than 10 in controlversus mineralization. GO classification was subdivided in biological processes (BP), molecular function (MF) and cellular component (CC). Raw data was normalized using quantile method and then a two class SAM test was performed; FDR was limited to 5%.
List of abbreviations
BMP-2: bone morphogenetic protein 2; DAVID: database for annotation, visualization and integrated discovery; ECM: extracellular matrix; EST: expressed sequence tag; FC: fold change; FDR: false discovery rate; GO: gene ontology; MGP: matrix gla protein; OC: osteocalcin; qPCR: quantitative real-time PCR; SAM: significance analysis of microarray; SCUBE-like: signal peptide, CUB and EGF-like protein; SPP1: secreted phosphoprotein 1; osteopontin Acknowledgements
This work was partially funded by FP6 EU grant n° 505403 (Marine Genomics Europe NoE). DMT was supported by a postdoctoral fellowship (SFRH/BPD/ 45034/2008) from the Portuguese Foundation for Science and Technology (FCT). Author details
1
Centre of Marine Sciences (CCMAR), University of Algarve, Faro, Portugal.
2Department of Public Health, Comparative Pathology and Veterinary
Hygiene, University of Padova, Legnaro, Italy.3CRIBI, University of Padova, Complesso Biologico Vallisneri, Via Ugo Bassi 58/B, Padova, Italy.
4
Department of Biomedical Sciences and Medicine, University of Algarve, Faro, Portugal.
Authors’ contributions
DMT performed the cell culture experiments, carried out RNA sample preparation and qPCR experiments, participated in oligo-array hybridization, data extraction and data interpretation, and drafted the manuscript. VL participated in the study design and coordination, and helped to draft the manuscript. LB participated in data interpretation and coordination of the study. SF carried out oligo-array hybridization and data extraction, and participated in data interpretation. CR performed the statistical analysis. MLC conceived the study, participated in its design and coordination and contributed to the final draft of the manuscript.
All authors read and approved the final version of the manuscript. Received: 29 November 2010 Accepted: 13 June 2011 Published: 13 June 2011
References
1. Karsenty G, Wagner EF: Reaching a genetic and molecular understanding of skeletal development. Dev Cell 2002, 2(4):389-406.
2. Blair HC, Zaidi M, Schlesinger PH: Mechanisms balancing skeletal matrix synthesis and degradation. Biochem J 2002, 364(Pt 2):329-341.
3. McGonnell IM, Fowkes RC: Fishing for gene function-endocrine modelling in the zebrafish. J Endocrinol 2006, 189(3):425-439.
4. Fisher S, Jagadeeswaran P, Halpern ME: Radiographic analysis of zebrafish skeletal defects. Dev Biol 2003, 264(1):64-76.
5. Belloni E, Muenke M, Roessler E, Traverso G, Siegel-Bartelt J, Frumkin A, Mitchell HF, Donis-Keller H, Helms C, Hing AV, Heng HH, Koop B, Martindale D, Rommens JM, Tsui LC, Scherer SW: Identification of Sonic hedgehog as a candidate gene responsible for holoprosencephaly. Nat Genet 1996, 14(3):353-356.
6. Nissen RM, Amsterdam A, Hopkins N: A zebrafish screen for craniofacial mutants identifies wdr68 as a highly conserved gene required for endothelin-1 expression. BMC Dev Biol 2006, 6:28.
7. Gorman KF, Breden F: Teleosts as models for human vertebral stability and deformity. Comp Biochem Physiol C Toxicol Pharmacol 2007, 145(1):28-38.
8. Canario AVM, Bargelloni L, Volckaert F, Houston RD, Massault C, Guiguen Y: Genomics Toolbox for Farmed Fish. Rev Fish Sci 2008, 16:3-15.
9. Adzhubei AA, Vlasova AV, Hagen-Larsen H, Ruden TA, Laerdahl JK, Hoyheim B: Annotated expressed sequence tags (ESTs) from pre-smolt Atlantic salmon (Salmo salar) in a searchable data resource. BMC Genomics 2007, 8:209.
10. Govoroun M, Le Gac F, Guiguen Y: Generation of a large scale repertoire of Expressed Sequence Tags (ESTs) from normalised rainbow trout cDNA libraries. BMC Genomics 2006, 7:196.
11. Douglas SE, Knickle LC, Kimball J, Reith ME: Comprehensive EST analysis of Atlantic halibut (Hippoglossus hippoglossus), a commercially relevant aquaculture species. BMC Genomics 2007, 8:144.
12. Li P, Peatman E, Wang S, Feng J, He C, Baoprasertkul P, Xu P, Kucuktas H, Nandi S, Somridhivej B, Serapion J, Simmons M, Turan C, Liu L, Muir W, Dunham R, Brady Y, Grizzle J, Liu Z: Towards the ictalurid catfish transcriptome: generation and analysis of 31,215 catfish ESTs. BMC Genomics 2007, 8:177.
13. Li RW, Waldbieser GC: Production and utilization of a high-density oligonucleotide microarray in channel catfish, Ictalurus punctatus. BMC Genomics 2006, 7:134.
14. Douglas SE, Knickle LC, Williams J, Flight RM, Reith ME: A first generation Atlantic halibut Hippoglossus hippoglossus (L.) microarray: application to developmental studies. J Fish Biol 2008, 72:2391-2406.
15. Garcia-Reyero N, Griffitt RJ, Liu L, Kroll KJ, Farmerie WG, Barber DS, Denslow ND: Construction of a robust microarray from a non-model species largemouth bass, Micropterus salmoides (Lacepede), using pyrosequencing technology. J Fish Biol 2008, 72(9):2354-2376. 16. Salem M, Kenney PB, Rexroad CE, Yao J: Development of a 37 k
high-density oligonucleotide microarray: a new tool for functional genome research in rainbow trout. J Fish Biol 2008, 72(9):2187-2206.
17. Ferraresso S, Vitulo N, Mininni AN, Romualdi C, Cardazzo B, Negrisolo E, Reinhardt R, Canario AV, Patarnello T, Bargelloni L: Development and validation of a gene expression oligo microarray for the gilthead sea bream (Sparus aurata). BMC Genomics 2008, 9(1):580.
18. Rafael MS, Marques CL, Parameswaran V, Cancela ML, Laizé V: Fish bone-derived cell lines: an alternative in vitro cell system to study bone biology. J Appl Ichthyol 2010, 26(2):230-234.
19. Pombinho AR, Laizé V, Molha DM, Marques SM, Cancela ML: Development of two bone-derived cell lines from the marine teleost Sparus aurata; evidence for extracellular matrix mineralization and cell-type-specific expression of matrix Gla protein and osteocalcin. Cell Tissue Res 2004, 315(3):393-406.
20. Fonseca VG, Laizé V, Valente MS, Cancela ML: Identification of an osteopontin-like protein in fish associated with mineral formation. FEBS J 2007, 274(17):4428-4439.
21. Rafael MS, Laizé V, Cancela ML: Identification of Sparus aurata bone morphogenetic protein 2: molecular cloning, gene expression and in silico analysis of protein conserved features in vertebrates. Bone 2006, 39(6):1373-1381.
22. Laizé V, Tiago DM, Aureliano M, Cancela ML: New insights into
mineralogenic effects of vanadate. Cell Mol Life Sci 2009, 66(24):3831-3836. 23. Tiago DM, Cancela ML, Aureliano M, Laizé V: Vanadate proliferative and
anti-mineralogenic effects are mediated by MAPK and PI-3K/Ras/Erk pathways in a fish chondrocyte cell line. FEBS Lett 2008, 582(9):1381-1385. 24. AmiGO database. [http://amigo.geneontology.org/cgi-bin/amigo/go.cgi]. 25. Sparus aurata database. [http://enne.cribi.unipd.it:5555/biomart/martview]. 26. DAVID database. [http://david.abcc.ncifcrf.gov/].
27. Huang da W, Sherman BT, Lempicki RA: Systematic and integrative analysis of large gene lists using DAVID bioinformatics resources. Nat Protoc 2009, 4(1):44-57.
28. Tiago DM, Laizé V, Cancela ML, Aureliano M: Impairment of mineralization by metavanadate and decavanadate solutions in a fish bone-derived cell line. Cell Biol Toxicol 2008, 24(3):253-263.
29. Wang Y, Barbacioru C, Hyland F, Xiao W, Hunkapiller KL, Blake J, Chan F, Gonzalez C, Zhang L, Samaha RR: Large scale real-time PCR validation on gene expression measurements from two commercial
long-oligonucleotide microarrays. BMC Genomics 2006, 7:59.
30. James CG, Appleton CT, Ulici V, Underhill TM, Beier F: Microarray analyses of gene expression during chondrocyte differentiation identifies novel regulators of hypertrophy. Mol Biol Cell 2005, 16(11):5316-5333. 31. Billiard J, Moran RA, Whitley MZ, Chatterjee-Kishore M, Gillis K, Brown EL,
Komm BS, Bodine PV: Transcriptional profiling of human osteoblast differentiation. J Cell Biochem 2003, 89(2):389-400.
32. Doi M, Nagano A, Nakamura Y: Genome-wide screening by cDNA microarray of genes associated with matrix mineralization by human mesenchymal stem cells in vitro. Biochem Biophys Res Commun 2002, 290(1):381-390.
33. Raouf A, Seth A: Discovery of osteoblast-associated genes using cDNA microarrays. Bone 2002, 30(3):463-471.
34. Barrio DA, Etcheverry SB: Vanadium and bone development: putative signaling pathways. Can J Physiol Pharmacol 2006, 84(7):677-686. 35. Schechter Y: Insulin-like effects of vanadium: mechanisms of action,
clinical and basic implications. Lett Pept Sci 1998, 5:319-322. 36. Anke M: Vanadium - an element both essential and toxic to plants,
animals and humans? Anal Real Acad Nac Farm 2004, 70:961-999. 37. Alford AI, Hankenson KD: Matricellular proteins: Extracellular modulators
of bone development, remodeling, and regeneration. Bone 2006, 38(6):749-757.
38. Phornphutkul C, Wu KY, Yang X, Chen Q, Gruppuso PA: Insulin-like growth factor-I signaling is modified during chondrocyte differentiation. J Endocrinol 2004, 183(3):477-486.
39. Tsai MT, Cheng CJ, Lin YC, Chen CC, Wu AR, Wu MT, Hsu CC, Yang RB: Isolation and characterization of a secreted, cell-surface glycoprotein SCUBE2 from humans. Biochem J 2009, 422(1):119-128.
40. Kawakami A, Nojima Y, Toyoda A, Takahoko M, Satoh M, Tanaka H, Wada H, Masai I, Terasaki H, Sakaki Y, Takeda H, Okamoto H: The zebrafish-secreted matrix protein you/scube2 is implicated in long-range regulation of hedgehog signaling. Curr Biol 2005, 15(5):480-488.
41. Tu CF, Yan YT, Wu SY, Djoko B, Tsai MT, Cheng CJ, Yang RB: Domain and functional analysis of a novel platelet-endothelial cell surface protein, SCUBE1. J Biol Chem 2008, 283(18):12478-12488.
42. Yamaguchi A, Komori T, Suda T: Regulation of osteoblast differentiation mediated by bone morphogenetic proteins, hedgehogs, and Cbfa1. Endocr Rev 2000, 21(4):393-411.
43. Marques CL, Rafael MS, Cancela ML, Laizé V: Establishment of primary cell cultures from fish calcified tissues. Cytotechnology 2007, 55(1):9-13. 44. Chomczynski P, Sacchi N: Single-step method of RNA isolation by acid
guanidinium thiocyanate-phenol-chloroform extraction. Anal Biochem 1987, 162(1):156-159.
45. Tusher VG, Tibshirani R, Chu G: Significance analysis of microarrays applied to the ionizing radiation response. Proc Natl Acad Sci USA 2001, 98(9):5116-5121.
doi:10.1186/1471-2164-12-310
Cite this article as: Tiago et al.: Global analysis of gene expression in mineralizing fish vertebra-derived cell lines: new insights into anti-mineralogenic effect of vanadate. BMC Genomics 2011 12:310.

![Table 2 Gene description (according to SAPD database [28]), GO classification, FC and scores of common genes regulated during mineralization of VSa13 cells (FC M ) versus mineralization with vanadate (FC MV )](https://thumb-eu.123doks.com/thumbv2/123dok_br/18641473.911870/9.892.85.808.169.1040/description-according-database-classification-regulated-mineralization-mineralization-vanadate.webp)
![Table 2 Gene description (according to SAPD database [28]), GO classification, FC and scores of common genes regu- regu-lated during mineralization of VSa13 cells (FC M ) versus mineralization with vanadate (FC MV ) (Continued)](https://thumb-eu.123doks.com/thumbv2/123dok_br/18641473.911870/10.892.87.809.160.1002/description-according-database-classification-mineralization-mineralization-vanadate-continued.webp)
![Table 3 Gene description (according to SAPD database [28]), GO classification and FC common genes regulated during mineralization of VSa13 cells (FC M ) versus mineralization + vanadate (FC MV ) versus proliferation + vanadate](https://thumb-eu.123doks.com/thumbv2/123dok_br/18641473.911870/11.892.93.810.145.1057/description-according-database-classification-regulated-mineralization-mineralization-proliferation.webp)
