Universidade de Lisboa
Faculdade de Ciências
Departamento de Engenharia Geográfica Geofísica e Energia
Climatic changes in the Western Iberian Upwelling System
José Miguel Rodrigues Alves
Doutoramento em Ciências Geofísicas e da Geoinformação
(Meteorologia)
Tese Orientada por:
Prof. Doutor Pedro Miranda
Doutor Nuno Serra
3
Contents
Chapter 1 Motivation and objectives ... 11
1.1 Motivation ... 11
1.2 Objectives ... 13
1.3 Thesis layout ... 14
Chapter 2 Introduction ... 15
2.1 The Canary Current Upwelling System ... 15
2.2 Basic upwelling dynamics ... 17
2.3 Coastal upwelling indices ... 21
2.4 Inter-annual variability and trends of the upwelling regime ... 23
Chapter 3 Methodology ... 27
3.1 Advantages of using numerical models ... 27
3.2 Model description ... 28
3.2.1 The Regional Ocean Modeling System (ROMS) ... 28
3.2.2 The COAWST coupled ocean-atmosphere system ... 36
3.3 Model configuration ... 40
3.3.1 ROMS... 40
3.3.2 COAWST ... 41
Chapter 4 Numerical simulations of the Iberian coastal upwelling with ECMWF re-analysis data .. 43
4.1 Results and discussion ... 43
4.2 Conclusions ... 66
Chapter 5 Projection of future Iberian upwelling changes using RACMO forcing ... 69
5.1 RACMO data and setup of the simulations... 69
5.2 Results and discussion ... 72
5.3 Conclusions ... 83
Chapter 6 Improving the Iberian upwelling simulations with a coupled ocean-atmosphere model ... 85
4
6.2 Results and discussion ... 87
6.3 Conclusions ... 97
Chapter 7 Conclusions and final considerations ... 99
7.1 Conclusions ... 99
7.2 Model limitations ... 102
5
Acknowledgements
I thank my advisors Pedro Miranda and Nuno Serra for their guidance and support during my PhD. In particular, I thank Nuno Serra for welcoming me at the University of Hamburg during my one month visit.
I acknowledge the Instituto Dom Luiz (IDL - Centro de Geofísica), my host institution, for the given work conditions, in particular, the computational time that was essential to conduct this work. IDL is funded by the Portuguese Foundation for Science and Technology (FCT) under the project PEST-OE/CTE/LA0019/2011/2012.
I show gratitude to John Warner for having permitted me to visit the USGS in Woods Hole, Massachusetts, USA, which allowed me to gain experience with an atmosphere-ocean coupled modelling system and for having given me access to the USGS computer cluster, used to perform the coupled simulations.
The RACMO data used in Chapter five was provided through the PRUDENCE data archive funded by the European Union through contract EVK2-CT2001-00132.
This work was supported by FCT under grant SFRH/BD/32049/2006 and in the frame of project AMIC (grant PTDC/AAC-CLI/109030/2008).
I thank my colleagues (Emanuel, João Martins, Miguel Nogueira, Miguel Teixeira, Pedro Soares Ricardo, Sandra and Rita) in the laboratory for their friendship and support during the last years. I also thank Greg King for his comments on the final stage of the thesis.
I am grateful to my family, Father, Mother, Pedro, Ana and Leonor; without their constant encouragement it would not be possible to finish my PhD. Special thanks go to Sandra for her patient, motivation and love.
7
Abstract
This study is largely based on numerical simulations and focuses the Iberian coastal upwelling. The dissertation aims at improving the understanding on the behaviour of coastal upwelling in the context of climate change. The analysis relies on sets of numerical simulations conducted with a regional ocean numerical model and a coupled atmosphere-ocean coupled model system. Two separate questions are addressed: (1) which physical variables characterize best the Iberian upwelling? (2) what trends are to be expected in Iberian upwelling with global warming?
Two multi-decadal simulations were realized with an ocean numerical model forced with reanalysis atmospheric data from the European Centre for Medium-Range Weather Forecast (ECMWF). During the last two simulated decades, a decreasing number of coastal upwelling events in the northern part of the western Iberian coast and an increasing number of coastal upwelling events in the southern part of western Iberian coast were noted. These opposite trends in the mean number of coastal upwelling days are in good agreement with the trends of the meridional component of wind off western Iberia, computed with ERA-40, ERA-Interim and satellite scatterometer data, all indicating a weakening of meridional wind intensity in the north and an intensification of the meridional wind intensity in the south.
To assess the impact of climate change in the frequency and intensity of coastal upwelling events off western Iberia, a control simulation corresponding to the 1961-1990 climate and a scenario simulation for the period 2071-2100 were conducted, using seven forcing atmospheric variables (surface wind, shortwave net radiation, surface air temperature, surface pressure, relative humidity, cloud cover and precipitation rate) retrieved from the RACMO (Regional Atmospheric Climate Model) simulations. When analysing the forcing variable with more impact on the upwelling, the surface wind, an increase in both the westerly and northerly components of the mean surface wind over the last 30 years of the XXI century is simulated by RACMO, resulting in an increase of the intensity of coastal upwelling during the scenario period.
A coupled model system, comprised of an ocean, an atmosphere and a wave model, was used to show the large impact of ocean surface waves on the sea surface and atmospheric surface temperature fields during the summer season, most probably related with the large ocean vertical temperature gradient during this season.
Keywords: Climate change, coastal upwelling, sea surface temperature, surface wind, numerical modelling
8
Resumo
Esta tese de doutoramento baseia-se no estudo do afloramento costeiro, um fenómeno que se caracteriza pela emersão à superfície de água profunda que normalmente apresenta temperaturas relativamente baixas e elevados valores de concentração de nutrientes. Este fenómeno ocorre nalgumas regiões costeiras dos oceanos, devido ao efeito combinado da rotação da terra e do vento sobre as águas à superfície do oceano. Devido ao transporte para o largo das correntes à superfície que este efeito implica, o transporte para o largo por continuidade tem de ser compensado com água mais profunda que emerge à superfície. As regiões onde se observa o afloramento costeiro nos oceanos englobam menos de 1% da área total dos oceanos, mas, devido ao elevado teor de nutrientes das águas superficiais, é estimado que 20% das pescas globais se verifiquem nestas regiões.
Em termos físicos, o facto de se verificar um súbito arrefecimento da temperatura da superfície do mar quando se verifica um episódio de afloramento costeiro também implica um clima mais fresco nas regiões costeiras adjacentes sobre o continente, nomeadamente através de um regime de brisa costeira. A costa ocidental da Península Ibérica constitui o limite Norte de um dos maiores ecossistemas de afloramento costeiro do Oceano Mundial, que se estende desde a costa do Senegal a sul, até ao extremo norte da costa ocidental da Península Ibérica. Os limites sul e norte deste ecossistema variam sazonalmente de acordo com o regime de ventos regional, sendo que ao largo da costa ocidental da Península Ibérica este fenómeno é normalmente observado durante o Verão, devido aos ventos de norte causados pelo anticiclone dos Açores a pela depressão térmica no centro da Península Ibérica que se forma normalmente durante os meses de Verão.
Esta tese teve como um dos principais objectivos contribuir com os resultados apresentados para identificar tendências recentes do afloramento costeiro ao longo da costa ocidental da Península Ibérica, utilizando para este fim modelos numéricos de circulação atmosférica e oceânica. Nesta tese foram realizadas simulações com um modelo numérico de circulação oceânica e um sistema composto por três modelos acoplados, um oceânico, um atmosférico e outro de agitação marítima.
Com o modelo numérico oceânico foram realizadas duas simulações forçadas por dados de duas reanálises atmosféricas do Centro Europeu (ECMWF), uma para o período 1961 a 2001 (ERA-40) e outra para o período 1989 a 2008 (ERA-Interim). Nestas simulações verificou-se uma tendência de decréscimo do número de dias de afloramento costeiro a norte e uma tendência para o aumento do número de dias de afloramento costeiro na parte sul da costa ocidental da Península Ibérica. Estas tendências estão de acordo com a tendência observada na variável atmosférica com maior influência no afloramento costeiro, o vento à superfície. Com efeito, na componente meridional do vento ao longo da costa ocidental da Península Ibérica observou-se um enfraquecimento na parte Norte e uma
9 intensificação na parte sul. Em relação à elevação da superfície do mar junto à costa, verificou-se um aumento do nível médio do mar, embora este aumento tenha vindo a diminuir de intensidade nas últimas décadas analisadas, possivelmente devido ao aumento do número de eventos de afloramento costeiro, que implicam um decréscimo do nível médio do mar junto à costa e um aumento ao largo devido à convergência verificado nas camadas superficiais do oceano durante um evento de afloramento costeiro.
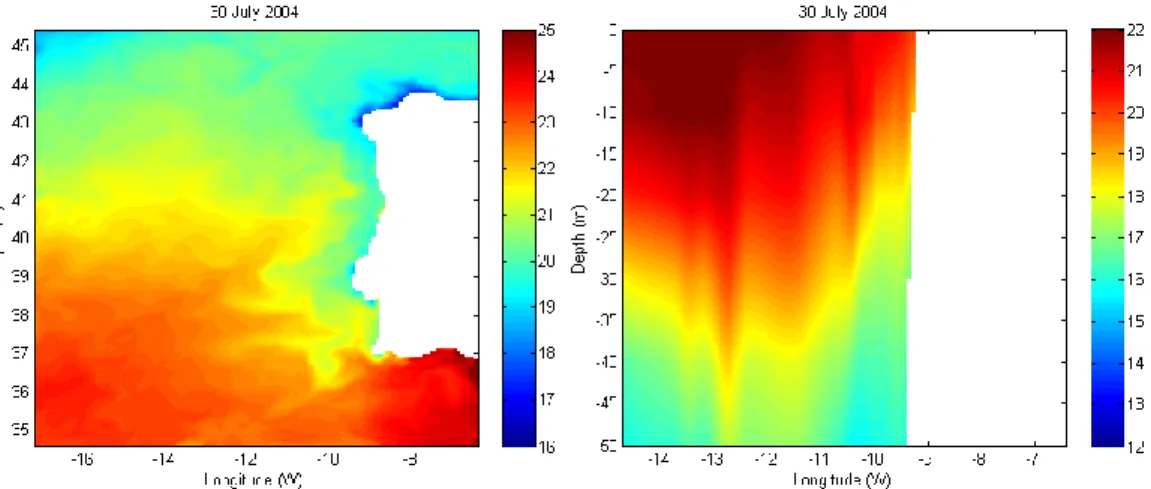
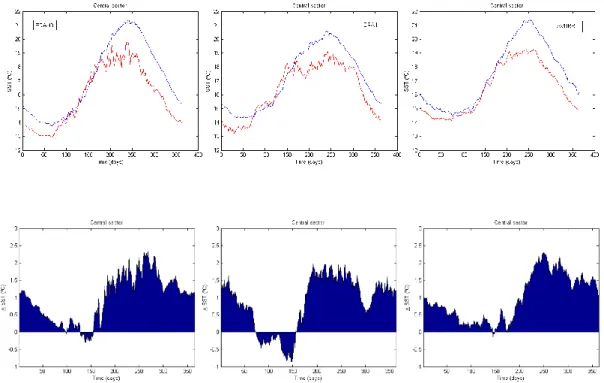
O campo da temperatura da superfície do mar simulado pelo modelo de circulação oceânica foi validado com dados de satélite, tendo-se verificado diferenças pequenas entre a temperatura simulada pelo modelo e a obtida a partir de dados de satélite. Da comparação dos anos comuns às simulações realizadas com os dados ERA-40 e ERA-Interim, verificou-se que esta última apresenta resultados mais próximos aos observados por satélite. Observou-se que a variabilidade da temperatura da superfície do mar é superior junto à costa que ao largo, devido ao arrefecimento causado pelo afloramento costeiro junto à costa durante o Verão.
De modo a identificar o impacto das alterações climáticas no afloramento costeiro, foram realizadas duas simulações com o modelo numérico oceânico forçado com dados atmosféricos de um modelo regional de Clima o qual teve em conta a concentração de gases com efeito de estufa previstas no cenário A2 do IPCC (International Panel for Climate Change). É importante referir que, até ao presente, o efeito do afloramento costeiro não se encontra correctamente representado nas simulações apresentadas pelo IPCC, devido à baixa resolução utilizada nas simulações globais. Uma intensificação do afloramento costeiro numa região pode implicar um clima menos quente ou mesmo mais frio, pelo que determinar a tendência do afloramento costeiro num cenário futuro pode ter implicações extremamente importantes nas regiões costeiras afectadas por este fenómeno.
Com o modelo numérico de circulação oceânica foi realizada uma simulação para o período de controlo (1961-1990) e uma outra simulação para o período de cenário (2071-2100). Da comparação dos resultados obtidos nestas duas simulações observou-se um aumento em cerca de 10% do número de dias de afloramento costeiro por ano no período de cenário, que provavelmente se deve a uma intensificação também de cerca de 10% do vento ao longo da costa ocidental da Península Ibérica. Interessa notar que o aumento do número de dias de afloramento costeiro é quase na totalidade verificado nos eventos mais intensos. Nos eventos de menor intensidade verifica-se um valor constante ou mesmo uma ligeira diminuição durante o período de cenário. Verificou-se também no período de cenário um ligeiro aumento das correntes à superfície do oceano. Em relação ao nível médio do mar verificou-se um decréscimo no período de cenário quando comparado com o período de controlo, devido ao efeito do aumento do número de dias de afloramento costeiro, que se sobrepõem ao efeito do aquecimento global, o qual implica um aumento do nível médio do mar devido à dilatação térmica
10 nas camadas superficiais do oceano. No período de cenário, embora a maioria dos eventos se continuem a verificar no verão, é notado um aumento do número de eventos nas outras estações do ano, particularmente durante o Inverno, estação em que no período de controlo quase não se verificaram eventos de afloramento costeiro. Associado ao aumento do número médio de dias de afloramento costeiro por ano no período de cenário, observou-se um aumento da variabilidade intra-anual da temperatura da superfície do mar.
Na parte final da tese são apresentados resultados obtidos com um sistema acoplado composto por três modelos, um modelo oceânico, outro de agitação marítima e outro atmosférico. Este sistema permitiu simular os fluxos de calor na interface atmosfera-oceano em tempo real e similar o impacto da inclusão de um modelo de agitação marítima no campo da temperatura à superfície do mar. Conclui-se que durante o verão o impacto da inclusão do modelo de agitação marítima é muito mais significativo do que durante o resto do ano, embora seja durante o verão que se observe um valor da altura significativa da agitação marítima com valores mais baixos. Esta situação é justificada pelo facto de no verão se verificar um maior gradiente vertical da temperatura junto à superfície do oceano. Em relação aos fluxos de calor latente e sensível, foi notado que estas duas variáveis são dois bons indicadores do afloramento costeiro, uma vez que são fortemente influenciadas pela variação da temperatura à superfície do oceano.
Palavras chave: alterações climáticas, afloramento costeiro, temperatura da superfície do mar, vento à superfície do mar, modelos numéricos
11
Motivation and objectives
Chapter 1
Motivation
1.1
Portugal, with a coast extension of about 1187 km and with more than 1.7 million km2 of coastal waters representing approximately 18 times its terrestrial area, has one of the largest exclusive economic zones in Europe. But presently, it is also a country where the ocean related activities are far from being fully explored, in many cases, due to an absence of accurate scientific knowledge of atmospheric and oceanic coastal related phenomena.
Recently, some studies on the impact of sea-related activities in European national economies indicated their increasing importance in the upcoming decades. In Portugal, the Maritime Cluster, an association created to promote and stimulate sea-related activities, projected that the percentage of the national Gross Domestic Product (GDP) related with maritime activities can increase from the actual (2009) 2 % to between 4 % and 5 % in 2025. If indirect activities were taken into account than it is estimated that, by 2025, 10 % to 12 % of the national GDP may be associated with sea-related activities.
One of these sea-related activities is the fishing industry, where an accurate forecast of the coastal upwelling regime off the western Iberian coast will certainly improve the fish catchments records in the region. Other areas that can benefit from an accurate description of the ocean and atmospheric coastal conditions are the off-shore wind and ocean wave renewable energy fields, where several on-going research projects predict future significant contributions to the fraction of energy from renewable sources in Portugal. The maritime transport, in particular the harbour‘s activity, and the sea related tourism activities are other areas that can profit from an accurate high temporal and spatial resolution forecast of the atmospheric and oceanic coastal conditions.
The elaboration of climate scenarios for coastal regions is of great importance, as it is in these regions that approximately half of the European population lives, according to data from the European Commission. In Portugal, this percentage is even greater, as it is estimated that more than 75 % of the Portuguese population lives in coastal regions. The correct elaboration of decadal scenarios for these areas can have influence on the decision makers, in future investments and measures of mitigation in coastal zones.
The IPCC (Intergovernmental Panel on Climate Change) created different climate scenarios for the XXI century taken into account different levels of technological development and international cooperation between governments and international institutions. Figure 1 shows the projected evolution of the four main greenhouse gases in the different IPCC scenarios for the XXI century. The
12 greenhouse gases concentration trends depend significantly on the considered IPCC scenario. Each scenario accounts for a different social, economic and technical development, which represents different policies taken by the national governments and international institutions and that lead to different levels of technological development during the XXI century.
Figure 1 Projected evolution of four greenhouse gases (CO2 ; N2O ; CH4 and SO2) for the XXI century
in the different IPCC scenarios. In the legend the letter B refers to a balanced energetic use across all energy sources, T to the use of non-fossil energy sources and FI to the use of fossil intensive energy sources. These three sub-scenarios of the A1 scenario are related with the future technological development during the XXI century. IS92a is the prediction from an earlier SAR (IPCC Second Assessment Report).
In the A1 and A2 scenarios more attention is given to economic policies, whereas in the B1 and B2 scenarios more focus is given to environmental policies. In the A1 and B1 scenarios there is an increasing international cooperation, whereas in the A2 and B2 scenarios the decision making power is transferred from the international to the national institutions and governments.
When looking at the IPCC scenarios, it is important to keep in mind that there is an uncertainty associated with each scenario that increases with the number of years being predicted. The uncertainty can be due to an inadequate scientific understanding of the problems, through data gaps or lack of data, and to the inherent uncertainties of future events. One example of an unpredictable event is a
13 huge volcano eruption that can have an impact on the mean global air temperature. For instance, it is estimated that the Mt. Pinatubo eruption in 1991 emitted about 20 megatons of SO2 into the
stratosphere, which implied a decrease of 0.5 °C in the surface air temperature and of 0.6 °C in the troposphere in mid-1992 (Parker et al, 1996). The stratospheric cloud from this eruption persisted in the atmosphere for three years after the eruption, maintaining its effects for this period of time.
A significant increase in the CO2 atmospheric concentration is noticed in all IPCC scenarios until the
end of the XXI century (Figure 1). The different scenarios show that this increasing trend will continue and may even be intensified during the XXI century. The increasing concentration of CO2
results in an inhibition of night-time longwave radiation cooling, and in an enhancement of day-time shortwave radiation heating. Consequently, an intensification of continental thermal lows is expected, which results in an increased zonal surface pressure gradient and intensification of alongshore wind in coastal regions and potentially in an increased persistence of coastal upwelling. The coastal upwelling can be an important aspect in climatic variability, as the cooling and consequent stabilization of atmospheric air in contact with upwelled waters can result in a cooler or not so warm future climate in upwelling adjacent coastal regions, even in a global warming IPCC scenario. It is noted that, so far, due to the low resolution of the global models used to elaborate the IPCC reports, the impact of coastal upwelling on the regional climate has not been taken into account in the IPCC scenarios.
1.2
Objectives
This thesis aims to improve the understanding of the evolution of coastal upwelling in the context of climate change. The analysis relies on sets of numerical simulations with a regional ocean numerical model and a coupled atmosphere-ocean model, and will address two separate questions: (1) what trends are to be expected in the Iberian upwelling from global warming? (2) How will feedback mechanisms, introduced by coupling the ocean and atmosphere, impact the Iberian coastal upwelling simulations?
Atmospheric data from recent decades analyzed by ECMWF and NCEP during their reanalysis projects will be here used together with ocean and coupled atmosphere-ocean models to address the above questions. The simulation results are compared against available observations, looking for simulated regional patterns of change consistent with local and remote sensing datasets. Global future climate scenarios, downscaled to the European region during the ―Prudence‖ project, are used to force regional ocean simulations of the Iberian western coast, to assess the impact of climate change on the
14 coastal upwelling. The impact of ocean surface waves on the SST and surface atmospheric temperature will also be assessed with a coupled ocean-atmosphere-wave model.
1.3
Thesis layout
The following chapter presents a summary of the state of the art of coastal upwelling studies. The third chapter presents a description of the setup of the numerical models used in the study, and of the different databases required for initial and boundary conditions in the computational domain used in each simulation. Chapter four presents results of regional ocean simulations for the ERA-40 (1961-2001) and ERA-Interim (1989-2008) periods, using reanalysis data as forcing conditions for the ocean model. Chapter five does a similar analysis in the context of a climate change scenario (scenario A2 from IPCC-AR4), using atmospheric forcing data from simulations performed by the RACMO regional climate model within project ―Prudence‖. Chapter six introduces a coupled atmosphere-ocean-wave model and discusses the impact of key atmospheric and oceanic variables from the three modeled systems on the coastal upwelling. In the last chapter, a summary of the main conclusions of each chapter is presented and some ideas for future work related to the coastal upwelling phenomena research are suggested.
15
Introduction
Chapter 2
The Canary Current Upwelling System
2.1
There are four main coastal upwelling ecosystems in the World Oceans: the California and Humboldt Current ecosystems, in the northern and southern eastern Pacific, and the Canary and Benguela current ecosystems in the northern and southern eastern Atlantic. The geographic location of those systems is presented in Figure 2, showing the mean chlorophyll-a surface concentration distribution for the period 1998-2007.
Figure 2 Geographic locations of the four main coastal upwelling ecosystems in the World Oceans, with the mean distribution of chlorophyll-a surface concentration for the period 1998-2007 (courtesy of H. Demarcq, IRD, France).
The four coastal upwelling ecosystems have in common the fact of having an anticyclone on its western side over the ocean, and a depression of thermal origin on the eastern side over the continent (Bakun, 1990). The presence of the quasi-stationary counter-rotating atmospheric circulation systems around the upwelling regions gives rise to northerly wind in the Northern Hemisphere and southerly wind in the Southern Hemisphere, originating horizontal divergence in the coastal upper ocean layers due to Ekman transport. The upwelling regions are characterized by cyclonic wind stress curl, typically, in the first 200 km off the coast (distance where the maximum wind stress is usually observed). In the zone offshore from the zone of maximum wind stress, an anticyclonic wind stress
16 curl region is normally observed, implying a convergence zone in the upper ocean and consequently downwelling (Bakun and Nelson, 1991).
The Canary current upwelling ecosystem extends from the north-western extreme of the Iberian Peninsula until the Senegal coast. The northern and southern limits of this system vary seasonally according to the local meridional surface wind. This ecosystem is characterized by different hydrological and dynamical characteristics along its meridional extension. For this reason, Aristegui et al. (2009) divided this ecosystem into six sub-regions. A southernmost region between parallels 12 °N and 21 °N, where freshwater runoff assumes importance in the coastal regime due to the outflow of several rivers in the region and a second region between parallels 21 °N and 33 °N off the Mauritanian–Senegalese coast, south of Cape Blanc, that is defined in the north by the separation of the Canary Current from the coast and in the south by the southern limit of the winter upwelling favorable winds. A third region, that comprises the Moroccan and Western Sahara coasts between Cape Sim and Cape Blanc, characterized by year-round upwelling. A fourth region, that corresponds to the Gulf of Cadiz, delimited by parallels 33 °N and 37 °N, unfavorable to upwelling occurrence due to the coastline orientation, as noted by Nykjaer and Van Camp (1994), who reported, from an analysis of ten years of satellite sea-surface temperature data, the absence of upwelling in the region. A fifth region, off western Iberia, that comprises the Portuguese coast and a sixth region, the northernmost one, corresponding to the Galician coast, influenced by freshwater outflow due to the presence of the Rias. The influence of freshwater is noted along the entire western Iberian coast but its importance decreases southwards and it is highly seasonal. Off the Portuguese coast the main sources of freshwater are the rivers Douro, Mondego and Tagus.
Off the western Iberian coast, the upwelling phenomena usually occur during the summer season (Ambar and Dias, 2008; Wooster et al., 1976; Fraga 1981; Tenore et al., 1984; Blanton et al., 1984, Alvarez-Salgado et al., 1993; Perez et al., 1995; Gomez-Gesteira et al., 2006), due to the geographic location of the Azores anticyclone (Bakun and Nelson, 1991) and the presence of the Iberian thermal depression. During the others seasons this process is not normally observed, although some sporadic events have been noticed as referred by Santos et al. (2004) , Alvarez et al. (2003), and deCastro et al. (2006, 2008).
In this thesis only the northern limit of the Canary current ecosystem that encloses the Portuguese and Galician western coasts will be addressed.
The first upwelling studies in the Canary current upwelling ecosystem region were conducted in the mid-1970s by Hughes and Barton (1974a, b) and were based on the analysis of hydrological data obtained from the RRS (Royal Research Ship) ―Discovery‖ cruises in the north-western Africa region. In these studies, some of the main characteristics of coastal upwelling were already noticed. For
17 instance, these authors observed the presence of a poleward undercurrent over the continental slope and also noted that upwelling appeared to be more intense off the main capes, namely Cape Blanc and Cape Bojador. A few years later, Barton et al. (1977) using data from an array of buoys and current meters, also off the northwest Africa region, reported a two-layer flow regime during upwelling events, with a zonal shoreward undercurrent and an upper offshore layer.
Off the western Iberia coastal region, Fiuza (1983), based on remotely sensed surface thermography, observed that coastal upwelling has a strong seasonality with most of the events occurring during the summer season.
Like all major upwelling regions, the Canary current ecosystem is characterized by a rich mesoscale structure in the transition zone between the coastal upwelling region and the open ocean. The interaction between cool, nutrient-rich upwelling waters and warmer, oligotrophic offshore waters is governed by mesoscale activity in the form of filaments, eddies and island wakes (Barton et al., 1998). Off the western Iberian coast, one observes the persistence of intense upwelling filaments off the main capes, namely Cape Finisterre in the northern limit of western Iberian coast, Cape Carvoeiro in the central region and Cape St. Vicente on the southern limit of western Iberia Peninsula coast. The persistence of filaments off the main capes is thought to be related with the interaction of the near-surface ocean current with topographic features and/or connected with orographic effects in the surface wind stress field, as capes seem to induce an increased cyclonic surface wind stress curl in the region nearby (Haynes et al., 1993). These ocean filaments exhibit enhanced turbulence values in its boundaries, as noted by Barton et al. (2001).
Basic upwelling dynamics
2.2
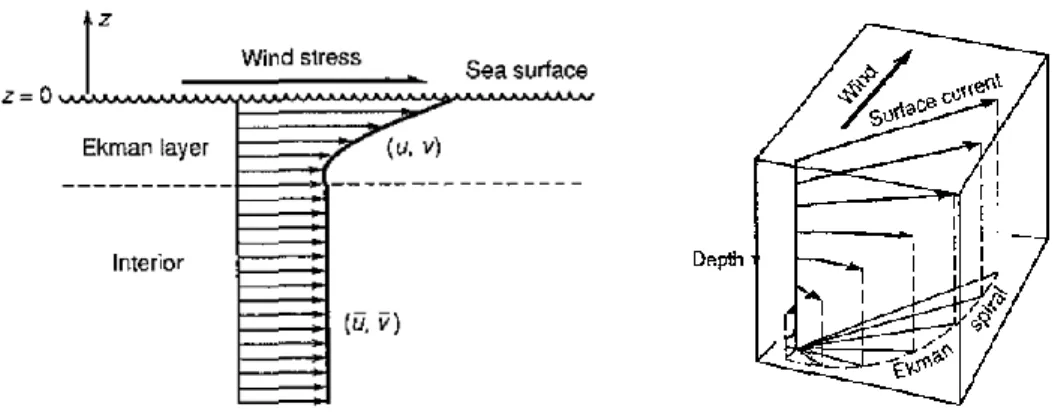
In the following paragraphs it is made a brief description of the expected ocean dynamical behavior during a coastal upwelling event, and of the basic equations that describe this behavior, namely within the upper ocean boundaries layer.
The persistent northerly surface wind blowing along the western Iberian coast gives origin to coastal upwelling, characterized by offshore Ekman transport in the upper ocean layers, which implies the formation of a strong density front where the thermocline upwells to the surface and the presence of an associated along-front equatorward jet-like flow (Peliz et al., 2002; Aristegui et al., 2009). Simultaneously, the sea level near the coast is lowered due to the convergence of upper ocean layers in the offshore region, building a zonal gradient of the sea surface height contributing to theonsetof the
18 above-mentioned geostrophic southward flow. The latter weakens with depth and usually becomes poleward near the seafloor over the continental slope.
In a zonal cross-section, seen from the south (Figure 3), the along-coast ocean currents are represented by the tail of an arrow (), indicating northward flow, or by its tip (⨀), indicating southward flow. In this figure the dashed blue lines represent the mean depth of the Ekman and benthic boundary layers, the green zone represent the upwelled pycnocline, the grey arrows represent the offshore transport within the surface Ekman layer, and the dark arrows represent the deep onshore transport.
Figure 3 Sketch of the mean circulation off the western Iberian coast during the upwelling season (Aristegui et al., 2009).
The poleward undercurrent flow, represented by the dark blue color in Figure 3 is largely forced by the interaction between the meridional density gradient and the continental slope and shelf (Huthnance, 1984). In addition to this poleward undercurrent, Peliz et al. (2002) also noticed a second inner shelf counter-flow characterized by a northward current, represented in Figure 3 by the light blue inner shelf region. According to the authors it has origin in the response to the strong offshore deflection of the upwelling current and to the presence of the WIBP (Western Iberia Buoyant Plume), which comprises low salinity surface waters present on the inshore side of the upwelling front originating from the rivers runoff along the western Iberian coast. Also according to the authors, the WIBP has a strong seasonal cycle, with a weaker intensity in summer due to lower river runoff. Within the inner-shelf region the Ekman and bottom boundary layers overlap, the flow is strictly parallel to the coast, the cross-shore transport vanishes, and the frictional effects due to wind and bottom stresses compensate each other and maintain the flow in the alongshore direction throughout the entire water column. This area is, typically, more extended in wide and shallow continental regions, and creates an inner ocean
19 front which provides retention for biological material (e.g. fish eggs and larvae) in the highly productive near-shore environment (Estrade et al., 2008). In the region to the west of the inner-shelf front, the main upwelling front and associated southward jet are present. This is the region where the pycnocline upwells to the surface and is represented in purple in Figure 3.
Contrary to open-ocean upwelling, coastal upwelling is not only due to diverging Ekman transport, but also due to Ekman pumping. While the near-shore surface wind drop-off favors the Ekman pumping mechanism, the stronger near-shore winds (i.e. smooth drop-off) favors coastal upwelling due to divergence in the upper ocean layers (Capet et al., 2004).
Figure 4 depicts the ocean surface Ekman layer and its respective hodograph.
Figure 4 Scheme of the surface Ekman layer generated by surface stress on the ocean surface (Cushman Roisin, 1994).
Neglecting pressure gradients, the zonal and meridional momentum in the upper ocean Ekman layer satisfy the following equations:
( ̅) (1a) ( ̅) (1b)
In the above equations, and are the zonal and meridional currents within the Ekman surface layer and ̅ and ̅ are the zonal and meridional currents in the ocean interior, is the Coriolis parameter, is the ocean kinematic viscosity and is the vertical coordinate, as represented in Figure 4.
20 To solve the above equations the following boundary conditions at the ocean surface ( ) are taken into account:
(
2a)
(2b)In the lower boundary, toward the ocean interior ( ), the considered boundary conditions are ̅ and ̅ .
In equations (2a) and (2b), is the reference density, and are respectively the zonal and meridional wind stress.
The solution to the above equations is:
̅ ( ⁄ ( )) ̅ ⁄ ( )
(
3a)
̅ ⁄ ( ) ̅ ( ⁄ ( )) (3b)
From equations (3a) and (3b) it can be noted that the wind driven flow is inversely proportional to the Ekman depth, that takes the form:
√
(4)
Near the surface (z 0) the downstream and transverse components have approximately the same value (u v), thus implying that the velocity is 45 to the right of the interior velocity.
The vertical velocity in the interior of the Ekman layer, usually named Ekman pumping, is computed by vertical integration of the continuity equation taken into account the boundary conditions ( ) at the ocean surface and ( ) ̅ at the ocean interior boundary of the Ekman layer:
21 ̅ ∫ ( ) ( ̅ ̅ ) ̅ (5)
In the last member of the above expression, P represents pressure and the geostrophic approximation was considered. Relation (5), shows that the Ekman pumping velocity increases with the vorticity, and decreases with latitude (decreasing f).
Coastal upwelling indices
2.3
Since the first coastal upwelling studies, researchers have tried to use an index to determine the intensity, frequency and duration of this coastal phenomenon. One of the first coastal upwelling studies was conducted during the 1970‘s by the Pacific Fisheries Environmental Laboratory (PFEL). At that time, daily and monthly upwelling indices were generated at fifteen geographic locations along the west coast of North America. The first set, beginning in 1967, included daily and weekly averages of six-hourly upwelling indices estimated from six-hourly synoptic pressure fields. The second set was extended back to 1946 and derived from monthly mean pressure fields. The zonal and meridional wind components were computed taken into account the geostrophic approximation:
(6a) (6b)
Equations (6a) and (6b) express the geostrophic wind, where is the Coriolis parameter ( is the Earth‘s angular velocity), is the air density and is the Earth mean radius, is the surface pressure, is latitude, and is longitude. The ocean Ekman transport was then computed as:
22
⃗⃗ ⃗ (7)
where is the wind stress computed with expression:
| | (8)
in which is an empirical drag coefficient, is the computed near surface wind vector with magnitude | |.
More recently, Alvarez et al. (2008) computed an upwelling index for the western Iberian coast based on surface wind data from the QuikSCAT sensor. These authors computed the zonal and meridional Ekman transport, respectively and , for the 2000-2006 period, following the relations:
( ) ⁄
(9a)
( ) ⁄ (9b)
In equations (9a) and (9b), U and V are the zonal and meridional components of the wind speed at 10 m, the other symbols represent the same variables indicated before. The upwelling index ( ) was then computed as the Ekman transport perpendicular to the coastline:
( ) ( ) (10)
In equation (10) where is the angle of the unitary vector perpendicular to the coastline pointing landward (Gomez-Gesteira et al., 2006).
A different kind of coastal upwelling index, that is also one of the most commonly applied, consists in a simple SST difference between a point close to the coast and a point located far enough away from the coast as not to be affected by the upwelling front or filaments. The SST data used to define the
23 upwelling index is normally retrieved from satellite sensors. With the development of remote detection technologies verified in the last decades, the temporal and spatial resolution of available observational data over the oceans has significantly increased.
SST data derived from AVHRR (Advanced Very High Resolution Radiometer) sensor is available since the beginning of the 1980‘s. This sensor works in the infrared band, which has the disadvantage of being affected by cloud cover and the presence of fog, both leading to a sparse database particularly in coastal upwelling regions during the summer season (when foggy days and stratus clouds are frequently observed). Recently, the AMSR-E (Advanced Microwave Scanning Radiometer for EOS) sensor on-board the Aqua satellite and the TMI (Trmm Microwave Imager) sensor on-board the TRMM (Tropical Rainfall Measuring Mission) satellite started to retrieve SST data. These two sensors work in the microwave frequency band, which has the advantage of not being affected by the presence of clouds. On the other hand, those sensors have the disadvantage of not retrieving SST data under large precipitation conditions and in regions within 50 km from the coast, making them less appropriated for upwelling studies. Moreover, the TMI sensor only gives SST values between the latitudes 40°S and 40°N. In addition to SST retrieved from satellite sensors, one can also obtain SST data from local observations, but these are normally only available close to the coast, in discrete points and with a poor temporal resolution.
Inter-annual variability and trends of the
2.4
upwelling regime
During the last years, coastal upwelling trends have been observed in the four main coastal upwelling ecosystems based on surface wind and SST data.
Demarcq (2009) analyzed SST data for the period 1985-2007 from the Pathfinder database and observed a slightly lower SST trend in upwelling regions (0.42°C per decade) than elsewhere in the continental margins (0.56°C per decade), which can possibly be interpreted as a consequence of an increase in the upwelling intensity. However, the SST trends computed by Demarcq (2009) are not equal among the four upwelling ecosystems. Lower SST trends were observed in the southern Pacific and Atlantic ecosystems (<0.2°C per decade), while a stronger SST trend was observed in the Canary and California ecosystems (>0.5°C per decade). It is here noted that the spatial structure of those trends within each ecosystem was not analyzed. From QuikSCAT wind data for 2000-2007, the author computed a mean positive trend in meridional wind intensity of 0.12 m.s-1.decade-1 in the four main
24 upwelling regions. This intensification of the meridional wind component seems to agree with atmospheric global models and data reanalyses that indicate an intensification and expansion of the Hadley cell in recent decades (Mitas and Clement, 2006; Seidel et al., 2008). This is also in agreement with Bakun (1990), who based on individual wind reports from ships at sea, for the 1970-1985 period, showed an intensification of the along-coast wind in the four main eastern boundary upwelling ecosystems.
Concerning the western Iberian upwelling ecosystem, the conclusions with respect to coastal upwelling trends in the last decades are not in complete agreement among the different published studies. Alvarez et al. (2008), using Ekman transport data, computed from a PFEL wind database for the 1967-2006 period (with 1 resolution, approximately), observed a weakening in upwelling intensity during most of the year (with the exception of February, June and July) taking into account the mean Ekman transport value at six points equally spaced along the western Iberian coast. The authors also noted a stronger variability in the upwelling index in autumn and winter, when compared to spring and summer.
With regard to studies of upwelling trends some authors find that stronger Ekman transport (computed from surface winds) occurs one to two month earlier than when more upwelling events are observed in the satellite sea surface temperature maps (Alvarez et al., 2010, Fiuza et al., 1982; Nykjaer and VanCamp, 1994; deCastro et al., 2008). This time lag can lead, when analyzing only wind data, to inaccurately identifying the months when coastal upwelling events occur more frequently.
In a more recent study, Alvarez et al. (2010), also using Ekman transport data provided by PFEL but this time just for the western and northern Galician coasts, noticed that the number of upwelling favorable days off the western Galician coast, identified by the upwelling intensity threshold > 16 m3.s-1.km-1 (this threshold corresponds to winds with intensity lower than 1 m.s-1 to remove calms), have been decreasing during the 1967-2008 period, while an increasing trend in the yearly mean computed upwelling index ( ) was observed ( represent the zonal Ekman transport values). To quantify the real impact of coastal upwelling these authors computed a new variable expressed by:
∑ (11)
The upwelling impact variable ( ) computed using equation (11) takes into account the upwelling intensity ( ), ni the number of consecutive days under upwelling favourable conditions considering
25 ni4 and the number of days under upwelling favorable conditions ( ). No significant trend was observed in this variable, with just a slight increase being noticed by the authors.
Using wind data from the Portuguese Institute of Meteorology and a linear regression model, Lemos and Pires (2004) found a progressive weakening of the upwelling regime along the western Portuguese coast from 1941 to 2000.
More recently, Narayan et al. (2010) noticed an increasing trend in the intensity of coastal upwelling off the northwestern African coast during the period 1960-2001. Their analysis was based on the meridional wind stress and SST data from the COADS (Comprehensive Ocean-Atmosphere Data Set) database. These authors, as Bakun (1990), related the coastal upwelling increasing trend with the global warming due to higher greenhouse gases concentration. As a consequence of the warming, an intensification of the thermal depression on the continental side of the Canary current upwelling ecosystem, and consequent intensification of the northerly winds along the western Iberian coast, was suggested.
From analyzing satellite-derived SST time series for the period 1985-2008 Santos et al. (2005) found evidence in SST fields of coastal upwelling intensification off the western Iberian coast from 1992 onwards. Relvas et al. (2009) also reported a weaker warming trend off the southern part of western Iberian coast when compared with that farther north. This seems to indicate an intensification of coastal upwelling in the southwestern Iberian coast since 1985.
A study by McGregor et al. (2007) looked at longer term changes in upwelling off northwestern Africa, and its impact on the sediment record, and concluded that significant changes may have occurred on the decadal to centennial scales.
When comparing different wind databases, Narayan et al. (2010) identified significant discrepancies for the 1960-2000 period between the COADS, NCEP/NCAR and ECMWF/ERA-40 meridional wind data along the northwestern African coast. The COADS and ERA-40 databases, for instance, show an increasing trend in the wind intensity while the NCEP/NCAR database shows a decreasing tendency. Even comparing the COADS and ERA-40 databases, although both indicate a positive trend, the trend in the COADS database is 3 times larger than the one in the ERA-40 database.
27
Methodology
Chapter 3
Advantages of using numerical models
3.1
The development of numerical models and computational processing capabilities during the last decades has permitted the numerical simulation of the atmosphere and ocean dynamical and thermal fields with an increasing temporal and spatial resolution. In the particular case of coastal upwelling studies, the use of numerical models allowed to better identify coastal upwelling events, when compared with studies based only on SST or wind observational data.
In purely observational studies, it is likely that some events can be misinterpreted as upwelling, since observed cool coastal SST can be due to mechanisms other than coastal upwelling. For instance, the cold coastal temperatures can be caused by a meridional advection of cold ocean surface waters or by an offshore advection of low temperature continental air over the ocean. The latter process cools the ocean surface by transferring heat across the atmosphere-ocean interface. This situation can possibly occur, more frequently, during the autumn and winter months, when the surface air temperature over the continents decreases faster than over the ocean due to different thermal capacities of both fluids. In both of the above cases, the lower SST observed in coastal waters is not due to the vertical advection of deeper cold water caused by a coastal upwelling event.
There are also some issues that should be taken into account, when studying coastal upwelling based on wind data only. The vertical stratification and dynamical field of the coastal ocean off western Iberian varies during the year. As a result, wind with a specific intensity and direction will have different effects on the SST field, depending on the season of the year.
In short, when analyzing separately SST or wind data there may be cold SST days at the coast, that are misinterpreted as upwelling events. To clarify the analysis it is essential to look at both the coastal dynamical and thermal fields. Numerical models allow the simultaneous analysis of all relevant fields, including sea surface height, ocean currents, temperature and salinity at a convenient vertical and horizontal grid resolution. This enables the computation of an upwelling index that takes into account both the ocean dynamical and thermal properties and is more likely to properly identify cases where cold coastal SSTs are due to coastal upwelling events. Another important advantage in the use of numerical models is their capability to simulate future climate scenarios, as those presented in IPCC reports.
But numerical models also have some disadvantages. When interpreting the output of numerical models, it is important to keep in mind that the numerical methods applied to solve the dynamic and thermodynamic equations of the ocean and atmosphere always have associated errors. These errors
28 often lead to significant deviations from observations. Errors in numerical models can be due to the lack of accuracy of the imposed initial and boundary conditions or to model deficiencies (for instance, lack of proper physical parameterizations). Because of their individual limitations and strengths, numerical models, satellite and in situ observations all play an important and complementary role in coastal upwelling studies.
Model description
3.2
3.2.1 The Regional Ocean Modeling System (ROMS)
The ROMS numerical model is being developed at the University of Rutgers, USA, and is presently one of the most used numerical models in coastal ocean research. As an open source model its code is currently the result of numerous contributions from world-wide researchers. There are presently three main versions of the ROMS model: one maintained at UCLA (University of California, USA), one at IRD (Institut de Recherche pour le Dévelopement, France) and the main one at Rutgers University. The results here presented were obtained with the latter version.
ROMS has been successfully applied to the four major coastal upwelling ecosystems referred in Chapter 2. In the western Iberian region, Oliveira et al. (2009) used the model and satellite data to show the main regional patterns of coastal spatial and temporal SST variability, namely the strong along-slope flows, the development of filaments, separated jets and shadow areas downstream of the main capes, frontal-scale instabilities and the rapid onset of coastal counter-currents along the inshore zone during wind relaxation phases. For this upwelling ecosystem, Peliz et al. (2007b) also used ROMS with a lagrangian sub-model that includes advection, diffusion, and diel vertical migration, to simulate crab larvae dispersal, which resulted in a good match between model results and observations.
For the California current upwelling ecosystem, Penven et al. (2006) made use of a one-way grid nesting technique in ROMS to simulate upwelling phenomena at a higher resolution in the coastal region, where the dominant spatial scales are typically smaller than those observed in the open ocean. Also in the California current ecosystem, Capet et al. (2004) applied the model to show the impact of the nearshore wind spatial structure on the patterns of the upwelling circulation, surface temperature, and biogeochemical processes.
For the Benguela current ecosystem, Penven et al. (2001) and Blanke et al. (2002) showed the ability of the model to correctly simulate upwelling events in the region by obtaining a fair degree of correlation between the model output and local observations.
29 For the Humboldt current upwelling ecosystem, Penven et al. (2005) showed that ROMS model is able to reproduce the known dynamics of the region, namely, the equatorward Peru coastal current, the Peru-Chile undercurrent and the Peru-Chile countercurrent. Also Echevin et al. (2008) used ROMS to study the southern Indian Ocean upwelling ecosystem and noted that the highest chlorophyl concentration is observed in austral summer and lowest values during austral winter, in agreement with satellite and in situ observations.
3.2.1.1 ROMS equations
In order to made a brief description of the numerical model used in this study, from which most of the results presented here were retrieved, in the following lines are presented some of the main equations solved numerically by ROMS during the simulations.
The ROMS numerical model is a free-surface, terrain-following, primitive equations model, that uses the hydrostatic approximation (the vertical pressure gradient balances the buoyancy force) and Boussinesq approximation (density variations are neglected in the momentum equations except when their contribution to the buoyancy force in the vertical momentum equation are taken into account). In the hydrostatic approximation, the vertical momentum equation is reduced to:
(12)
where represents pressure, the vertical coordinate, density and is the acceleration due to gravity.
The horizontal momentum equations in the zonal ( ) and meridional ( ) directions are expressed by the following equations:
( ̅̅̅̅̅̅ ) (13a)
30 ( ̅̅̅̅̅̅ ) (13b)
where and are, respectively, the zonal and meridional components of currents, , and represent small-scale fluctuations of the three current components and is the Coriolis parameter ( ) , where is the Earth‘s angular velocity ( ), is the sidereal period, is the latitude, is the dynamical pressure, computed as . In the above equations an overbar represents a time average and and are, respectively, the forcing and diffusive terms.
The advection-diffusion equation for the tracers (temperature and salinity) is expressed as:
( ̅̅̅̅̅̅
)
(14)
where C is a scalar concentration field.
Considering the ocean an incompressible fluid, the continuity equation is expressed by:
(15)
The model equations are discretized over a variable topography using a stretched, terrain-following, vertical coordinate. As a result, each grid cell has a different level thickness and volume depending on the local depth. The model state variables are staggered on an Arakawa C-grid, as shown in Figure 5.
31 Figure 5 Sketches of the Arakawa-C grid used in ROMS (figures retrieved from the wikiroms website).
In each computational grid cell, the free-surface, density, temperature and salinity variables are calculated at the center of the cell, whereas the zonal and meridional horizontal velocities are located, respectively, at the west and south edges of the cell, and the vertical velocities are calculated at upper and lower edges of each computational cell.
ROMS is a split-explicit ocean model, where short time steps are used to advance, explicitly, the surface elevation and barotropic momentum equations (thus called barotropic time step), and a larger time step (called baroclinic) is used to advance the temperature, salinity, and baroclinic momentum equations.
32 The 3D and 2D equations are time discretized using a Leap-Frog predictor and a three-time Adams-Moulton corrector method. For advection schemes ROMS has various options, like second and fourth order centered differences and a third order, upstream biased, scheme.
In ROMS, turbulence is computed explicitly for parameterization of sub-grid scale vertical mixing processes. A two equations turbulence scheme, named GLS (Generic Length Scale), developed by Warner et al. (2005), was used in the simulations presented here.
ROMS parameterize the turbulent fluxes at the air-sea interface following the COARE 3.0 algorithms presented in Fairall et al. (2003). These algorithms were formulated based on ship, buoy, aircraft, satellite and model data.
The UNESCO (United Nations Educational, Scientific and Cultural Organization) non-linear equation of state derived by Jackett and McDougall (1995) is used to compute in situ density from salinity and potential temperature and pressure values. It should be noted that the new equation of state TEOS-10 was recently implemented in the ROMS code but it was not used in the results presented in this thesis in order to maintain all the ROMS simulations here presented consistent. The new equation of state is based on a Gibbs function formulation from which all thermodynamic properties of seawater (density, enthalpy, entropy and sound speed) can be derived in a thermodynamically consistent manner.
A complete description of the model equations and of the numerical methods applied to solve them is not the scope here and can be found in Shchepetkin and McWilliams (2003, 2005, 2009) and Haidvogel (2000).
3.2.1.2 ROMS boundary conditions
The lateral boundary conditions most frequently used in the ROMS are the radiation and nudging conditions (Marchesiello et al., 2001).
The radiation condition for a generic prognostic model variable is represented by:
(16)
where and are, respectively, the zonal and meridional components of the phase speed, that are computed as follows:
33 ⁄ ( ⁄ ) ( ⁄ ) (17a) ⁄ ( ⁄ ) ( ⁄ ) (17b)
If the computational boundary has an outward propagation for a prolonged time, the predicted boundary values may evolve to values quite different from the imposed boundary conditions; when an inward propagation is verified, numerical instabilities may arise at the boundaries (Marchesiello et al., 2001). To overcome this problem, an additional term is added to the radiation boundary condition equation (see right hand side term below), thus applying a nudging condition:
( )
(18)
where,
if (outward propagation) (18a)
and if (inward propagation) (18b)
In equation (18) represents the external data given as boundary conditions and represent, respectively, the inward and outward relaxation timescales. Typically, the outward timescale has a much higher value than the inward timescale ( out >> in). During outward propagation
weak nudging prevents huge deviations and the over-specification problem, while during inward propagation a strong nudging is applied, although not too strong in order to avoid data-shock
34 problems. In addition to the radiation and nudging boundary conditions, a sponge layer is also usually applied. This sponge condition consists on imposing a lateral layer around the computational domain with an increased viscosity and diffusivity in order to reduce eventual boundary instabilities.
In the ROMS model the upper boundary conditions are expressed by the following expressions:
( ) (19a) ( ) (19b) (19c)
where is the vertical eddy viscosity, is the vertical eddy diffusivity, and and are the zonal and meridional components of the surface wind stress and represents the surface
concentration flux,
The vertical velocity on the ocean surface ( ) is computed by:
(20)
where is the height of the ocean free surface. The bottom boundary conditions are expressed by:
( ) (21a) ( ) (21b)
35
(21c)
(21d)
In the above equations and represent, respectively, the zonal and meridional components of the bottom stress. In equation (21d) is the bottom vertical velocity and the other variables have the same meaning indicated above for the upper boundary conditions. The horizontal velocity components are constrained to accommodate a prescribed bottom stress that obeys the quadratic formulation of bottom friction.
As a free surface model, ROMS can gain or lose water through its computational lateral boundaries. In order to avoid cumulative volume errors, the barotropic inflow are uniformly adjusted at the open boundaries in a way that the total volume transport across the boundaries is balanced (Marchesiello et al., 2001).
The volume conservation condition is expressed by:
*∭ + ∬ ⃗⃗⃗ ⃗ ∫ ̅⃗ ⃗
(22)
where ⃗ is the inward unitary vector, the surface current and and are, respectively, the enclosed area and perimeter of the computational domain.
A normal velocity correction ( ) is defined in order to obtain a new barotropic current expressed by
̅̅̅̅̅̅⃗⃗⃗⃗⃗⃗⃗⃗⃗ ̅⃗ ̅̅̅ ⃗ (23)
So that the variation of total volume is only a result of physical sources and sinks of seawater ( ), as expressed by
36
∫ ( ̅⃗ ̅̅̅) ⃗ ∫ ̅⃗ ⃗ ∫ ̅̅̅
(24)
where ̅̅̅ is the normal velocity correction, computed by:
̅̅̅ (∫ ̅⃗ ⃗ ) (25)
In this way the change of volume within the computational domain depends only on sinks and sources present inside the domain, as thermal expansion effects, precipitation, evaporation, river runoff and tidal fluxes, expressed by the term.
3.2.2 The COAWST coupled ocean-atmosphere system
COAWST (Coupled Ocean-Atmosphere-Wave-Sediment Transport) is a coupled modeling system comprising three open source models (Figure 6): an oceanic model (ROMS), an atmospheric model (WRF) and a wave model (SWAN). To exchange properties between the different models the MCT (Model Coupling Toolkit) coupler is used. MCT allows the transmission and transformation of distributed data between component models (Larson et al., 2004; Jacob et al., 2005). Each model calls the MCT during execution to send and receive data. The coupled system COAWST is being developed at the USGS, USA. Warner et al. (2010) present a description of COAWST and show results of the system, when applied to a real case of hurricane Isabel, which stroke the United States eastern coast in the summer of 2003.
Within the COAWST system each model runs with its own grid, which can be common or different among them. In simulations with different spatial resolutions, in order to allow the models to exchange fields, the SCRIP (Spherical Coordinate Remapping Interpolation Package) code (Jones, 1998) is used to compute the interpolation weights. The weights are computed as a pre-processing step and then are read during initialization and used in the sparse matrix interpolation as described in Warner et al. (2008).
37 Figure 6 Numerical models that comprise the COAWST coupled system.
The WRF (Weather Research and Forecasting) atmospheric model is a widely used model in both operational weather forecasting and atmospheric research. The core equations of the WRF-ARW (Advanced Research WRF) version are the fully compressible, Eulerian and non-hydrostatic equations with a run-time hydrostatic option. The model is conservative for scalar variables and uses a terrain-following hydrostatic-pressure vertical coordinate, with the top of the model being a constant pressure surface. It uses an Arakawa-C horizontal grid. For time integration, second and third-order Runge-Kutta schemes can be used. For the spatial discretization, in both horizontal and vertical orientations, second to sixthorder advection schemes can be applied. A detailed description of the WRF model can be found in Skamarock et al., (2008).
SWAN (Simulating WAves Nearshore) is a spectral wave model that simulates wind wave generation and propagation in coastal waters and includes the processes of refraction, diffraction, shoaling, wave– wave interaction and dissipation due towhite-capping, wave breaking and bottom friction (Booij et al., 1999).
The wave model solves the action balance equation (26), expressed by Holthuijsen, (2008):
(26)
where ( ) is the action density spectrum, defined as the wave energy density ( ) divided by the relative frequency ( ), a quantity that is conserved in the presence of currents. Parameter
is the relative radian frequency (in a reference frame moving with the ocean current), is the
38 of (26) the group velocities in the and directions, respectively and represent the propagation of action density in space, the fourth term represents changes in relative frequency due to variations in depth and currents with a propagation speed c in the frequency space, and the fifth term represents the depth and current-induced refraction with a speed c in directional space. On the right-hand side the Sw
term represents sources and sinks of wave energy density. The SWAN model allows input of temporal and spatially varying ocean currents and water level, and changes in bathymetry and bottom roughness.
The COAWST coupled system allows different configurations with the numerical models that comprise the system, as shown in Figure 7. In the configuration presented in case A, the WRF model is forced by a time varying SST that, for instance can be retrieved from an Optimally Interpolated SST database. In case B, the COAWST system consists of WRF coupled with ROMS. In this case, the ROMS model transfers the SST field to the WRF atmospheric model and the latter provides ROMS with surface wind, atmospheric pressure, relative humidity, surface air temperature, cloud clover, precipitation, and the shortwave and longwave net radiation. The configuration presented in case C corresponds to the fully coupled system WRF-ROMS-SWAN. In this case, the variables exchanged between WRF and ROMS are identical to those described for case B; the WRF model transmits to SWAN the surface wind field, while SWAN communicates to ROMS the significant wave height, the wave length, the wave direction, surface wave period, bottom wave period, the percentage of wave breaking, the wave energy dissipation and the bottom orbital period fields. In turn, ROMS provides SWAN with zonal and meridional surface currents, sea surface elevation and bathymetry. The SWAN model communicates to WRF the significant wave height and wave length fields.
Within COAWST, the ROMS ocean model uses the COARE algorithms to compute the ocean surface stress and the ocean surface net heat and freshwater fluxes (Fairall, et al., 1996, 2003). As an alternative to COARE algorithms, it is possible to use in ROMS the momentum and heat fluxes computed by WRF, allowing both models to use identical fluxes at the atmosphere-ocean interface.
39 Figure 7 Different configurations that the COAST coupled system can assume. Legend: Uwind: zonal wind component; Vwind: meridional wind component; Patm: atmospheric pressure; RH: air relative humidity; Tair: atmospheric surface temperature; Cloud: cloud cover fraction; Rain: precipitation;
SWrad: shortwave radiation; LWrad: longwave radiation; SST: sea surface temperature; Us: Zonal
component of ocean surface current; Vs: Meridional component of ocean surface current; : free surface elevation; bath: bathymetry; Hsig: significant wave height; Lwave: wave length; Dwave: wave direction; Tsurf : surface wave period; Tbottom: bottom wave period; Qb: percentage wave breaking; Wdissip: wave energy dissipation; Ub: bottom orbital velocity; WRF: Weather Reaseach and Forecasting; ROMS: Regional Ocean Modelling System; SWAN: Simulating Waves Nearshore;
CSTMS: Community Sediment Transport Modelling System.
In WRF the sea surface roughness is computed as:
(27)
In COAWST, in order to take into account the effects of waves on the sea surface roughness, the same variable is computed following Taylor and Yelland (2000) as:
( )