Page 1 of 12
Defining Future Climate Conditions for a River Basin in Northeast Brazil:
Combining GCMs Predictions, Promoting Scenario Planning, and
Embracing Uncertainty
Layla Lambiasi1; Alexandre Gross2; Mario Monzoni3 The project defined future climate scenarios considering possible changes in patterns and physical behaviors of a river basin found in Northeast Brazil. An earlier study compiled IPCC’s 21 GCMs results on precipitation, evaporation, and flow data. Such results were than analyzed using statistical methods to understand the main hydroclimate parameters, replicating them to achieve a contextualized and representative ensemble of future configurations. Three flow rates scenarios came out from the process. Although the scenarios are a share of a broader context, the method over its conception stands for another way of working GCMs results.
1. Introduction
Regularly, policy-makers face several dilemmas planning alternatives under a changing climate. In this context, devising for future it is not an obvious assignment. Climate models offer a convenient alternative for the unknown problems to come, yet its products are not ease to incorporate. Therefore, bridging science and policy requests new manners of understanding what science is saying.
To test a different approach, we focused on a scarcity prone water basin in Northeast Brazil (Piancó-Piranhas-Açu). Moreover, our primary reason to define future climate conditions for the chosen area was to run a water allocation simulation. Afterwards, the simulation results would compose water deficits and the associated economic loss. In this sense, the scenarios needed to be by each reservoir of the local water infrastructure, expressed through flow rates series. Motivations
Problem resolution methods have historically followed linear conceptions of thought primarily assuming stationarity of natural phenomena. Scientists have the habit of looking into the past to comprehend the future. In this sense, infrastructural planning in different sectors, such as sanitation, transportation, and water recourses, has taken complex variables as constant patterns.
Quay (2010) calls this type of approach as ˜Predict and Plan˜, dated from the 60’s and consisting in perceiving the word as a stable and predictable set of events.
1 Researcher at the Center for Sustainability Studies (GVces) of the Business Administration School of Fundação Getulio Vargas (FGV-EAESP). [email protected]
2 Researcher at the Center for Sustainability Studies (GVces) of the Business Administration School of Fundação Getulio Vargas (FGV-EAESP)
3 Coordinator of the Center for Sustainability Studies (GVces) of the Business Administration School of Fundação Getulio Vargas (FGV-EAESP)
Page 2 of 12
These conventions significantly influenced society’s development. Now, once one changes the hypothesis, human systems have shown to be each time more climate sensitive However, by systematizing reality, researchers and policy-makers manage to expand their capacities over physical and social environments. Earlier approaches envision new wider, wiser, and thus more resilient planning alternatives.
It is easy to recognize the “Predict and Plan” approach in classic hydrology. Historically, replicability of stationary hydroclimatic parameters traditionally drove the conception of water systems. Most recently, climate change has been a new factor in the equation, challenging ages of knowledge. To continue hand in hand with tradition, planning processes now have General Circulation Models, or GCMs, to account for its “predict” element, offering simulated expectations of future climate. Nevertheless, scenarios arising from computerized models are commonly perceived as certain and complete by policy-makers and practitioners alike, who proceed to neglect their inherent uncertainty. Predictive science is essential to better understand earth’s systems. Yet, practical answers derived from GCMs outcomes need to focus on how and in what way it can be used. Although simulations have improved, and continue to do so, projected scenarios still carry much haziness.
“Anticipatory governance” is how Quay (2010) defines the required new perspective. Such a practice consists on embracing planning for future inherent uncertainty and, thus, incorporating it in the process. By doing so, human systems could become more versatile and therefore resilient. In this sense, the undefined paths climate change can take and the lack of clarity around climate projections ask for innovative efforts in the decision-making sphere.
Scenario Planning
A recognized way of dealing with uncertainty is promoting scenario planning. That means the process around decision-makers choices should consider how a set of alternatives performances in different conditions. In the end, it should be possible to recognize which alternative is a good (better) fit in all scenarios. For it to be significant is interesting to consider a solid range of conceivable and desired situations.
In this sense, the project conducted to the selection of, from an earlier study that compiled and analyzed IPCC’s GCMs results, an ensemble of different and satisfactory circumstances. Once introducing another point of view over GCMs in a practical application, the goal was to embrace uncertainty and promote its incorporation on climate risk management. Far from the ambition of predicting the future, the challenge is to find an efficient set of scenarios of possible and plausible situations and therefore perceive science in a more comprehensive way, placing the habitual predictive modeling practices closer to the policy-making sphere.
Region of interest: Piancó-Piranhas-Açu Basin
The region of interest is one of the most vulnerable in Brazil, constantly threatened by severe droughts and, at the same time, tough rainfalls. In addition, the area itself
Page 3 of 12
has peculiar climate dynamics: all the rain precipitates between February and May and the water supply for the rest of the year depends primarily on this period.
Climate variability is an intrinsic characteristic of the basin, ruling its social behaviors and justifying the main importance of its water infrastructure. Because of geological attributes, most rivers are not perennial and soil cannot retain enough water under the surface. Therefore, the basin is mainly a system of integrated reservoirs working to storage and keep the water flowing (ANA, 2016).
Around the basin territory there are close to 2.300 dams of all sizes. Between them, 51 are strategic reservoirs. Within these, nearly 70% of all reserved water is in the two largest ones. Hence, social, and economic activities depend mainly on the maintenance of satisfactory hydrologic levels in these reservoirs. Since 2012, the region is going through a drought and most of it reservoirs are nearing collapse. Another key factor of local climate is the role of evaporation. High rates of insolation can drain, during the period without rain, smaller reservoirs, upon which most of small urban centers and rural populations depend. On the other hand, when the rain period is back, the amount of water capable of falling can exceed reservoirs capacities and even threaten its stability. Thereat, the basin is a land of climate extremes and highly relevant to study climate change’s possible effects.
2. Methodology
Input Data Background
Being of high national interest, the region is focus of different researches. The procedure introduced here was only possible thanks to a previous study (FUNCEME, on press) conducted over the same area. Such study compiled IPCC’s 21 GCMs results of precipitation and evaporation, considering the coordinates of the two biggest reservoirs in the basin. They considered two of the four Representative Concentration Pathways, or RCP, adopting the 4.5 and the 8.5 scenarios. Besides that, the same study also runs a hydrologic model to obtain flow rates series in each reservoir.
The time boundary for the simulations was 30 years in the past and 70 years in the future, starting from 2011. The produced data consisted in hydrological series of these three variables (precipitation, evaporation and flow rates) expressed in monthly basis for the referred period.
Our study, however, chose to focus solely on flow rates to compose the analysis. This preference is justified given the important role evaporation plays in the basin: the difference between what falls as rain and what fills the reservoirs can be massive. To obtain flow rates series, the hydrologic model considers the interaction between precipitation, evaporation, and geological characteristics. For that reason, flow data represents better the natural processes of the area.
Another study (ANA, on press) also contributed substantially by providing flow series historical data for the 51 strategic reservoirs of the basin. These two sources worked together to sustain the methodological steps presented next.
Page 4 of 12
Methodological Steps
To gather a representative sample of possible configurations of future flow rates, hydrologic modelling results were than analyzed using statistical methods. The main goal was to recognize replicable patterns over its hydroclimate parameters. In the end, the major tendencies outlined by the models would conduct to a set of desired scenarios of interest. The final flow rate scenarios emerge from applying the predicted hydrological characteristics to the historical flow data of each reservoir. Below are the method’s detailed steps and hypotheses.
A. Assume each simulation as an independent prediction
Altogether, the analysis of 21 IPCC’s GCMs for two RCPs scenarios resulted in 42 different simulations. As expected, the variety of possible futures confirmed the uncertain nature of GCMs. In the presented perspective, it is not a matter of quality, feasibility, or essence of each model’s product. Despite specificities, the main object is to use its results as a tool for a robust planning process.
By critically analyzing GCMs outcomes, the aim is to inspire and drive tactical decisions. In this direction, the major intention is no longer to predict future climate, but to work around its inherent uncertainty. Therefore, each one of the 42 resulted simulations is taken as independent predictions. As independent predictions, every potential scenario can possibly provide solid ground for further strategy developments, once one finds which arrangement better fits the analysis requirements.
B. Apart from absolute values, deal only with the predicted variation rates by each projection
Among the 42 projections, a diverse group of forthcoming situations emerged. Flow rate predicted values fluctuated considerably. Hence, to overcome inconsistencies and debatable numbers for a practical application there was no analysis of absolute values. Thus, at this stage, the analyst should focus on categorizing and evaluating only the predicted changes in flow rates according to each projection
Thereby, with simulations estimated for the past 30 and projected 50 future years, it was possible to ascertain how each climate projection was predicted to vary in matters of percentage. This step assumes that even though a random model could not estimate the past properly, starting from its prediction for what happened, it could consistently assess the expected changes for the future.
C. Analyze data per five classes of events defined by percentiles ranges
Characteristics of the region drove to an important part of the proposed method. To compile information and recognize relevant patterns, proper statistics routines should respect local data essence. Thus, in matters of regional flow series, its ranges are an extreme values distribution, being non-stationary and non-homogeneous. For that reason, classical hydrology methods do not apply.
Page 5 of 12
I. The Quantile Technique
Quantiles are values of a data series taken from regular gaps. The quantile order of each quantile is the associated probability of a given value of this series to be smaller than the set quantile (Xavier et al, 2002).
In mathematical terms, for p being the quantile order and Qp the respective
quantile, for a given random value X in the series: 𝑃𝑟𝑜𝑏 𝑋 ≤ 𝑄) = 𝑝
II. Analyzing hydrological events by classes
Pinkayan (1966) was one of the firsts to apply the quantile technique to analyze hydrological events. He defined quantiles order ranges to evaluate the conditional probability of occurrence of wet and dry years over a large continental area. The quantile intervals define the classes of events as follows: ′𝑣𝑒𝑟𝑦 𝑑𝑟𝑦1 → 𝑋 ≤ 𝑄 34% ′𝑑𝑟𝑦1 → 𝑄 34% < 𝑋 ≤ 𝑄74% ′𝑛𝑜𝑟𝑚𝑎𝑙′ → 𝑄74% < 𝑋 ≤ 𝑄<4% ′𝑤𝑒𝑡′ → 𝑄<4% < 𝑋 ≤ 𝑄?4% ′𝑣𝑒𝑟𝑦 𝑤𝑒𝑡′ → 𝑄?4%< 𝑋
That is, when precipitation in a given year was inferior to the quantile 15%, that was as a ‘very dry’ year. In other words, that volume of precipitation fell only in 15% of the observed years. Therefore, the study aimed dividing precipitation data among independent classes of events and thus mapping its behaviors and tendencies
III. Percentiles and the classes of events at the present study
As quantiles, percentiles are data values of a series taken at regular gaps, specific when in a base of 100. Through analyzing the flow data series by percentiles, it is possible to overcome bias due to extreme values, a local characteristic for flow series.
The quantile intervals here adopted were about the same. Despite this, it was necessary to make some adjustments to suit specific needs. As said before, the region concentrates massive quantities of rainfall between February and May, while on the rest of the year there is almost no precipitation. Therefore, when analyzing the whole flow series, expressed through monthly values, about half of the values are close to zero flow.
In this sense, for purposes of evaluation on the next steps, the new quantiles intervals that define the classes of flow rate events were:
Page 6 of 12 ′𝑣𝑒𝑟𝑦 𝑑𝑟𝑦1 → 𝑋 ≤ 𝑄 44% ′𝑑𝑟𝑦1 → 𝑄 44%< 𝑋 ≤ 𝑄<4% ′𝑛𝑜𝑟𝑚𝑎𝑙′ → 𝑄<4% < 𝑋 ≤ 𝑄?4% ′𝑤𝑒𝑡′ → 𝑄?4% < 𝑋 ≤ 𝑄@4% ′𝑣𝑒𝑟𝑦 𝑤𝑒𝑡′ → 𝑄@4%< 𝑋 ≤ 𝑀𝐴𝑋
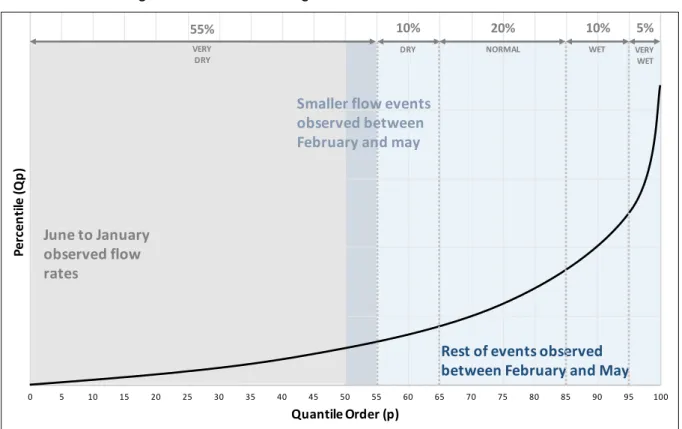
Figure 1 illustrates the above.
Figure 1 - Percentile ranges for the classes of flow events.
D. Map hydroclimate parameters
Considering the estimated past and the projected future of each one of the 42 simulations and its calculated percentiles, it is possible to see how each percentile varied through time. It is interesting to point out that the conducted analysis aims to capture especially the variations of the rainy period, given that water availability will depend mainly on this period.
Starting from the quantile intervals set in the prior step, mapping hydroclimate parameters per each class of event made it possible to distinguish every projection via its own features. To do so, three parameters set up the main characteristics that differentiate one scenario from another, presented next.
I. Flow rate intensity
The flow rate intensity shows how the magnitude of an event varied through time. Given that the quantile order setting the last value of each class defines 0 5 10 15 20 25 30 35 40 45 50 55 60 65 70 75 80 85 90 95 100 Pe rc en tile (Q p) Quantile Order (p) Rest of events observed between February and May 5% 10% 20% 10% 55% Smaller flow events observed between February and may June to January observed flow rates VERY
DRY DRY NORMAL VERYWET
Page 7 of 12
how the class behaved from past to future, the associated percentile evaluates how intensity in flow rates per class of event changes. Figure 2 illustrates it briefly.
Figure 2 - Variation of flow rate intensity.
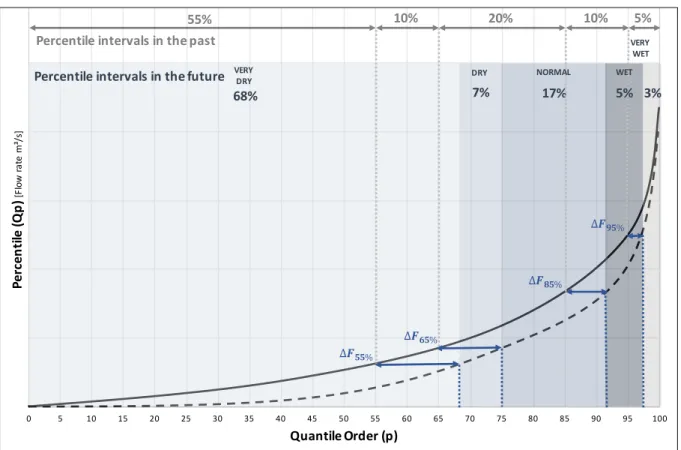
Therefore, if the variation rate of the percentile Q55% is rising, it means flow events classified in the past as ‘very dry’ are becoming more water-intense in the future. The events of this class will involve more water. On the other hand, for the percentile Q95%, if its variation rate is decreasing, the ‘wet’ events are less intense, which means these types of events will bring less water.
II. Frequency of events
The frequency of events allows us to analyze the variation on the number of events of each class. Hence, changes in the size of each quantile interval show how a given class behaved between past and future. To do so, the past flow series establishes which percentile will define each class. Next, these percentiles classify future flow values, framing it by what type of event they would be in the past in comparison with the events that happened. Figure 3 exemplifies the above.
0 5 10 15 20 25 30 35 40 45 50 55 60 65 70 75 80 85 90 95 100 Pe rc en tile (Q p) Quantile order (p) ("##%)&'() ("##%)*+)+,- ∆ ##% ∆"/#% (0'1)&'() 0'1 *+)+,-("/#%)&'() ("/#% )*+)+,-VERY DRY
DRY NORMAL VERY
WET WET
Estimated Past
Page 8 of 12
Figure 3 – Variation of events’ frequency.
The graph above shows that if, for example, the past percentile Q55% corresponds in the future to the percentile Q68%, the number of events ‘very dry’ got higher. Evaluating frequency is just a complementary analysis. By promoting a different standpoint over flow rate data, it is possible to reveal new aspects of it.
III. Drought and flooding distribution
The third set of parameters tries to capture natural phenomena of larger scales happening between one year and another. The difference between the rainy period and the rest of the year characterizes annual fluctuations. On the other hand, interannual variations relate to how a specific year performs when compared with the expected.
The amount of water falling during the rainy period of each year will define if the precipitation for that year was below or above the historical average. That means, if a sequence of years has many ‘very dry’ or ‘very wet’ flow events in its rainy season it can mean that more severe drought or flood events are taking place.
By identifying these types of phenomena, it is possible to have a picture of the extreme events potentially stressing the region. Rough droughts that last several years are the main problem to local water resources management. 0 5 10 15 20 25 30 35 40 45 50 55 60 65 70 75 80 85 90 95 100 Pe rc en tile (Q p) [Fl ow ra te m ³/ s] Quantile Order (p) VERY DRY DRY 55% 10% 20% 10% 5% 68% 7% 17% 3% Percentile intervals in the past Percentile intervals in the future ∆"##% ∆"%#% ∆"&#% ∆"'#% NORMAL WET 5% VERY WET
Page 9 of 12
E. Triage the models per majoritarian trend observed in each class of events among all projections
To reach a satisfactory final set of climate scenarios, considering its applicability for planning under uncertainty, each one of the selected scenarios must express policy-interesting contexts. In this sense, during the projections triage, hydrologic parameters analysis sought to show which tendencies were majoritarian.
Following the majoritarian trends, means to choose as representative the most commonly observed configurations between the projections. For the same reason, the scenarios of interest set as the ones possible and plausible of happening, are those shown by most models.
Therefore, using a generic approach, the analysis summarized tendencies among projections, outlining guidelines to the scenarios of interest. The tables below show the tendencies associated with perceived intensity and frequency variations.
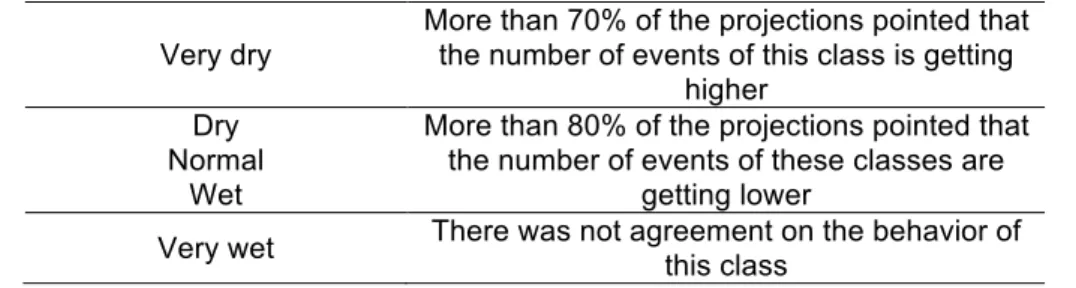
Table 1 - Majoritarian trends for flow rate intensity variation per class of event
Very dry More than 70% of the projections pointed the
events of these classes would become more dry
Dry Normal
Wet There was not agreement on the behavior of
these classes Very wet
Table 2 - Majoritarian trends of event frequency variation per class of event
Very dry
More than 70% of the projections pointed that the number of events of this class is getting
higher
Dry More than 80% of the projections pointed that
the number of events of these classes are getting lower
Normal Wet
Very wet There was not agreement on the behavior of this class F. Chose the proper projection taken as representative of each scenario of
interest
After recognizing the majoritarian trends among projections, the conducted analysis consisted in a non-linear evaluation based in different criteria. First, the process starts by eliminating flow rate intensity projections that did not cope well with the observed tendencies. The same task is then conducted for the events frequency variations, coming back and forth to find which ones were more consistent and coherent.
The concern here lies on keeping a relevant final sample of scenarios. The process is arbitrary and it must follow the purposes of who is conducting it. The 42 first projections were reduced to form a set of scenarios of interest, meaning that more than one projection contributed to form a single generic type of climate scenario.
Page 10 of 12
In the end, three scenarios emerged as a satisfactory ensemble of future configurations. The range between these scenarios was big enough to have the desired and relevant possible climate states. Associated with each scenario, were the respective projection and the GCM that originated it. Thereat, the selected GCMs, stood as representatives of the scenarios of interest, with the characteristics of the chosen scenarios, and became merely a channel to reproduce them.
G. Apply the variation rates predicted by the chosen GCMs on historic flow data producing the estimated future values
As said before, GCMs results were developed for the two largest reservoirs in the basin, serving as inputs for the process described above. To obtain flow rates scenarios for all 51 strategic reservoirs of the region, first it linear correlation analysis was conducted to relate them to the two biggest ones. Depending on which of the largest reservoirs the smallest ones would correlate better, these would receive the climate scenario projected for the first ones.
80% of the correlation factors were higher than 0.7 and the spatial distribution of correlated reservoirs was consistent. Finally, the historic flow rates data of each reservoir with the application of the variation rates and events distributions patterns of the chosen representative GCMs resulted on the final climate scenarios of flow rates. The scenarios consisted in monthly flow rates series for 50 years in the future distributed for each one of the 51 strategic reservoirs.
3. Results
The resulting scenarios characterizes as follows:
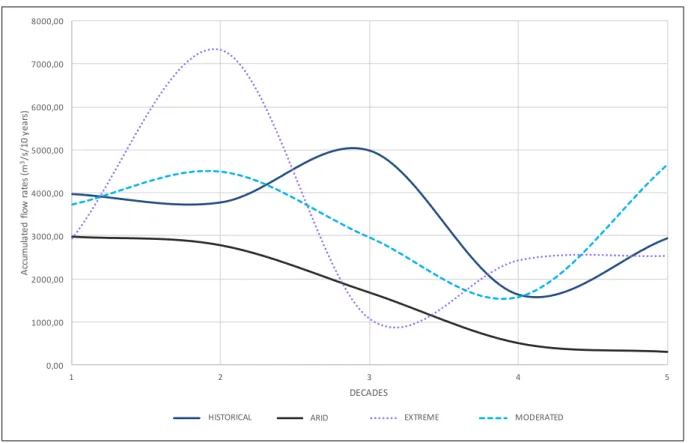
§ Moderate: this scenario represents a slightly variation when compared with the historical flow rates. On it, the water shortages are a more frequent and are involving a little less water.
§ Extreme: this scenario characterizes as the one where extreme weather events are getting worst. That is, both severe events of water shortage and high levels of concentrated-in-time precipitation are becoming more frequent and intense.
§ Arid: in this scenario, all flow rates events are bringing significantly less water to the reservoirs. The region is more frequently stricken by severe droughts. This is the wort-case scenario.
Besides these, a forth scenario, entitle Historical, taken to be the reference scenario, represents the projection in the future of the historical flow rates observed patterns. Figure 4 exemplifies how the flow rates fluctuates among each scenario throughout the considered period of time.
Page 11 of 12
Figure 4 – Fluctuation of the flow rates scenarios among the five considered decades.
4. Discussion
To embrace uncertainty does not mean to try and have a better prediction of the future, but to be better prepared for whatever the future might be. The process involving data acquisition, processing, and application of GCMs is still unclear and inaccessible to most decision-makers. Trying another approach and using the results of GCMs in a consistent way can open a completely new perspective for this field in the public policy dimension. In a changing climate, relying upon just one GCM might be inefficient in the public policy sphere.
5. References
ANA. Plano de recursos hídricos da bacia hidrográfica do rio Piranhas-Açu. Agência Nacional das Águas - ANA. Brasília, p. 345. 2016.
ANA. Estudo para Refinamento do Balanço Hídrico e Estabelecimento de Regras Operativas para 204 Reservatórios no Semiárido. Agência Nacional de Águas - ANA; ENGECORPS ENGENHARIA S.A. Brasília/São Paulo. On press.
FUNCEME. Análise dos Mudanças de Clima na Hidrologia dos Hidrossistemas Estudados nas Bacias dos Rios Jaguaribe e Piranhas-Açu - Projeto De Cooperação Técnica ANA-UFC Nº 003/2013. Agência Nacional das Águas - ANA/Fundação Cearence de Meteorologia e Recursos Hídricos - FUNCEME. Brasília/Ceará. On press. 0,00 1000,00 2000,00 3000,00 4000,00 5000,00 6000,00 7000,00 8000,00 1 2 3 4 5 Ac cu m ul at ed f lo w rat es (m 3/s /1 0 ye ar s) DECADES
Page 12 of 12
PINKAYAN, S. Conditional Probabilities of Occurrence of Wet and Dry Years Over a Large Continental Area. Hydrology Papers 12 Colorado State University, Fort Collins, Colorado, Abril 1966. 1 - 53.
QUAY, R. Anticipatory Governance: A Tool for Climate Change Adaptation. Journal of the American Planning Association v. 76, 2010. 496-511.
XAVIER, T. M. B. S.; SILVA, J. F.; REBELLO, E. R. G. A Técnica dos Quantis e suas aplicações em Meteorolgia, Climatologia e Hidrologia, com ênfase para as regiões brasileiras. Brasília: Thesaurus Editora de Brasília Ltda. 2002.