UNIVERSIDADE DO ALGARVE
Faculdade de Ciências e Tecnologia
R
UI
T
WOHIG
H
UGMAN
Faro, Setembro 2009
Transient-State Calibration of a Ground-Water
Flow Model and Simulation of Scenarios of
Development for the Almádena-Odeáxere Aquifer
System
Dissertação elaborada no âmbito do Mestrado Integrado em Engenharia do
Ambiente na área de Modelação Ambiental
UNIVERSIDADE DO ALGARVE
Faculdade de Ciências e Tecnologia
R
UI
T
WOHIG
H
UGMAN
Orientação: Dr. José Paulo P.G. Monteiro
Transient-State Calibration of a Ground-Water
Flow Model and Simulation of Scenarios of
Development for the Almádena-Odeáxere Aquifer
System
Dissertação elaborada no âmbito do Mestrado Integrado em Engenharia do
Ambiente na área de Modelação Ambiental
Faro, Setembro 2009
O conteúdo deste trabalho é da exclusiva responsabilidade do autor
i
Abstract
The Almádena-Odeáxere aquifer system is a free-to-confined karstic system and extends over an area of 63.5 km2, in the Algarve (southern Portugal). The aquifer’s two natural discharge areas are connected to two separate wetlands, which support environmentally important groundwater dependent ecosystems. Uncorroborated observations indicate that abstractions from municipal wells on the aquifer have led to a reduction in discharge in these areas.
Other authors have determined various hydroestratigraphic units of the Almádena-Odeáxere and the spatial distribution of the transmissivity parameter has been determined via inverse calibration techniques. The first section of the current work characterizes the spatial distribution of the storage coefficient in order to allow for the simulation of the aquifer’s hydraulic behaviour under transient state conditions.
The calibration of the storage coefficient was carried out by trial-and-error methods. The relatively small span of physically possible values of storage coefficient was not considered sufficient to justify the effort required to implement inverse calibration methods. Calibration results provided the first estimate on the regional distribution of storage coefficient values, which range from 0.05 to 0.125 over 5 zones, resulting in a greater reliability of the spatial and temporal evolution of state variables for transient simulations.
The calibrated model was tested against historical data to verify its accuracy and stability under stress conditions. Simulated temporal and spatial distribution of hydraulic heads and natural discharge flow show a good fit with observed data.
In the second section, hypothetical scenarios of water withdrawal from the municipal boreholes were simulated to evaluate the effects of abstractions on the regional flow system and on the natural groundwater discharge. Results show that abstractions have an immediate effect on groundwater discharge, and rates of 1.4x10⁴ m3/day are enough to reduce flow to zero at one of the discharge areas. However, to properly determine the maximum safe yield, a more detailed analysis of the importance of the groundwater component to the streams and wetlands associated to the AO is required.
Keywords: Numerical groundwater flow models; groundwater-surface water interactions; groundwater
ii
Resumo
O presente trabalho de investigação pretendeu caracterizar a distribuição espacial do coeficiente de armazenamento no sistema aquífero Almádena-Odeáxere (AO) através da calibração de um modelo numérico de elementos finitos, com o objectivo de aumentar a fiabilidade da simulação em regime transitório, do seu funcionamento hidráulico. Após a calibração e validação do modelo para a simulação do comportamento hidráulico do AO em regime transitório, procedeu-se à simulação e análise do impacto de vários cenários hipotéticos de exploração do sistema aquífero e assim, espera-se demonstrar a utilidade destes modelos como ferramentas para a gestão responsável destes recursos.
O sistema aquífero AO estende-se ao longo de 63.5 km2 nos Municípios de Lagos e Vila do Bispo, no Algarve, e encontra-se hidraulicamente ligado a vários corpos de água superficial que suportam ecossistemas vulneráveis. Os mais significantes dos quais, são as duas zonas húmidas que se encontram nas áreas de descarga natural do aquífero: (1) ao longo da ribeira de Bensafrim e (2) na Boca do Rio no canto SW do sistema aquífero. Dada a variabilidade sazonal da disponibilidade de água superficial e a natureza efémera das ribeiras associadas a estas zonas húmidas, a exploração deste sistema aquífero poderá ter efeitos sobre a disponibilidade de água para estes ecossistemas.
Durante o ultimo século o aquífero AO era a principal fonte de abastecimento de água para as cidades de Lagos e Vila do Bispo. Recentemente, em 1999 este, foi substituído como fonte de abastecimento público por um sistema suportado por fontes de água superficial (designadamente barragens). No entanto, as limitações desta estratégia, dependente de uma única fonte de abastecimento, tornaram-se evidentes durante a seca de 2004-2005 e iniciaram um movimento na direcção de integrar o uso de águas superficiais e subterrâneas na estratégia de gestão dos recursos hídricos. È portanto fundamental compreender os impactos que a exploração destes recursos subterrâneos poderão ter sobre os aquíferos e outros sistemas que deles dependem.
Foi implementado um modelo regional de elementos finitos de forma a investigar as relações quantitativas entre os dados históricos disponíveis sobre a exploração do aquífero, realizada pelas Câmaras Municipais e, as variáveis de estado resultantes da monitorização do AO (medições piezométricas e do caudal de fontes e ribeiras). Numa fase prévia, a distribuição espacial do parâmetro hidráulico transmissividade foi determinado para o AO usando métodos
iii de calibração inversa do modelo e integrando informação disponível no que concerne à geometria do sistema, às condições de fronteira, à cartografia geológica e aos dados hidrológicos relevantes.
De modo a permitir a simulação do comportamento hidráulico do AO em regime transitório, foi necessário proceder á caracterização da distribuição espacial do coeficiente de armazenamento. Comparado com o parâmetro transmissividade, o coeficiente de armazenamento considera uma gama de valores fisicamente possíveis bastante menor que a transmissividade, apresentando valores na ordem de 1x10⁻⁵ a 1x10⁻³ para aquíferos confinados e valores na ordem de 1x10⁻² até valores de porosidade total para aquíferos livres. Considerou-se que esta menor gama de valores a considerar não justificava o esforço e tempo necessários para a aplicação de métodos de calibração inversa em regime transitório. Assim, foi aplicado um método de tentativa e erro na calibração do modelo numérico para determinar a distribuição espacial do coeficiente de armazenamento.
Os resultados da calibração forneceram a primeira estimativa da distribuição regional do coeficiente de armazenamento, com valores entre 0.05 e 0.125 obtidos em cinco zonas, o que resultou numa maior fiabilidade na evolução espacial e temporal de variáveis de estado para simulações em regime transitório, quer em regimes naturais, quer considerando diferentes cenários de utilização do recurso de água.
Após esta calibração foi necessário proceder com a validação do modelo em regime transitório, o que contribuiu não só para averiguar a sua precisão e estabilidade mas também para a análise do impacto de vários cenários de exploração a que o aquífero foi exposto ao longo das últimas décadas. Estes cenários simulados do período entre 1997 e 2003 permitiram a análise do impacto das alterações significativas nas políticas de gestão dos recursos hídricos da região, não só a nível da dinâmica hidrogeológica numa escala regional mas também numa escala mais local nas áreas de descarga natural do sistema aquífero e as relações com as águas superficiais associadas. Os resultados obtidos mostraram um bom ajuste entre valores de potencial hidráulico e de descarga natural simulados e valores medidos no terreno.
Com o estado actual do modelo foi possível avançar com a simulação de vários cenários hipotéticos de exploração do aquífero a partir dos furos municipais existentes no AO de modo a determinar os seus potenciais impactos. Para a realização destas simulações tomou-se em conta a recarga calculada a partir de valores de precipitação de Setembro de 2003 a Setembro de 2006, um período que cobre uma das épocas mais secas em registo. Os regimes de
iv extracção considerados para cada simulação foram calculados com base no valor de capacidade de extracção máxima dos furos. Os caudais dos regimes foram variados entre 0% e 100%, em passos de 10%, da capacidade máxima de cada furo. Apesar destes regimes hipotéticos não serem representativos da variabilidade sazonal da procura de água, considera-se que repreconsidera-sentam casos de “pior cenário”.
Os resultados destas simulações de cenários hipotéticos demonstraram que a extracção de água subterrânea dos furos municipais tem um impacto significativo na dinâmica hidrogeológica regional e sobretudo nas zonas de descarga e subsequentemente sobre os corpos de água superficial associados, reduzindo a contribuição do aquífero para as ribeiras e zonas húmidas. De facto, as simulações sugerem que a descarga natural na zona das Portelas seria efectivamente nula com regimes de exploração que consideram apenas caudais de extracção de1.4x104 m3/dia (cerca de 35% da capacidade total dos furos municipais).
No entanto, para quantificar o impacto desta redução de descarga é necessário um estudo mais detalhado acerca da importância da componente de água subterrânea para o funcionamento destes corpos de água superficial e os seus ecossistemas associados.
Sugere-se que seja levada a cabo uma pesquisa futura que coordene modelos de escoamento de água subterrânea, modelos de água superficial e modelos ecológicos, de forma a optimizar os regimes de exploração do aquífero de forma a resultar no menor impacto possível sobre estes sistemas e os seus ecossistemas associados.
Em suma, espera-se que o presente trabalho consiga demonstrar a utilidade e importância destes modelos como ferramentas para uma gestão mais eficiente e racional dos recursos hídricos. Além disso, pretende-se que os conclusões apresentadas reforcem a possibilidade da gestão de reservas de água subterrânea do sistema aquífero AO poder vir a ser efectuada utilizando este tipo de modelos.
Palavras-Chave: Modelos numéricos de escoamento subterrâneo; interacções águas
superficiais-subterrâneas; ecossistemas dependentes de água subterrânea; calibração em regime transitório; gestão de recursos hídricos subterrâneos.
v
Acknowledgments
First and foremost I would like to extend my gratitude to José Paulo Monteiro for the technical and scientific advice which was essential to the development of this and other works, and who’s never ending energy and support have been fundamental to my evolution and inspiration as a student and future professional.
I am very grateful to João Martins for his assistance and time in helping me find my footing at the beginning of this work, and extend my heart-felt sorrow to him for his recent loss.
Thank you to my friends and colleagues who put up with me over the last few years and which, each in their own way, contributed to the conclusion of this work.
And last, but far from least, a huge thank you to my family and girlfriend for their patience, financial and emotional support without which I never would have gotten to be where I am today.
vi
Index
Abstract...i Resumo ...ii Acknowledgments...v Index... viList of Figures ... vii
List of Tables ... ix
1. Introduction ... 2
1.1. Scope and Purpose ... 3
1.2. Numerical Ground Water Flow Modeling in Karst Aquifers... 4
2. Hydrogeological Setting... 7
2.1. Location and Geological Setting ... 7
2.2. Precipitation... 9
2.3. Water Budget...11
2.3.1. Ground-Water Recharge...11
2.3.2. Natural Discharge ...12
2.3.3. Ground-Water Withdrawals...13
2.4. Spatial and Temporal Evolution of Hydraulic Head ...17
2.5. Stream Network and Surface Water flow ...20
2.6. Wetlands...22
3. Numerical Modelling Method ...25
4. Ground-Water Flow Model ...28
4.1. Conceptual Model...28
4.2. Numerical Model...28
vii
4.2.2. Simulation of Transient Ground-Water Recharge...29
4.2.3. Boundary Conditions...31
4.2.4. Previously Calibrated Hydraulic Parameter: Transmissivity...31
4.3. Transient State Calibration: Storage Coefficient...33
4.3.1. Calibration Process...34
4.3.2. Calibration Results...35
4.4. Model Verification ...37
4.4.1. Temporal Evolution of Hydraulic Heads ...38
4.4.2. Natural Discharge ...42
4.5. Remarks on Model Limitations...44
5. Simulated Effects of Hypothetical Ground Water Withdrawals...46
5.1. Hypothetical Scenarios ...46
5.2. Results...48
6. Final Remarks ...52
7. References...54
List of Figures
Figure 1 - Geographic location of the Almádena-Odeáxere aquifer system. Adapted from Martins (2007)... 7Figure 2 - Lithologies supporting the AO and its’ geometric boundaries; Adapted from: Almeida et al. (2000)... 8
Figure 3 - Geological cross section between Bensafrim and Lagos. Adapted from Reis (1993) . 9 Figure 4 – Yearly precipitation values registered at the Lagos gauge from 1902 to 2005. Source SNIRH (2009). ...10
Figure 5 – Geological setting and main discharge areas of AO. Adapted from Vieira and Monteiro (2003)...12
Figure 6 – Spring hydrographs for the Portelas (vala) and Sargaçal springs from January 2005 to June 2006. ...13
viii Figure 7– Location of the main public supply boreholes in use from 1989 to 2005. ...14 Figure 8 - Yearly extracted volumes from the main public water supply boreholes on the AO from 1989 to 2005...15 Figure 9 – Location of the Piezometric observation points and piezometric map of the AO (doted lines). Red dots represent data provided by CCDRA, Blue dots represent data supplied by “POCTI/AMB/57432/2004” research project. Thick black lines represent the aquifer systems main discharge areas...17 Figure 10 – Historical data on hydraulic heads obtained from piezometers with the longest time series of data (data obtained from SNIRH, 2009)...19 Figure 11 – Main streams (dotted blue lines) and hydrometric stations and monitored springs (red crosses) on the Almádena-Odeáxere aquifer system...21 Figure 12 – Stream hydrographs measured at the Portelas-Bensafrim gauge (blue line) and Almádena gauge (red line) compared to precipitation registered at the Lagos gauge (31E/01UC); Almádena gauge was inoperative during part of 2005. ...22 Figure 13 - Finite element mesh based on the geometry of the Almádena-Odeáxere aquifer system. ...29 Figure 14 - Illustrated example of the transient recharge input method based on measured precipitation values of a typical precipitation episode. Adapted from Martins and Monteiro, (2008b). ...30 Figure 15 – Imposed potentials (thick black lines) along the known natural discharge areas and stream network (dotted blue lines). ...31 Figure 16 – Spatial distribution of T values for each of the 16 predefined zones obtained using inverse calibration. Adapted from Martins (2007). ...32 Figure 17 – Location of the selected observation points and proposed areas of constant storage coefficient...34 Figure 18 – Comparison between corrected and non-corrected simulation results and their similarity to measured values for observation point AO-08...36 Figure 19 – Proposed spatial distribution of storage coefficient...37 Figure 20 – Location of piezometric observation points with data from January 1997 until December 2003 (black crosses) and boreholes for public water supply (red crosses)...39 Figure 21 - Measured (dotted line) and simulated (continuous line) hydraulic heads for the period between January 1997 and December 2003. ...40 Figure 22 – Measured (dotted line) and simulated (continuous line) hydraulic heads for the period between January 1997 and December 2003. ...41 Figure 23 – Flow rates measured at the two springs [Sargaçal and Portelas (vala)] and simulated discharge at the Portelas natural discharge area (top); measured flow rates at the Sargaçal spring and displaced plot of simulated discharge at Portelas (bottom). ...43 Figure 24 – Plot of discharge rates at the two natural discharge areas (blue crosses for Portelas and red crosses for Boca do Rio) versus total pumping rate. ...50
ix Figure 25 – Examples of simulated discharge at the natural discharge areas (Portelas top and Boca do Rio bottom); discharge under natural (SIM0, blue lines) and under pumping conditions (SIM3 and 11, black lines)...51
List of Tables
Table 1– Water budget and estimation of withdrawal/recharge ratio for the AO considering average annual precipitation and pumping data from 1989 to 2005. ...16 Table 2 – Piezometric data observation points. Ref. CCDR (reference number used by the CCDRA on their monitoring networks). Ref. UALG (reference number used by the University of the Algarve on their monitoring network)...18 Table 3 – Values of RMSE for the best spatial distribution of storage coefficient...36 Table 4 – Temporal distribution of available data series relative to the AO...38 Table 5 – Values of RMSE obtained for the simulated ground water levels between January 1997 and December 2003...39 Table 6 – Hypothetical ground water withdrawal scenarios and their respective pumping rates based on percentages of the maximum yield for each borehole; *Almádena well-field; **Portelas well-field...47 Table 7 – Pumping rates based on historical data for hypothetical ground water withdrawal Scenario 12...47 Table 8 – Lowest registered flow rates at the natural discharge areas for hypothetical ground water withdrawal scenarios. ...49
2
1. Introduction
The Almádena-Odeáxere aquifer system (hereafter known as AO) extends over a 63.5 km2 area, across the Lagos and Vila do Bispo municipalities (Almeida et al., 2000) in the southern region of Portugal, Algarve. Up until the end of the 20th century it was the main source of public water supply for these municipalities, and records show that it was the main source of supply for the city of Lagos as far back as the year 1521 (Paradela, 1959).
In 1999 a multi-municipal water supply system entirely dependent on surface water provided by large reservoirs was implemented, leading to the abandonment of the AO (and other aquifer systems in the region) as sources of public water supply. The extreme drought of 2004-2005 brought to light the serious limitations of this single-source strategy when several reservoirs reached their limit and could not satisfy water demand (Nunes et al., 2006b).
It is likely that in the near future, a water management approach that integrates the use of surface and groundwater in order to guarantee public water supply will be put into practice (Martins, 2007). However, in order to do so in a responsible manner, it is necessary to understand the implications of extracting water from these aquifer systems. In the particular case of the AO, it is known that there are several surface water bodies which are hydraulically connected to the aquifer system, namely two wetlands located at the aquifer system’s main natural discharge areas (Almeida et al., 2000). It is important to understand the effects of extracting water on the regional groundwater flow patterns in order to protect these vital groundwater dependent ecosystems.
Many aquatic ecosystems which are classified as surface water bodies are partially or wholly dependent on interactions with groundwater to sustain ecological structure and function. This includes springs, wetlands, karst and cave systems, rivers and estuaries with a strong baseflow component especially in the dry season. In the case of the AO, the two wetlands known as the Paul da Abedoeira and the Boca do Rio.
Quite often, the interaction between groundwater and surface water is not adequately quantified. This may be because the interaction is complex and difficult to measure, or it may be simply because people haven’t considered that the interaction might be important and so don’t give it sufficient attention in their research or field measurement programmes. Another reason why the interaction is poorly understood is because groundwater and surface water hydrologists have generally worked separately in the past. Hydrological models have often been developed
3 independently, with a resulting mismatch in scale and resolution (both temporal and spatial) between surface water and groundwater models, and often substantial inaccuracies in estimates of the groundwater contribution to surface water flow, or the surface water recharge to groundwater. Groundwater and surface water hydrologists tend to use different terminology, leading to confusion when trying to build integrated conceptual models.
Poor or inadequate quantification of the groundwater-surface water interaction means that management decisions (for example the abstraction of groundwater in the riparian zone of rivers) may be made without sufficient information on the potential impacts on aquatic ecosystems.
The issue of groundwater interactions with aquatic ecosystems is becoming the subject of increasing attention, as the body of research into determination of the water requirements of ecosystems grows, and as more emphasis is placed on integrated water resource management.
1.1. Scope and Purpose
Numeric flow models are fundamental in analyzing the accuracy of hypothetical explanations for an aquifer’s hydraulic behaviour, and at a later stage in predicting the effects of changes in natural conditions or due to anthropogenic activities likely to interfere with groundwater flow (Monteiro and Silva, 1998). The use of numerical models in describing the hydraulic behaviour of aquifer systems is one of the most advanced methods for understanding events controlling water flow and contaminant transport in the subsoil, and therefore is an invaluable tool for water management (Martins, 2007). According to Monteiro et al. (2002), these models can be fundamental in answering questions such as: (1) Where and how much water can safely be extracted for public water supply; (2) What the effects of certain extraction scenarios will be on regional piezometric levels; (3) The importance of the extracted volume when compared to the aquifer system’s water budget; (4) What influence various exploitation scenarios will have on the intensification of undesirable phenomena. Considering that the AO is hydraulically connected to surface water bodies which are home to sensitive ground water dependant ecosystems, such as wetlands, understanding the effects of water withdrawals on this system could be fundamental in protecting them.
Over the last few years researchers at the University of the Algarve have developed various models to simulate the AO within the framework of the study of regional groundwater flow of
4 aquifers in the Algarve. These efforts have lead to the construction of the numerical model on which the work undertaken during this thesis is based. In this fashion, the presented research represents the next step in an ongoing body of work in the development of a potentially invaluable tool to ground water research and management alike.
The methodology for the development of numeric models can be summarized in four basic steps: (1) Analysis and description of conceptual models; (2) Calibration; (3) Validation; (4) Predicting possible future scenarios. Step (1), (2) and (3) have been completed for the physical distribution of the hydraulic parameter transmissivity under steady-state conditions for the case of AOs numeric flow model. To perform simulations under transient conditions a second calibration, of the storage coefficient parameter, is required. And subsequently, in order to guarantee the applicability of this model to simulating ground water flow under transient conditions it is necessary to validate it by comparing its results, under various stress conditions, with field data so as to allow for the next step, the simulation of hypothetical scenarios.
The proposed research intends to demonstrate the potential impacts of certain water extraction scenarios on the Almádena-Odeáxere aquifer system and water bodies to which it is connected, and hopefully demonstrate the value of these models as a tool for water management schemes which incorporate ground water as a source of supply.
1.2. Numerical Ground Water Flow Modeling in Karst Aquifers
The lithological support of the AO consists of carbonate rocks, therefore it is important to refer to some of the particular aspects related to modelling ground water flow in this kind of media. Numerical groundwater models are amongst the most important tools available for the management of groundwater resources. The models can be used to test or refine different conceptual models, estimate hydraulic parameters, and, most importantly for water-resource management, predict how an aquifer might respond to changes in pumping and climate change (Scanlon et al., 2003).
Numerous models have been successfully developed for porous aquifers; however their application in karst aquifers has been more problematic. Karst aquifers are generally highly heterogeneous, being dominated by secondary (fracture) or tertiary (conduit) porosity and may exhibit hierarchical permeability structure or flow paths (Scanlon et al., 2003). The major difficulty faced is that karst aquifers typically exhibit dual groundwater flow regimes, that is, fast (conduit-dominated) flow and slow (diffuse) flow (TaylorandGreene, 2001), and therefore are
5 likely to have a turbulent flow component, which may be problematic since most numerical models are based on Darcy’s law, which assumes laminar flow (Scanlon et al., 2003)
At present, great difficulties exist in accurately simulating karst flow systems at the local or sub regional scale because of the difficulty in developing numerical models that realistically represent boundary conditions for conduit networks. Nevertheless, according to Taylor and Greene (2001), numerical models are among the best quantitative tools for gaining a better understanding of the functioning of individual karst hydrology components and for predicting how the system works as a whole. However, as stated by Quinlan et al. (1996): “Although modeling of karstic processes is often possible and numerical flow models can sometimes simulate hydraulic heads, groundwater fluxes, and spring discharge, they often fail to correctly predict such fundamental information as flow direction, destination, and velocity.” Therefore, when discussing the relevance of numerical modeling in a karst aquifer, it is crucial to identify what type of model (i.e. flow model or transport model) is being proposed (Scanlon et al., 2003). It is important to consider the various modeling approaches available for simulating groundwater flow and contaminant transport in karst aquifers and to be aware of the advantages and limitations of each approach. According to Scanlon et al. (2003), one of the simplest approaches is the lumped parameter model, which has also been termed black box or mixing cell model. The spatial dimension in the equations is omitted in these models; therefore, only ordinary linear differential equations must be solved. The system is assumed to behave like an equivalent porous medium. These models generally result in good agreement between measured and simulated spring discharge (Yurtsever and Payne, 1986; Wanakule and Anaya, 1993; Barrett and Charbeneau, 1996; Zhang et al., 1996). The advantages of using lumped parameter models are that data requirements are minimal and simulations are rapid. The main disadvantage is lack of information on spatial variability in hydraulic head and directions and rates of groundwater flow (Scanlon et al., 2003).
Distributed parameter models are required to obtain detailed information on spatial variability in groundwater flow (Scanlon et al., 2003). Equivalent porous media distributed parameter models include single continuum and double continuum approaches. Single continuum models have generally been applied to aquifers characterized as predominantly diffuse (Teutsch, 1993), and some studies have found this approach to be inadequate for simulating regional flow in highly karstified aquifers (Teutsch, 1993; Keeler and Zhang, 1997). However, although accurate simulation of transport processes is still problematic, certain single continuum models have
6 proved adequate for simulating regional groundwater flow (Ryder, 1985; Kuniansky, 1993; Teutsch, 1993; Angelini and Dragoni, 1997; Keeler and Zhang, 1997; Greene et al., 1999 and Larocque et al., 1999); and Scanlon et al. (2003) suggest that this modeling approach is acceptable for the simulation of systems in which the conduit networks are fairly uniformly distributed and well interconnected.
According to Monteiro (2001), double continuum and discrete continuum modeling approaches allow for a more realistic description of flow processes in carbonate aquifers, in which the regional flow pattern is strongly influenced by the conduit network. However, these methods are not commonly applied in hydrogeology outside of research and academic circles, mainly due to the large data requirements needed to describe karstic systems (Scanlon et al., 2003).
Although a discrete continuum model would be the most adequate to simulate this karstic aquifers’ hydraulic behaviour, there is currently insufficient data to develop such a model. However, as will be discussed in more detail in a subsequent chapter, the fact that regional piezometry of the AO is characterized by low gradients denotes the existence of a well developed conduit network controlling flow at a regional level. And therefore a single continuum model should be sufficient for the task as long as it’s’ limitations are appreciated and respected.
7
2. Hydrogeological Setting
2.1. Location and Geological Setting
The Almádena-Odeáxere aquifer system (hereafter known as the AO) is located to the west of the river Arade, between the towns of Odeáxere (to the east) and Almádena (to the west) as can be seen in Figure 1. It encompasses the Lagos and Vila do Bispo municipalities in the Algarve, the southernmost region of Portugal and extends over an area of 63.5 km2 (Almeida et al., 2000).
Figure 1 - Geographic location of the Almádena-Odeáxere aquifer system. From Martins (2007)
The aquifer system is a free-to-confined karstic system, which occurs in carbonate Lias-Dogger outcrops and stretches in a NE-SW direction (Almeida et al., 2000). The dominant lithologies in which it occurs are limestone, dolomite limestone and dolomite rock with thicknesses between
8 60m and 1000m, and which appear in certain places as a well developed karst (Almeida et al., 2000). These formations are covered in some places by Faro-Quarteira sands and gravels, as well as alluvial deposits associated with the Almádena and Bensafrim streams. The distribution of these lithologies, as well as the geographic boundaries of the AO can be seen in Figure 2.
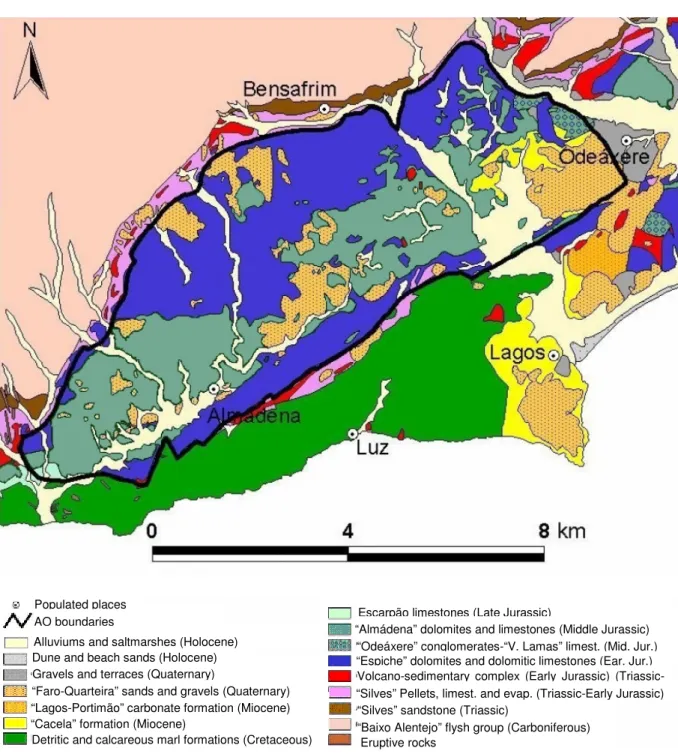
Figure 2 - Lithologies supporting the AO and its’ geometric boundaries; From: Almeida et al. (2000) Detritic and calcareous marl formations (Cretaceous)
“Cacela” formation (Miocene)
“Lagos-Portimão” carbonate formation (Miocene)
Eruptive rocks
“Baixo Alentejo” flysh group (Carboniferous) “Silves” sandstone (Triassic)
“Silves” Pellets, limest. and evap. (Triassic-Early Jurassic) Volcano-sedimentary complex (Early Jurassic) (Triassic-“Espiche” dolomites and dolomitic limestones (Ear. Jur.) AO boundaries
“Faro-Quarteira” sands and gravels (Quaternary) Gravels and terraces (Quaternary)
Dune and beach sands (Holocene) Alluviums and saltmarshes (Holocene) Populated places
“Odeáxere” conglomerates-“V. Lamas” limest. (Mid. Jur.) “Almádena” dolomites and limestones (Middle Jurassic) Escarpão limestones (Late Jurassic)
9 As can be seen in Figure 3, the aquifer formations present a synclinal structure, with a NE-SW direction, compressed between the Barão de S. João fault to the northwest, and the Espiche fault to the southeast (Reis, 1993).
Figure 3 - Geological cross section between Bensafrim and Lagos. From Reis (1993)
2.2. Precipitation
Precipitation is the main source of recharge for the AO aquifer system. Daily precipitation values for the Lagos gauge (31E/01UC), the closest gauge to the AO, can be obtained for as far back as 1902 up to the present day from the SNIRH (National Service of Information on Water resources) (SNIRH, 2009). As can be seen in Figure 4, yearly precipitation values range from 203.8 mm (2004/05) to 1035.9 mm (1989/90), with a pattern of alternating dry and wet periods every 2 to 5 years.
10 1900 1910 1920 1930 1940 1950 1960 1970 1980 1990 2000 Date 0 200 400 600 800 1000 1200 P re ci pi ta tio n (m m )
Figure 4 – Yearly precipitation values registered at the Lagos gauge from 1902 to 2005. Source SNIRH (2009).
Precipitation is distributed throughout the year as expected for a Mediterranean climate, mainly occurring between October and April. The remaining summer months are mostly dry and hot. Nicolau (2002), estimated the average precipitation occurring in the area of the AO to be 650 mm/year, based on the 1959/60 to 1991/91 period. This value was obtained using an orthogonal grid of 1 km x 1km calculated by the Kriging method and using elevation as an
11 external drift. This method has proven to be the most suitable for the characterization of physiographic factors affecting the spatial distribution of rainfall in Portugal (Nicolau, 2002).
2.3. Water Budget
2.3.1. Ground-Water Recharge
The two main sources of recharge for the AO occur through direct infiltration over the entire area of the aquifer system and through indirect infiltration from water in the streams that cross it (Reis, 1993).
The first estimates of recharge in the AO area were undertaken by Reis (1993). For the areas where carbonate rocks are covered by sedimentary deposits, she estimated the recharge to be between 28.9% and 35.6% of the precipitation from 1955 to 1985 based on calculations of evapotranspiration and varying field capacity values. In areas with outcrops of carbonated rock, the percentage of precipitation that corresponds to recharge was calculated based on the Kessler method for values from the Lagos gauge between 1960 and 1985, and range from 44.4% to 83.4%.
In a more recent report, Almeida et al. (2000) estimated the recharge rate between 40% and 60% of the yearly precipitation. Given the aquifers area of 63.5 km2, this would result in an estimated renewable resource of between 16x106 m3/year and 24x106 m3/year. It is of note that these values do not take into consideration the effect of indirect infiltration from streams crossing the system, which may include a significant amount of runoff generated upstream from the aquifer area.
Vieira and Monteiro (2003) proposed an average recharge of 40.3% of the precipitation over the entire 63.5km2 of the aquifer system. This value was obtained from the weighted average, taking into account the presence of sub-areas in which the recharge rates vary between 5% and 50% depending on the lithology which outcrops in that sub-area. This average recharge value is within the range proposed by Almeida et al. (2000), and corresponds to an average annual recharge of 16.6x10⁶ m3/year. As will be discussed further on (chapter 4.2.2) these average values of annual recharge were applied to the individual recharge episodes during the considered climacteric data series, in order to estimate the transient recharge to be incorporated in the model.
12 2.3.2. Natural Discharge
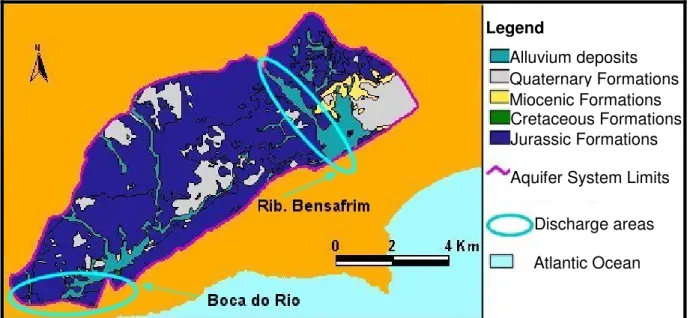
The main natural discharges areas, which can be seen in Figure 5, are located near Portelas on the Bensafrim stream, which forms the main drainage axis of the AO system; with a second, diffuse natural discharge area located at the SW point of the system, which feeds a wetland area (Almeida et al., 2000).
Figure 5 – Geological setting and main discharge areas of AO. From Vieira and Monteiro (2003).
The Portelas (Vala) gauge monitored the flow in a drainage system which collects the water from some of the springs at Portelas, one of the natural discharge areas. These springs dried up while the boreholes in the area were in use, however flow has restarted since 2000 (Reis, 2007). Between January and September 2005, the total flow registered was 290608 m3, and 429667 m3 for the hydrological year of 2005/06.
On the east bank of the Bensafrim stream at Sargaçal, the ground water level is very close to the surface, sometimes causing flooding during winters with heavy rainfall (Reis, 2007). There are various springs which are collected by a drainage system. Between January and September 2005 the total flow registered for these springs was 598646 m3 and 1141356 m3 for the hydrological year of 2005/06.
According to Reis (2007) when water was being extracted for the city of Lagos from boreholes in the vicinity of Portelas these springs dried up, however since they were taken out of service in the year 2000 the springs have become active once more. This was confirmed by the simulations, as will be shown further on (chapter 5.2), as the simulation of the maximum
Jurassic Formations Cretaceous Formations Miocenic Formations Quaternary Formations
Aquifer System Limits
Discharge areas Atlantic Ocean Legend
13 pumping capacity installed in the boreholes provokes an inversion of the gradient between the aquifer and the Bensafrim stream, with the consequent interruption of the baseflow in this watercourse. Reis (2007) notes that the influence of periodic water extraction for public water supply has a noticeable effect on the springs flow as can be seen during the summer of 2005 on the spring hydrographs in Figure 6. For the other main discharge area, along the Boca do Rio, there is currently no available data, due to difficulties in installing sensors in this area (Reis, 2007). 2/17/05 9/5/05 3/24/06 Date 0 20 00 40 00 60 00 80 00 10 00 0 F lo w R at e (m 3/d ay ) Portelas (Vala) Sargaçal
Figure 6 – Spring hydrographs for the Portelas (vala) and Sargaçal springs from January 2005 to June 2006.
2.3.3. Ground-Water Withdrawals
The use of the AO aquifer system as a source of urban water supply goes as far back as the year 1521. At that time, a spring at Paul da Abedoeira (also known as the Paul de Lagos) on the right bank of the Bensafrim stream, from which water was brought by gravity, was the sole source of water supplying the city of Lagos and remained so until the 1960’s (Paradela, 1959). In the early 1960s, due to the increased demand for water created by the rise in tourism, three well-fields were drilled in the proximity of springs in the area to the north of Lagos. Most of the boreholes were not particularly deep, with depths in the range of 21m to 39m. Registered flow rates were generally in the 20-30 l/s range; however two boreholes in one of the well-fields had
14 flows of 95 l/s and 100 l/s (Paradela, 1959). Slightly earlier, in 1957, the municipality of Vila do Bispo was already supplied by a single borehole in the vicinity of the town of Almádena (Paradela, 1959). The location of the main boreholes extracting from the AO used for public water supply can be seen in Figure 7.
LF8 LF6 LF5 LF2 LF1-VB FD3 JK8 LF0-VB LF1 m 0 20000 40000 60000 80000
Figure 7– Location of the main public supply boreholes in use from 1989 to 2005.
Until 1999 the AO was the main source for the public water supply of the municipalities of Lagos and Vila do Bispo, but after the Algarve multi-municipal water supply system was implemented, withdrawals from the AO diminished dramatically. Currently this aquifer system is held as a strategic reserve for use in case of a disruption to the municipal water supply as happened recently during the 2004/2005 drought. There is, however, a strong possibility that some of the existing boreholes could be used in the future in an integrated public water supply management scheme (Martins, 2007).
Data on the volume of water extracted per month from the eight main public water supply boreholes during the last decade was gathered from the Municipal Councils in the scope of the OPTEXPLOR project (Nunes et al, 2006b). As can be seen in Figure 8, the data shows a steady increase in the number of boreholes in use as well as in the total extracted volume
15 during the last few years prior to the implementation of the multi-municipal water supply system, peaking in the year 1999 and then the subsequent dip in 2000. As is to be expected the highest registered extractions occurred during tourist season.
Figure 8 - Yearly extracted volumes from the main public water supply boreholes on the AO from 1989 to 2005.
An inventory of extractions for irrigation and private supply, produced by the “Direcção Regional do Ambiente e Ordenamento do Terriotório” (DRAOT) Algarve and which covered approximately half of the known extraction points, indicates that these extractions are responsible for approximately 1.3x10⁶ m3/year. Almeida et al. (2000) considered it safe to assume that therefore, the total of ground-water withdrawals for private supply and irrigation to be approximately 2.6x10⁶ m3/year.
Indirect methods, such as remote sensing, should be applied to better estimate these values based on the area of irrigated land such as already been done for the Querença-Silves aquifer system in this region (Nunes et al., 2006a)
16
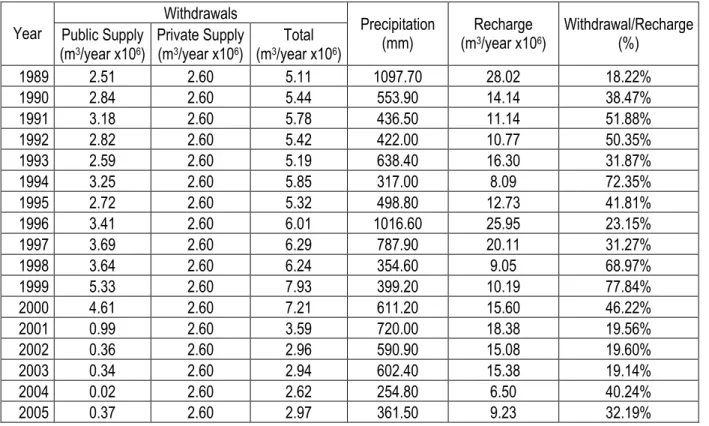
Table 1– Water budget and estimation of withdrawal/recharge ratio for the AO considering average annual precipitation and pumping data from 1989 to 2005.
Withdrawals Year Public Supply
(m3/year x106) Private Supply (m3/year x106) Total (m3/year x106) Precipitation (mm) Recharge (m3/year x106) Withdrawal/Recharge (%) 1989 2.51 2.60 5.11 1097.70 28.02 18.22% 1990 2.84 2.60 5.44 553.90 14.14 38.47% 1991 3.18 2.60 5.78 436.50 11.14 51.88% 1992 2.82 2.60 5.42 422.00 10.77 50.35% 1993 2.59 2.60 5.19 638.40 16.30 31.87% 1994 3.25 2.60 5.85 317.00 8.09 72.35% 1995 2.72 2.60 5.32 498.80 12.73 41.81% 1996 3.41 2.60 6.01 1016.60 25.95 23.15% 1997 3.69 2.60 6.29 787.90 20.11 31.27% 1998 3.64 2.60 6.24 354.60 9.05 68.97% 1999 5.33 2.60 7.93 399.20 10.19 77.84% 2000 4.61 2.60 7.21 611.20 15.60 46.22% 2001 0.99 2.60 3.59 720.00 18.38 19.56% 2002 0.36 2.60 2.96 590.90 15.08 19.60% 2003 0.34 2.60 2.94 602.40 15.38 19.14% 2004 0.02 2.60 2.62 254.80 6.50 40.24% 2005 0.37 2.60 2.97 361.50 9.23 32.19%
The estimates presented in Table 1 indicate that a deficit in the water balance between inflow and outflow from the aquifer system has yet to occur. However it is likely that, if groundwater had continued to be the main source of public water supply up to the year 2005, the withdrawal/recharge ratio would have come close to reaching, or even surpassing 100%. The consequences of such a scenario would not necessarily have been drastic on the availability of water at a regional scale due to the high regulatory capacity of the aquifer system, however there is no indication of what effects these abstraction ratios would have at a local scale or on the quality of the water due to the lessening of the dilution effect. These estimates show that water management should take into account the high climate variability of the region, and not be based merely on values of average yearly budgets as has been the case for most management practices of ground-water resources.
17 2.4. Spatial and Temporal Evolution of Hydraulic Head
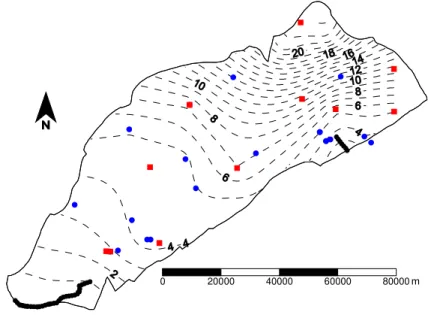
Historical data used to characterize the spatial distribution and temporal evolution of ground-water levels in the AO aquifer system were obtained from the observation points shown in Figure 9. The interpretation of this data allows us to define the predominant directions of ground-water flow which forms the basis of the conceptual model of the aquifer system.
Part of this data consists of historical data collected by the CCDRA (Commission for the Coordination and Development of the Algarve), and is publicly available from the SNIRH website (SNIRH, 2009). This set of data is available, for some observation points, as far back as 1978 up to the present day. However, the spatial distribution of the observation points is insufficient to properly characterize the hydraulic behaviour of the aquifer (Martins, 2007). Piezometric data from automatic monitoring of ten observation points between March of 2007 and July 2007 was obtained, and is also available online as part of the “Groundwater Flow Modelling and Optimization of Groundwater Monitoring Networks at the Regional Scale in Coastal Aquifers” research project undertaken at the University of the Algarve and funded by the Science and Technology Foundation “POCTI/AMB/57432/2004” (Martins and Monteiro, 2008a).
m 0 20000 40000 60000 80000
Figure 9 – Location of the Piezometric observation points and piezometric map of the AO (doted lines). Red dots represent data provided by CCDRA, Blue dots represent data supplied by “POCTI/AMB/57432/2004” research
18
project. Thick black lines represent the aquifer systems main discharge areas.
Table 2 – Piezometric data observation points. Ref. CCDR (reference number used by the CCDRA on their monitoring networks). Ref. UALG (reference number used by the University of the Algarve on their monitoring network).
Ref. UALG Ref. CCDR M P Coordinate Max. Min. Average Amplitude 593/5 149150 22050 22.73 18.48 19.79 4.25 - 594/400 152345 20470 4.10 1.77 3.15 2.33 - 602/32 142640 14260 7.68 1.56 5.64 6.12 - 602/36 142500 14270 7.65 1.09 4.52 6.56 - 602/43 144320 14550 6.12 1.75 3.86 4.37 - 602/76 149200 19450 8.53 0.88 3.89 9.05 AO-02 602/178 145350 19250 7.23 2.51 5.45 4.72 - 602/187 150350 19100 5.33 1.13 3.11 4.20 - 602/242 146980 17100 6.98 1.86 4.67 5.12 - 602/311 144000 17130 7.31 1.48 4.53 5.83 - 603/38 152350 19020 5.00 0.25 2.56 4.75 - 602/9 144016 14667 4.27 3.30 3.90 0.97 - 602/10 143898 14670 4.57 3.72 4.24 0.85 - 602/78 151336 18176 3.95 -0.28 1.93 4.23 - 602/4 150021 18019 5.76 3.92 5.03 1.84 - 602/5 150038 18028 5.89 3.76 5.19 2.13 AO-13 602/6 149814 18328 5.27 4.10 5.04 1.17 - 602/8 149810 18328 5.27 4.11 4.58 1.16 AO-08 - 143286 18416 5.14 4.10 4.77 1.04 AO-09 602/79 151565 17965 0.85 0.45 0.65 0.40 AO-17 602/112 143376 15328 8.54 4.36 5.7 4.18 AO-19 - 142900 14298 5.09 4.52 4.82 0.57 AO-20 - 141418 15851 5.16 4.24 5.03 0.92 AO-21 - 147622 17601 3.95 3.44 3.66 0.51 AO-22 - 146846 20185 4.55 4.11 4.23 0.44 AO-23 - 150524 20210 5.33 3.34 3.88 1.99
The interpretation of the data in Table 2 and in Figure 9 shows that the hydraulic gradients are relatively low across most of the aquifer system except for in the north-eastern corner, and
19 regional flow occurs predominantly from NE (recharge area) to SW (discharge area at the Boca do Rio). A north to south flow can also be identified on the eastern side of the aquifer system, related to the discharge area at the estuary of the Bensafrim stream.
In order to complement the spatial distribution of hydraulic heads represented by the piezometric map in Figure 9, the temporal variation of hydraulic heads for the 11 observation points with the longest time series (data provided by CCDRA) are represented in Figure 10. As can be seen, this data does not reveal significant variations of the water level. This behaviour could be a result of a high regulating capacity of the aquifer system, as well as being due to the well developed karst network of the aquifer system which allows for good hydraulic connections between all of the aquifers sectors and the natural discharge areas (Almeida et al., 2000).
Jan-77 Jan-80 Jan-83 Jan-86 Jan-89 Jan-92 Jan-95 Jan-98 Jan-01 Jan-04 Jan-07 Date 0 10 20 H yd ra ul ic H ea d (m )
Figure 10 – Historical data on hydraulic heads obtained from piezometers with the longest time series of data (data obtained from SNIRH, 2009).
Of note are the values registered by the two piezometers which are significantly different from the rest. Unfortunately these are the only piezometers in their respective areas, and therefore there is currently no other data to corroborate these readings. Future monitoring planning
20 should consider the option of selecting extra observation points in these areas to obtain a more accurate understanding of these anomalous readings.
2.5. Stream Network and Surface Water flow
The system is crossed by various water lines originating in the hills to the north (the streams Vale do Barrão, Almádena and Bensafrim), and when these streams intersect the carbonated Jurassic formations which make up the aquifer system, most of the flow infiltrates. This is largely due to groundwater level below the stream bed which, as was mentioned previously, is in the range of 40-60m over most of its extension only coming close to the surface at the discharge areas due to the formations which cause a barrier at the southern limits of the aquifer system.
Data on stream flow was collected by the CCDRA starting January 2005 to October 2006 from gauges on the Almádena and Bensafrim streams, the location of which can be seen in Figure 11. Gauges on a drainage system which collects water from springs at Portelas and Sargaçal (one of the natural discharge areas for the AO) collected data on spring flow for the same period.
Portelas (Rib. Bens) Portelas (Vala) Sargaçal Sobrosa Barão S. João Almádena Bensafrim (SNIRH) m 0 20000 40000 60000 80000
21
Figure 11 – Main streams (dotted blue lines) and hydrometric stations and monitored springs (red crosses) on the Almádena-Odeáxere aquifer system.
From January 2005 to the end of the 2004/05 hydrological year, the stream at Almádena was always dry. For the same period of time, a total flow of 6480 m3 was registered at the Barão de S.João gauge. The entirety of that flow was registered before March, with the stream being dry from that month to the end of the hydrological year, in September. Downstream from the Barão de S.João gauge there is a discharge point for a sewage treatment plant, which registered a discharge of 12440 m3 for the same period (Reis, 2007). This corresponds to a total flow of 18720 m3 which, apart from a small portion loss to evapotranspiration, will have infiltrated into the aquifer system.
During the 2005/06 hydrological year, total flow at Almádena was 189130 m3, whilst at Barão de S. João, including discharge from the sewage treatment plant was 221155 m3. This indicates that about 32025 m3 will have infiltrated, which is relatively insignificant at the scale of the AOs water budget (Reis, 2007). It is important to refer that there is no estimate of the flow from the tributaries which connect to this stream in-between the hydrometric stations. Therefore the impact of potential recharge from the tributaries is unknown.
It is of note that, near Barão de S. João there are alluvium deposits on top of the limestone formations, which form a small aquifer which is mostly recharged by the stream. It is therefore likely that the volume of water from the stream that reaches the karst aquifer is even less significant (Reis, 2007).
Unfortunately, due to technical difficulties in installing the sensor, there is no data for stream flow downstream from Almádena, at the Boca do Rio discharge area.
The Bensafrim stream was monitored in three places, on the Machada and Sobrosa streams (which join together to form the Bensafrim stream, slightly upstream from the AO) and at Portelas at one of the AOs natural discharge areas. The difference between the volume of flow registered at Sobrosa and Machada and at Portelas was 716256 m3 for the hydrological year of 2004/05 and 2192000 m3 for 2005/06 (Reis, 2007). This value of recharge from this stream is significant considering it represents approximately 13% of the AOS average annual water budget.
Unfortunately this data only covers a short period, and is insufficient for a comprehensive analysis of surface water behaviour. However, as can be seen in Figure 12 the flow in both
22 these streams is dependent on rainfall, only occurring after precipitation episodes and drying up during dry periods. Therefore it can be supposed that the wetlands which are associated with them depend on the presence of ground water discharge to maintain their functionality.
0 40000 80000 120000 F lo w R at e (m 3 /da y) 2/17/05 9/5/05 3/24/06 Date 100 80 60 40 20 0 P re ci pi ta tio n (m m )
Figure 12 – Stream hydrographs measured at the Portelas-Bensafrim gauge (blue line) and Almádena gauge (red line) compared to precipitation (black line; top axis) registered at the Lagos gauge (31E/01UC); Almádena gauge was inoperative during part of 2005.
2.6. Wetlands
The AO aquifer system is hydraulically connected to two wetlands which are formed by upward seepage at the aquifers diffuse discharge areas, as was previously mentioned in chapter 2.3.2. Wetland ecosystems hold an important part of Europe’s biodiversity. They provide ideal conditions for a vast diversity of habitats and species. They are especially important for birds, providing vital nesting and migratory flyway areas, as well as for fauna species and countless specialist plant species (Silva et al., 2007). Wetlands support a wide range of public goods and services, such as providing fresh water and recreational tourism opportunities. In addition they act as carbon sinks and are therefore fundamental asset in our efforts to reduce levels of greenhouse gases in the atmosphere. However, despite their importance, wetlands are
23 disappearing or are being polluted at an alarming rate and are among Europe’s most threatened ecosystems (Silva et al., 2007).
The wetland known as the Paúl de Lagos (or Paúl da Abedoeira) is located at the mouth of the Bensafrim stream, to the North-east of the city of Lagos and within a short distance from the protected Ria do Alvor. It is considered one of the most important wetlands in the Western Algarve due to its rich biodiversity. This wetland covers an area of 297 hectares and has an interesting mix of flora and fauna (Costa, 2001). The vegetation found here, as well as the various channels which cover it, attract numerous species of birds which come to nest, as well as many reptiles and other animals which proliferate in the undergrowth (Costa, 2001). Over 373 species of plants, 37 types of butterflies, 15 different mammals as well as 190 species of birds have been documented. Of particular note is the Monarch Butterfly (Danaus plexippus), which is extremely rare in Europe and the only known breeding colony in Portugal is at the Paúl de Lagos (Costa, 2001).
Human occupation and alteration of the Paúl is well documented as far back as the XV century, during which a channel system was built in order to drain the marsh as well as provide water to the city of Lagos (Barata, 2003). Since then the Paúl has mostly been used as agricultural land up until the 1970s, when it was occupied by rice paddies. With the decline of agricultural activities in the recent past, they have been mostly abandoned and are currently reduced to a few small farms (Domingos et al., 2008).
This area was recently the focus of a study by the Portuguese Society for the Protection of Birds (SPEA) and the British Royal Society for the Protection of Birds (RSPB) to determine the present state of its wildlife and steer a proposed habitat creation opportunity supported by the Lagos Municipal council. They determined that the flow from the springs in the area, which is currently flowing along ditches into the sea, could be viably harnessed for habitat creation (Costa, 2001). It was established that the Paúl de Lagos would be suitable for creating a large self-sustaining fresh water lagoon which would enhance this areas already large ornithological significance.
The Boca do Rio wetlands (also known as the Vale de Barao wetlands) form at the confluence of the Ribeiro de Budens, Ribeiro de Boi and Ribeiro de Vale Barao, west of Lagos. The wetlands occupy a fault-bounded valley at the coast, extending inland for approximately 1 km before dividing into the three tributary valleys (Allen, 2003). Land use in the catchment is at present largely agricultural, but with much uncultivated land. Much of the wetland area is
24 supratidal, separated from the sea by a narrow beach which prevents marine ingress even during severe storms (Allen, 2003). Consequently a well-developed creek system, such as that associated with many coastal marshes, is absent. The major outflow of the rivers has been canalized as it crosses the wetlands, but periodically there are extensive floods from precipitation in the catchment (Allen, 2003).
Land-use activity in the catchment inevitably influences the ecology of the wetlands giving rise to the transience of the varying ecological status of the wetlands. Recognition of this is important given that wetlands are among the most threatened of Mediterranean ecosystems and environments. Major threats come from development pressures and reclamation; a Council of Europe survey in 1984 found that 80 per cent of Portuguese wetlands were vulnerable to reclamation (Hollis, 1992). The threat comes from tourism and recreation, and unsustainable abstraction of drinking water. For the Mediterranean basin as a whole, estimates suggest that by 2025 there will be about 380 million tourists per year if economic growth is weak, but about 760 million if it is strong and that almost half of these tourists will be concentrated along the coast, many in Portugal (Stanners and Bourdeau, 1995). Although there have been no major tourist developments in the Boca do Rio catchment, there are some small villa complexes and the wetlands themselves are reportedly now threatened by the development of a marina.
While not a site of prime conservation value in the Algarve (in comparison, for example, with the much larger and more varied habitats of the Rio Formosa National Park further east), the Boca do Rio wetlands provide valuable habitat for wildlife, especially as attempts at reclamation for agriculture have been abandoned and marsh conditions have become re-established (Allen, 2003). Populations of some wetland species are high, especially of the European pond turtle (Emys orbicularis) and the viperine water snake (Natrix maura). It is also believed that there are important populations of freshwater birds such as rails (Rallidae) and crakes (Porzana spp.) (Pullan, 1988).
Considering the significance and fragility of these surface water bodies, it is of utmost importance to properly understand any potential threats to their existence and function. Taking into account the dependence of these two wetlands to ground water discharge, any water resource management plan which takes into account the use of ground water as a source of supply must consider the impacts this could have on these surface water bodies and their associated ground-water dependent ecosystems.
25
3. Numerical Modelling Method
In this chapter, a brief description will be given of the physical principals underlying the simulation of the hydraulic of the aquifer system, followed by a brief description of the numerical method to be applied.
The following description is adapted from Monteiro (2001):
t h S Q z h K z y h K y x h K x xx yy zz s ∂ ∂ = + ∂ ∂ ∂ ∂ + ∂ ∂ ∂ ∂ + ∂ ∂ ∂ ∂ (1) In which:
Kxx, Kyy and Kzz are values of hydraulic conductivity [LT-1] along the x, y and z Cartesian axis which are assumed to be parallel to the directions of greater hydraulic conductivity, h is the hydraulic potential [L], Q is the volumetric flux per unit of volume [L3T-1L-3] that represents fluid gains and losses and Ss is the storage coefficient, necessary to simulate transient variations on
the reserved volume of water [L-1].
Hydraulic conductivity is defined by the expression:
µ
ρ
gkK = (2)
In which ρ is the density of water [ML-3], g is gravitic acceleration [LT-2], k is the intrinsic or geometric permeability [L2] and µ is the dynamic viscosity [ML-1T-1].
The piezometric level, also known as hydraulic potential (h [L]), corresponds to the energy per unit of mass of the fluid, if kinetic energy is disregarded, as is expressed as the sum of the elevation potential, z [L] of the fluid and the pressure potential, p [ML-1T-2] at a given point:
z g p h + =
ρ
(3)The storage coefficient [L-1] is defined by the expression:
(
α
β
)
ρ
g
n
26 In which α represents the compressibility of the porous media [LT2M-1], n is the effective porosity (non-dimensional) and β is the waters compressibility [LT2M-1].
Equation (1) is often expressed in a more compact manner, using the divergence and gradient differential operators:
[ ]
(
K gradh)
Q div t h Ss + − = ∂ ∂ (5)The equation describing groundwater flow can be solved for particular boundary conditions by the finite element method, which is a particularly well suited approach for integrating partial differential equations over space and thus to simulate flow in complex geometry flow domains. The use of finite element models is currently a standard approach for solving problems in hydrogeology and is described in textbooks such as HuyakomandPinder (1983), Kinzelbach (1986), WangandAnderson (1982) and BearandVerujit (1987).
The finite element method is implemented in several commercial and public domain codes to solve problems in hydrogeology. The most employed method to assemble the element matrix is the Galerkin method of weighted residuals. The description of the principles of this method is adapted from Monteiro (2001):
The flow domain is divided into discrete elements, each of which is characterized by its shape, hydraulic conductivity and storage coefficient. Equation (5) is presented in the form:
0 ) (h =
L (6)
Where L is a differential operator and h is the dependant variable (hydraulic head).
A trial solution h^ for the unknown variable is defined as a function of a set of quadratic or linear
polynomial functions, expressed by the Equation (7).
j n j j
h
N
h
∑
=≅
1 ^ (7), where hj are the unknown nodal values, Nj are the interpolation (or basis) functions and n is the total number of nodes defining the elements in a mesh representing the geometry of the flow domain. When h is substituted by h^ in equation (7) an approximate solution is defined.
27 0 ) ( ≠ =L h r (8)
To minimize the residual over the entire flow domain an integral equation is written to ensure that the basis functions satisfies the partial differential equation of flow. This is accomplished by defining a weighted integral of r over the elements of the flow domain and then setting this integral equal to zero. As a consequence of this the weighted integral will be zero over the entire flow domain V and thus over the entire set of n weighting functions (Wi):
0 ) (
∑
=∫
W L N hj dV j j V i for i = 1,2,…, n (9)Thus the method of weighted residuals seeks to determine the unknown hj in such a way that the error is minimized in the flow domain V. In the Galerkin method the employed interpolation (or basis) functions and weighted residual functions are the same (Ni = Wj). After the definition of these functions (usually linear or quadratic polynomials) the values of hˆ calculated by equation (7) are combined with equation (9) to provide a set of simultaneous equations where the unknown variable h^is defined for each of the n nodes of the finite element mesh (equation
10):
[ ]
A h ={ }
f ⋅ ^ (10)Where
[ ]
A
is the global stiffness matrix and ^
h is the vector of unknown variables and
f is
the source term. Once the values of all elements are combined, including prescribed boundary conditions, the resulting set of simultaneous linear algebraic equations is solved using different solution algorithms. Different direct and iterative solvers based in matrix solution techniques are available to solve the resulting assembled algebraic equations.
28
4. Ground-Water Flow Model
In Chapter 2, an overview was given of the current knowledge, data and information available on the AOs hydrogeological behaviour.
The following chapter aims to describe the steps taken in the construction of the model which lead to the version applied in this thesis. It is important to point out that some of this work was carried out by researchers from the University of the Algarve prior to the beginning of this thesis, namely the generation of the finite element mesh, definition of boundary conditions and definition of spatial distribution of transmissivity.
4.1. Conceptual Model
The AO has an area of 63.5 km2 and stretches from Odeáxere (east) to Almádena (west). The aquifer system is a free to confined karstic system, which develops in carbonate Lias-Dogger outcrops and stretches in a NE-SW direction. The dominant lithologies are limestone, dolomite limestone and dolomite rock with thicknesses between 1000m and 60m, and which present, in certain places, a well developed karst (Reis, 1993; Almeida et al., 2000).
Regional groundwater flow occurs predominantly from the NE to SW. There are two main sources of recharge: indirect infiltration from streams flowing across the system (the Bensafrim and Odeáxere being the most significant) and direct infiltration over the system (Reis, 1993). The system is traversed by various water lines originating in the hills to the north (the streams Vale do Barrão, Almádena and Bensafrim), and when these streams intersect the carbonated Jurassic formations which make up the aquifer system, most of the flow infiltrates. The main natural discharge areas are located (1) along the Bensafrim stream, which forms the main drainage axis for the AO system and (2) a second diffuse discharge area at Boca do Rio the SW point of the system which feeds a wetland area (Almeida et al., 2000).
4.2. Numerical Model
Ground water flow was simulated by the use of FEFLOW (Finite Element Subsurface Flow and Transport Simulation System). This is sophisticated software and consists of an interactive simulation model of groundwater flow in 3D and 2D, using the numeric method of resolving partial differential equations through finite elements mesh (FEM).