Mehdi ELHIMER, Nicolas JACQUES, Aboulghit EL MALKI ALAOUI, Cécile GABILLET - The influence of aeration and compressibility on slamming loads during cone water entry - Journal of Fluids and Structures n°70, p.24-46 - 2017
Any correspondence concerning this service should be sent to the repository
Contents lists available atScienceDirect
Journal of Fluids and Structures
journal homepage:www.elsevier.com/locate/jfs
The in fl uence of aeration and compressibility on slamming loads during cone water entry
M. Elhimer
a,⁎, N. Jacques
a, A. El Malki Alaoui
a, C. Gabillet
baENSTA Bretagne, FRE CNRS 3744, IRDL, 2 rue François Verny, F-29806, Brest CEDEX 9, France
bIRENav, Institut de Recherche de l’Ecole Navale, F-29240 Brest, France
A B S T R A C T
The problem of the impact between a rigid body and a gas-liquid mixture is relevant to various engineering applications, including the design of breakwaters and LNG containers. In the present study, the particular problem of the impact of a rigid cone upon the surface of an aerated liquid is investigated. Numerical simulations of water entry of cones with different deadrise angles (7°and15°) were performed using an explicitfinite element method. The air-water mixture is modelled as a homogeneousfluid with a specific equation of state. In addition, experimental tests of the impact of a cone with a deadrise angle of7°on the surface of bubbly water were performed. The air volume fraction was measured prior to the impact tests using optical probes, and the instantaneous impact force on the cone was measured using strain gauges. The results highlight a significant reduction of the impact load with the increase of the air volume fraction. Moreover, the numerical results show that this reduction is also dependent on the impact velocity. This phenomenon is found to be related to the nonlinearity of the equation of state of the air-water mixture.
1. Introduction
Naval and offshore structures should withstand high loads due to fast and repeated impacts with the water free surface. The design of such structures requires information about the hydrodynamic forces arising during these impacts. Examples of water impact problems are the slamming of ships in heavy sea conditions (Kapsenberg, 2011) and the water landing of aerospace structures (Seddon and Moatamedi, 2006). In some cases, air bubbles can be entrapped in the liquid. As the speed of sound in a liquid is significantly reduced by aeration, compressibility effects can probably play a certain role in this situation.
An early theoretical study on hydrodynamic impacts was conducted byvon Karman (1929)in order to compute the loading on seaplanefloats during landing. By considering the momentum conservation before and after the impact, this author derived a formula for the force on a wedge during water entry.Wagner (1932)developed a more refined theory of water impact, still widely applied. The Wagner model is dedicated to bodies with small deadrise angles. It assumes that theflow is incompressible and potential, and the boundary conditions are linearized and imposed on the initial liquid free surface. By using the linearized Bernoulli equation, the pressure distribution on the wetted surface is obtained. The distribution of the pressure is singular at the boundary of the wetted surface. However, the singularity is integrable and the force acting on the body can be computed by integrating the pressure over the wetted surface.
Several extensions of the Wagner theory have been proposed to correct this singularity and to improve its predictive capabilities
http://dx.doi.org/10.1016/j.jfluidstructs.2016.12.012
Received 29 April 2016; Received in revised form 17 November 2016; Accepted 16 December 2016
⁎Corresponding author.
E-mail address:[email protected](M. Elhimer).
Available online 01 February 2017
0889-9746/ © 2017 Elsevier Ltd. All rights reserved.
MARK
whereViis the velocity of the impacting body andβthe deadrise angle. Whenβis small, the expansion velocity is significantly larger than the impact velocity, and may approach the sonic speed in thefluid. In this case,fluid compressibility must be taken into account in the computation of the impact force.
Using the acoustic theory,Skalak and Feit (1966)proposed a linearized model for water entry at constant velocity of a wedge in a compressible liquid. They developed a solution for the hydrodynamic force and the pressure distribution using the analogy with the stationary problem of a plane lifting surface at a small angle of attack.Poruchikov, (1973, 1974)considered the problem of the penetration of rigid cones and wedges into an inviscid compressiblefluid. His analysis was also conducted within the acoustic framework and the problem was solved analytically when the expansion velocity is subsonic. He showed that the omission of the compressibility effect may lead to a significant overestimation of the impact force. The case of impacting bodies of arbitrary shape was considered byKubenko and Gavrinlenko, (1986, 1987)and byKorobkin, (1992, 1994).
One of the main practical applications for which compressibility effects are important is related to thefield of coastal engineering.
Breakwaters are subject to high loads due to the impact of breaking waves. In this case, the compressibility of the liquid is enhanced due to the presence of entrapped air bubbles. It is well known that the compressibility of an aerated liquid is very much higher than that of the pure liquid and that the sonic speed in a diphasic mixture decreases rapidly with the gas volume fraction (or void fraction), see e.g. (Brennen, 2005). For instance, the presence of even two percent by volume of air bubbles in sea water causes a dramatic reduction of the speed of sound from about1500 /sm to less than100 /s. Experimental evidences of the effect of aeration onm hydrodynamic pressures during wave impact were reported in several studies (Bredmose et al., 2009; Bullock et al., 2001, 2007;
Hattori et al., 1994; Walkden, 1999).
Despite its practical importance, only few works were dedicated to the impact of solid bodies on aerated liquids. Indeed, the theoretical studies reported previously are based on the acoustic theory. This means that they assume that only small volume changes take place and that the liquid speed of sound is constant. It is questionable if the acoustic approximation can be applied to the slamming on aerated liquids. Indeed, the response of a liquid-gas mixture is generally nonlinear and because of the high compressibility of the gaseous phase, moderate pressure increases can lead to significant volume variations. The influence of constitutive nonlinearities is of particular importance for shock propagation problems (Brennen, 2005; Drumheller, 1998;
Grandjean et al., 2012; van Wijngaarden, 1972). It is also likely that this phenomenon plays a certain role in slamming and impact flow problems of bubbly mixtures.
One of thefirst theoretical studies on this topic is due toPeregrine and Thais (1996)who considered the case of an air-water mixture rapidlyfilling a cavity. Thisflow configuration has similar features withflip-through phenomenon.Peregrine and Thais (1996)employed a nonlinear barotropic relation (equation of state) in order to model the air-water mixture. They obtained an analytical solution for the pressure and observed noticeable reductions of the maximum pressure due to aeration, even for small void fractions.
Dias et al. (2010)developed a numerical model for fast transientflows of gas-liquid mixtures. They also employed a two-fluid barotropic model to describe the compressibility of the biphasic mixture. The discretization of the governing equations is based on a second-orderfinite-volume scheme. They presented several simulations of impact-relatedflows of aerated liquids (dam break and drop impact problems). Another numerical model for biphasic mixtures was developed byBredmose et al. (2009)in order to simulate aerated wave impacts. The model was applied to waves of varying height breaking against a vertical wall (configuration similar to the one investigated experimentally byBullock et al. (2007)). The results showed that the compressible barotropic model can successfully reproduce the main characteristics of violent breaking-wave impacts observed in experiments.
To our best knowledge, thefirst slamming experiments with an aerated liquid was performed byEroshin et al., (1980, 1984, 1988). These authors investigated the impact on bubbly water of disks and cones. The advantage of slamming tests is that they make it possible to control more easily the experimental conditions (in particular the void fraction), as compared to full-scale breaking wave impact experiments. The sound celerity in bubbly water was estimated by measuring the propagation velocity of disturbances near the free surface. These authors investigated experimentally the relationship between the maximal impact force and the Mach number. Their results suggest that the linear acoustic approximation agrees satisfactorily with the experimental results only at small values of the Mach number. For large Mach numbers, the acoustic approximation yields a noticeable underestimation of the
1Vi/tan ( )β corresponds to the expansion velocity of the wetted surface only for supersonic impacts. Because in this case, the free surface of the liquid remains undeformed. For subsonic impacts, the expansion velocity of the wetted surfaceVcis slightly larger thanV/tan( )i β because of the pill-up effect. In the incompressible limit, the expansion velocity of the wetted surfaceVcis 28% larger thanV/tan( )i β, according to the Wagner theory.
maximal impact force. More recently, an experimental investigation was conducted byWalkden (1999), see alsoBullock et al.
(2001), in order to quantify the effects of aeration on wave impacts. A series of drop tests were conducted, in which a plate instrumented with pressure transducers impacted a tubefilled with a bubbly liquid. In all cases, the maximum impact pressures were shown to decrease with increasing void fraction, especially for large impact velocities. It is worth noticing that, because the experiments ofWalkden (1999)were conducted in a tube, they are not representative of water entry problems, but more of shock or flat impact problems.
The present work is aimed at quantifying the effects of the aeration on the hydrodynamic loads during the entry of bodies with a simple geometrical form, namely cones, in an air-water mixture. Numerical simulations and experiments were carried out. The numerical model is described inSections 2.1 and 2.2. The considered impact problem was investigated using explicitfinite element simulations. The air-water mixture behaviour is modelled using a non-linear equation of state.Section 2.3is dedicated to the discussion of the numerical results and the analysis of the role played by aeration. In addition, experimental impact tests of a rigid cone on the surface of a bubbly liquid were performed using a large scale shock machine (El Malki Alaoui et al., 2012, 2015). The instantaneous impact force was measured using strain gauges. An array of porous soaker hoses was used for bubbles generation. The air volume fraction in the bubble plume was measured by optical probe technique. The experimental set-up and the instrumentation are described inSection 3.1. Finally, the experimental results are presented and compared to numerical results.
2. Numerical model and results
2.1. Numerical model
Finite element simulations of cone impact on the free surface of an air-water mixture were performed using thefinite element software ABAQUS/Explicit. Explicitfinite element computations were used previously by several authors for the modelling of impact flows (Aquelet et al., 2006; Federico and Amoruso, 2009; Wang and Guedes Soares, 2014), since they are well suited to simulate fast transient phenomena. The present numerical simulations are similar to those carried out in previous studies for the case of pure liquids (Jacques et al., 2010; Tassin et al., 2010; El Malki Alaoui et al., 2012). The readers may refer to these papers for more details.
The configuration considered in the simulations is illustrated inFig. 1. The cone moves in thez⃗direction with a constant velocity
−V. z⃗i . The cone radius was equal to 165 mm and two deadrise angles were considered:β = 7°andβ = 15°. Thefluid was initially at rest. The impact velocityViwas ranging between0. 2 m.s−1and170 .sm −1forβ = 7°and between0. 43 .sm −1and371 .sm −1forβ = 15°. The expansion velocityVewas between1. 62 .sm −1and1385 .sm −1for both deadrise angles. The size of thefluid domain was equal to 2×2 m. Frictionless unilateral contact is used to describe the interaction between thefluid and the impacting solid.
The software ABAQUS/explicit uses by default a Lagrangian approach, where the mesh moves with the fluid motion. The drawback of this approach in the present case is that large deformations of thefluid take place in the impact region, leading to an excessive distortion of the mesh. In order to avoid this problem, the adaptive meshing technique of ABAQUS was employed. This method is based on an Arbitrary Euler-Lagrange (ALE) formalism, in which the mesh moves independently of thefluidflow, coupled with the operator-split technique (Souli et al., 2000). With the adaptive meshing procedure, a new mesh is created at a certain frequency, in order to reduce the distortion of the elements, and the solution variables (stress, density and velocity) are transferred from the old mesh to the new one.
In order to reduce the computational cost of the simulations, the ALE adaptive meshing technique was used only in the impact region, where large deformations are expected to occur. A Lagrangian mesh was used for the rest of thefluid domain, seeFig. 2. The ALE region was meshed using 110,250 axisymmetric 4-node elements with reduced-integration (ABAQUS CAX4R) with the same initial size. The Lagrangian domain was meshed with 68,398 axisymmetric 3-node linear elements (CAX3), with a mesh size increasing with the distance to the ALE region. The mesh size in the impact region was equal to 0.25 mm. We verified that using a finer mesh does influence the simulation results.
The ability of this numerical model to accurately predict slamming loads was assessed previously in the case of impacts on pure water from comparison with experiments (El Malki Alaoui et al., 2012; Jacques et al., 2010; Tassin et al., 2010). Moreover, a comparison with the analytical model ofPoruchikov (1973)for the impact of a cone on a compressible (pure) liquid is presented in Appendix A. We also checked that ABAQUS is able to describe shock wave propagation in bubbly mixtures (as high velocity impacts cause the formation of a shock wave), seeAppendix B.
Fig. 1.Illustration of various quantities related to the cone entry problem.
2.2. Equation of state for aerated liquids
In the numerical model, aerated water is considered as a homogeneous mixture of a compressible liquid (pure water) and a compressible gas (air). Both phases are assumed to share locally the same pressure and velocity. These assumptions made in previous studies on impactflows of bubbly mixtures (Bredmose et al., 2009; Dias et al., 2010; Peregrine and Thais, 1996). Let us consider a Representative Volume Element (RVE) of the diphasic mixture and denote byVLandVGthe volume of the parts of the RVE occupied by the liquid and by the gas, respectively. The total volumeVof the RVE is given byV=V + VL G. The volume fraction of gas in the RVE or void fraction is defined as:
α=V V
G (2)
Denoting byρGandρLthe densities of the gas and liquid phases, respectively, the mixture densityρcan be expressed as:
ρ = αρ + (1 − α)ρG L (3)
The effect of surface tension is neglected and we assume that the representative volume is in static equilibrium. This means that the individual dynamics of the bubbles are not considered in the present work. Therefore, the pressure is the same in the two phases:
P = P =PL G . With this hypothesis, the air-water mixture can be regarded as a barotropicfluid having a unique pressure-density relationship.
Prior to the impact, thefluid is initially at the atmospheric pressureP0. The initial volumes of the gas, the liquid and the mixture are referred to asVG0,VL0andV0respectively. The initial void fraction is referred to asα0. The increase of the pressure causes a compaction of the RVE. It can be easily shown that the specific volumeV/V0of the mixture is related to those of the gas and liquid phases by the equation:
V V = α V
V + (1−α )V
0 0 G V
G0 0 L
L0 (4)
The two terms of the right hand side of the equation can be expressed from the equation of state of each phase. The air is considered as an ideal gas undergoing an isentropic compression. The air specific volume is related to the pressurePusing Laplace’s law:
⎛
⎝⎜ ⎞
⎠⎟ V
V = P
P
G
G0 0
−1/γ
(5) whereγis the Laplace coefficient.γ=1corresponds to isothermal conditions, whileγ=1.4 (for air) to adiabatic conditions. It is not clear if isothermal or adiabatic conditions dominate for water impact problems. For the applications considered here, the typical bubble radius is between 0.1 and 1 mm. For bubbles in this size range, the time necessary to reach thermal equilibrium after compression is between some tenths of milliseconds and some milliseconds (but significant heat exchanges with the liquid take place at shorter times) (Kameda et al., 1998;Watanabe and Prosperetti, 1994). This time can be smaller or larger than the duration of an
Fig. 2.Sketch of the computational model used in the present study.
impact depending on the impact velocity. All the results presented in the present paper were obtained withγ=1. We also carried out some simulations forγ=1.4. The results of these simulations were very close to those obtained withγ=1.Peregrine and Thais (1996) also investigated the effect of the polytropic index and also concluded that the value ofγ has only a minor effect on the loads generated during an impact on an air-water mixture.
The water phase is considered as a weakly compressible media, where the volume change is related to the pressure through a linear2equation of state:
⎛
⎝⎜ ⎞
⎠⎟ V
V = P−P K +1
L L0
0 L0
−1
(6) whereK =2. 19GPaL0 is the water bulk modulus.3Finally, we obtain the following equation of state for the two phase mixture:
⎛
⎝⎜ ⎞
⎠⎟ ⎛
⎝⎜ ⎞
⎠⎟ V
V = α P
P + (1−α ) P−P K +1
0 0
0
−1/γ
0 0
L0
−1
(7) Because of the difference of compressibility between the gas and liquid phases, a compression of the mixture leads to a decrease of the void fraction. The current value of void fraction in the mixture can be expressed as a function of the pressure (seeAppendix C):
⎛
⎝⎜ ⎞
⎠⎟
α = α (P/P )
α (P/P ) + (1−α ) +1
0 0−1/γ
0 0−1/γ
0 P − P K
−1 0
L0 (8)
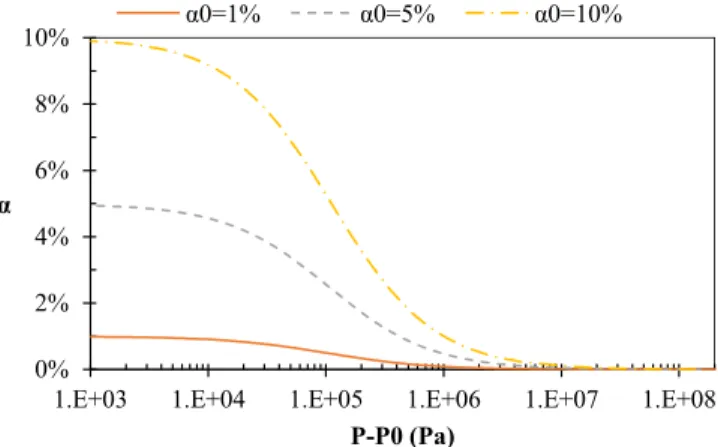
Fig. 3shows the variation of the specific volume as a function of the pressure for air-water mixtures for different initial void fractions:α =1%,0 5%and10%.Fig. 4presents the evolution of the void fractionαwith the pressure for the same initial values of void fraction. From thesefigures, three different stages can be distinguished depending on the pressure value. The variation of the specific volume and the void fraction is negligible for relative pressure below10 Pa4 . Indeed, forP−P < 10 Pa0 4 , the value ofV/V0 remains close to unity andαremains close to its initial valueα0. The effects of the mixture compressibility become noticeable for larger pressures. ForP−P0ranging between10 Pa4 and10 Pa7 , the ratioV/V0decreases with the pressure and eventually reaches a value close to1−α0. This is concomitant with a sharp decrease of the void fraction, which becomes negligible in comparison with its initial value. On the other hand, the water volume change is negligible (the ratioV /VL L0remains close to unity). Therefore, the change of the specific volume in this range of pressure results only from the air compressibility. For larger pressures,P−P > 100 7, the specific volume decreases more rapidly. The air volumetric fraction is very small and therefore the volume change of the mixture is mainly due to the volume change of the water phase.
Let us now examine the evolution of the acoustic properties of air-water mixtures during compression. The sonic speed is defined as (Brennen, 2005):
⎛
⎝⎜ ⎞
⎠⎟ c = ∂P
∂ρ
1/2
(9) From the equation of state(7), the following expression of the sound speed for a diphasic mixture as a function of the void fraction can be derived (Brennen, 2005):
⎛
⎝
⎜⎜
⎞
⎠
⎟⎟ 1
c = (αρ + (1 − α)ρ ) α
ρ c + 1 − α
2 G L ρ c
G G2 L L2
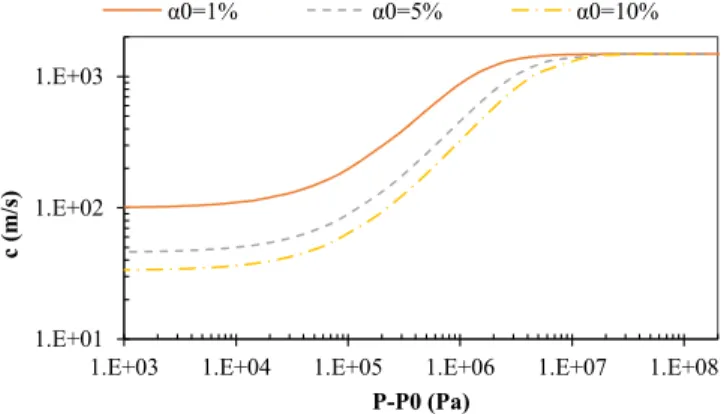
(10) wherecG andcLare respectively the speed of sound in pure air and in pure water at the considered pressure,c = γP/ρG G and c = K /ρL L0 L0.Fig. 5shows the evolution of the sound speedcas a function of the pressure for several initial values of void fraction.
For pressures up to10 Pa4 , the speed of sound remains almost constant because the void fraction and the phase sonic speeds are nearly unchanged. For larger pressures, the sonic speed increases gradually as an effect of the decrease of the void fraction and the increase of the gas sound speed. At very large pressure,cbecomes close to the sonic speed of the liquid phase, as the void fraction tends towards zero. Thus, as an impact may involve large increases of pressure in thefluid, the void fraction and the sound speed may change significantly in the impact region.
In ABAQUS/Explicit, the equation of state was specified in tabular form as a relation betweenP−P0andln (V/V )0. The values of initial void fraction considered in the simulations wereα =1%0 ,α =5%0 andα =10%0 , in addition to the case of pure waterα =00 . As it will be shown hereafter, these void fractions are large enough to have a significant effect on the impact loads and pressures.
2With this equation of state, the liquid densityρLis a linear function of the pressure.
3At 20°C and atmospheric pressure, the speed of sound in watercL0is equal to1481 /m s(Wilson, 1959) and the water densityρL0is equal to997 /kg m3. From these values, the bulk modulus for water is calculated using the following relation:KL0= ρL0 L0c2=2. 19GPa.
2.3. Numerical results
2.3.1. Effect of aeration on impact force, pressure and wetted surface
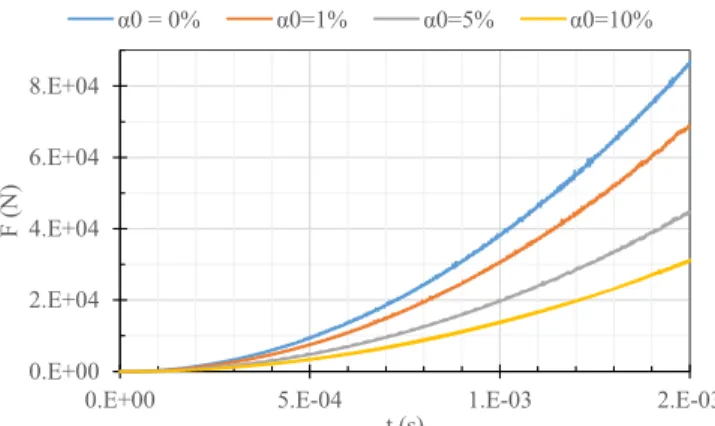
Let us introduce some notations that will be used in the next sections of this paper. The ensemble of the nodes in contact with the cone defines the contact surface and its area is notedS .c The impact forceFis obtained by summing the vertical components of the contact forces on all nodes of the contact surface. The average pressure acting on the contact surface is given byP = F/(S .cos(β)).m c Time evolutions of the impact force for a deadrise angle of7°, an impact velocity of 10 m/s and several initial void fractions (α =1%,5%0 and 10%) are shown inFig. 6.In all cases,Fis proportional to t2 (this behaviour is consistent with dimensional analysis, seeSection 2.3.2). By comparing the different curves, it is observed that the force at a given time decreases significantly with the initial void fractionα0, highlighting the reduction of the impact force due to aeration. Since bothFandScvary ast2, the average pressurePmis constant during the cone impact. InFig. 7,Pmis presented as a function of the expansion velocityVefor all void fractions and deadrise angles. It is showed that the average pressure is reduced whenα0increases.
Fig. 3.Evolution of the specific volumeV V/0as a function of the pressure for three initial void fractionsα0, as predicted by the two-phase equation of state (see Section 2.2).
Fig. 4.Void fractionαas a function of the pressure for three initial void fractionsα0, as predicted by the two-phase equation of state (seeSection 2.2).
Fig. 5.Sonic speed in the mixturecas a function of the pressure for three initial void fractionsα0, as predicted by the two-phase equation of state (seeSection 2.2).
In order to analyse the combined effect of the impact velocity and the initial void fraction on the slamming load, we calculated the ratio between the impact forceFαfor a given initial void fractionα0and the impact forceF0for the pure liquid, at the same impact velocityViand penetration depth (it should be noted that this ratio does not depend on the penetration depth as bothF0andFαare proportional tot2). This ratio is referred to as the force reduction factor (FRF).
Fig. 8shows for both deadrise angles (β=7°andβ=15°) the evolution of the force reduction factorF /Fα 0 as a function of the expansion velocityVe. One observes that aeration leads to a reduction of the impact force for any value ofVe, since the FRF is always smaller than unity and the FRF decreases with the initial void fraction. Interestingly, these results highlight the dependence between the impact velocity and the force reduction due to the aeration. Indeed, the FRF is velocity dependent for all void fractions. The Fig. 6.Time evolution of the impact force from ABAQUS/Explicit simulations for pure water (α0= %0 ) and aerated water (α0= %1 ,α0= %5 ,α0= %10 ). The impact velocity isVi=10 m s. −1.
Fig. 7.Evolution of the average impact pressure as a function of the expansion velocityVe. Results from ABAQUS/Explicit simulations for pure water (α0= %0 ) and aerated water (α0= %1 ,α0= %5 ,α0= %10 ). a) Deadrise angleβ= °, b)7 β= °.15
largest force reductions are observed for expansion velocitiesVeranging between100 .sm −1and300 .sm −1. Forβ=7°, this corresponds to impact velocitiesVibetween12 m.s−1and36 m.s−1, these values can be encountered in several applications and can be achieved in experiments.
For low-velocity impacts,V < 5 . se m −1, the FRF is equal to the ratio of the initial mass density of the aerated mixture and the one of the liquid,F /F ≈ ρ /ρα 0 α0 L0. For these velocities, our simulations show that the average impact pressurePmis lower than10 Pa4 , see Fig. 7. Therefore, in this case, the impact does not cause a significant change of the volume of the bubbly mixture, seeFig. 3.
Consequently, thefluidflow is isochoric and the force reduction due to aeration is only related to the decrease of the initial mass density of the mixture.
At larger velocities, the influence of the enhanced compressibility of the bubbly mixture becomes significant and smaller values of FRF are observed. For example, withβ=7°andV=30 m.si −1(V =244 m.se −1), a load reduction of about 67% (F /F ≈0. 33α 0 ) is observed for an initial void fraction ofα =10%0 . Even for a small void fraction of1%, a maximum load reduction of about 20% (F /F ≈0. 8α 0 ) is achieved. The force reductions observed with the deadrise angleβ = 15°are smaller, but remains significant. For very high velocity impacts (V > 300 .se m −1), the FRF increases with the impact velocity. This phenomenon is caused by the reduction of the void fraction induced by the impact. Indeed, whenV > 300 /e m s, the average impact pressurePmis larger than10 Pa7 , so the air volume fraction in the impact region become negligible (seeFig. 4). Therefore, the effect of aeration on the load is reduced and the influence of the water compressibility prevails.
We now turn our attention to the reduction of the average pressure due to the aeration. We define the pressure reduction factor (PRF) asP /Pmα m0wherePmαis the average pressure for an initial void fractionα0, andPm0is the average pressure for pure water, at the same impact velocity and penetration depth.Fig. 9displays the evolution of the PRF with the expansion velocityVefor the three initial void fractions and the two deadrise angles considered. The evolution of the PRF withVeexhibits the same trends as for the FRF. Indeed, for small impact velocities, the PRF is close to the density ratioρ /ρα0 L0, meaning that the pressure reduction is only due to the decrease in mass density caused by the presence of the gas phase. At larger velocities,Ve>5 /m s, the PRF decreases with the expansion velocity and reaches a minimum forVeclose to150 /sm , for all values of initial void fraction and deadrise angles considered.
Forα =5%0 , the minimum of the PRF is equal to0. 66forβ=7°and to0. 78forβ=15°.
Interestingly, the reduction of the average pressure is smaller than the force reduction for the same expansion velocity. For Fig. 8.Force reduction factorF Fα/0(from ABAQUS/Explicit simulations) as a function of the expansion velocityVefor three void fractionsα0= %1 ,α0= %5 and α0= %10 . a) deadrise angleβ= °, b) deadrise angle7 β= °.15
example, withβ=7°andα =10%0 , the minimum value of the FRF is equal to0. 33, while the minimum PRF is only of0. 5. This suggests that the surface contact areaSc(for a given impact velocity and penetration depth) is also affected by aeration.
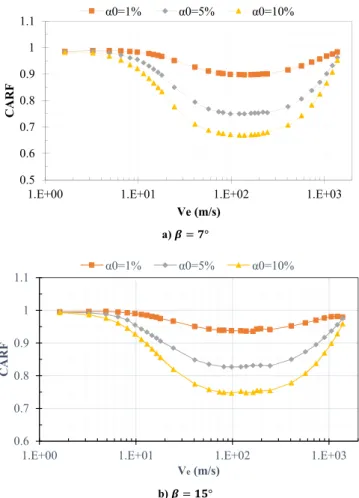
In order to evaluate this effect, we computed the ratioS /Scα c0whereScαis the contact surface for an initial void fractionα0andSc0 is the contact surface for pure water, at the same impact velocity and penetration depth. This ratio will be referred to as the contact area reduction factor (CARF) in the following. The evolution of the CARF withVeis presented inFig. 10. These results show that aeration may induce a significant reduction of the contact surface area, depending on the impact velocity. For very small velocities, V < 5 /e m s, the CARF is close to unity. This means that aeration does not affect the size of the wetted surface for this range of velocities and therefore the PRF and FRF are close (they are almost equal to the density ratioρ /ρα0 L0).
The reduction of the contact surface due to aeration is noticeable for a large range of intermediate velocities,
m m s
10 /s < V < 1000 /e . Even for a small initial void fraction of1%, the maximum reduction of the surface area is of 10% forβ=7°
and of6%forβ=15°. The reduction of the contact surface is higher forα = 100 % as it reaches 33% forβ=7°and 25% forβ=15°. Since FRF = PRF × CARF, the difference between the PRF and the FRF is maximal for expansion velocities around150 /sm , when the CARF reaches its minimum.
At larger velocities, the CARF increases and tends towards 1 whenVebecomes close to the speed of sound of the liquid phase. In this case, the impact is supersonic: the liquid free surface remains undisturbed during the entry of the cone, see e.g. (Skalak and Feit, 1966). It is worth noticing that, according to our simulations, the supersonic impact regime for an aerated mixture does not take place when the expansion velocity reaches the value of the initial sonic speed of the mixture (see Eq.(10)), but the value of the speed of sound of the water. This phenomenon can be understood by considering the results presented inFigs. 4,5and7. The large pressures generated during high velocity impacts cause a strong reduction of the air volume fraction in the impact region and an increase of the speed of sound in the mixture. That is the reason why the supersonic regime, i.e. when the free surface is undisturbed during the impact, is reached only for expansion velocities approaching the speed of sound of the liquid phase.
More insights into pressure and contact surface reduction can be gained from the pressure on the cone surface.Fig. 11displays the pressure distribution acting on a cone with a deadrise angle of 7° for several values of the initial void fraction (α0=0%,α0=1%, α0=5%andα0=10%) and an impact velocity of 10 m/s. For these impact conditions, corresponding toVe=81.5m/s, the reductions of Fig. 9.Average pressure reduction factorPmα/Pm0(from ABAQUS/Explicit simulations) as a function of the expansion velocityVefor three void fractionsα0= %1 , α0= %5 andα0= %10 . a) deadrise angleβ= °, b) deadrise angle7 β= °.15
the force, average pressure and contact surface area due to aeration are significant and close to their minima, seeFigs. 8 and 9.
Fig. 11shows that, for all void fractions, the pressure distribution is highly heterogeneous. The pressure increases strongly near the boundary of the contact surface. It is observed that the peak pressure decreases with the initial void fraction. It is interesting to notice that the ratio between the peak pressurePmaxand the average pressurePmdoes not depend very much on the value of the initial void fraction, seeTable 1. This indicates that the reduction of the peak pressure caused by aeration is similar to the reduction of the average pressure. InFig. 11, the reduction of the surface contact area due to aeration discussed previously is also visible. In the case of an impact on an incompressible liquid, the peak pressure is proportional toρ V0 c2, withVcthe expansion velocity of the surface contact, see (Cointe and Armand, 1987;Zhao and Faltinsen, 1993).Table 1presents the values of2Pmax/ρ V0 c2for the four initial void Fig. 10.Contact surface reduction factorCARF(from ABAQUS/Explicit simulations) as a function the expansion velocityVefor three void fractionsα0= %1 ,α0= %5 andα0= %10 . a) deadrise angleβ= °, b) deadrise angle7 β= °.15
0.E+00 1.E+06 2.E+06 3.E+06 4.E+06 5.E+06 6.E+06
0 0.2 0.4 0.6 0.8 1 1.2 1.4
P (Pa)
(x*tan(beta))/(Vi*t) 0%
1%
5%
10%
Fig. 11.Pressure distribution on the cone surface for an impact velocity of 10 m/s and a deadrise angle of 7° (corresponding toV 81 5m se= . /). Four different initial void fractions are considered:α0=0(pure water),α0= %1 ,α0= %5 andα0= %10 .
fractions considered. It is seen that these quantities are almost constant. This suggests that the reduction of the peak pressure is directly related to the reduction of the surface contact expansion velocity in the present case.”
2.3.2. Dimensional analysis and dimensionless numbers relevant to the problem
The aim of the present section is to identify the physical parameters that control the load reduction during a cone impact on an aeratedfluid. To that purpose a dimensional analysis of the present problem was performed. A special attention was accorded to the dependence of the slamming force with respect to the parameters that define the behaviour of the air-water mixture and the impact conditions (introduced inSections 2.1 and 2.2):
F = Π(V, t, β, α , ρ , P , K , γ)i 0 0 0 L (11)
Using the Vashy-Buckingham theorem, it is possible to define six dimensionless numbers from these nine physical variables. The choice of dimensionless numbers is not unique. In the present case, the following numbers were chosen:
⎛
⎝⎜ ⎞
⎠⎟ f = Π* M, β,α , P γ
K ,γ
0 0
L (12)
Thefirst one is the slamming coefficientf defined as (El Malki Alaoui et al., 2012; Shiffman and Spencer, 1951) : f =Ftan (β)
ρ V t
3
0 i4 2 (13)
For an incompressible impact, the slamming coefficient depends only on the deadrise angle,f=Π*(β). So the impact force scales with time and impact velocity asF~t and F~V2 i4.El Malki Alaoui et al. (2012)found experimentally the following valuesf(7°)=6. 79 andf(15°)=6. 18.
The second dimensionless number is the Edge Mach numberM, introduced bySkalak and Feit (1966)in their theoretical study of wedge impacts on compressible liquids:
M =V c
e
0 (14)
Veis the expansion velocity, related to the impact velocity by Eq.(1), andc0is the initial speed of sound in the air-water mixture given by Eq.(10)(considering the initial void fractionα0and the initial pressureP0). The values ofc0for the initial void fractions considered in the present simulations are provided inTable 2.
The other dimensionless numbers are the deadrise angleβ, the initial void fractionα0, the ratio of the initial bulk modulus of the gas phase to the one of the liquid phaseP γ/K0 L0and the Laplace coefficientγ. In the present study, the attention was focused on air- water mixtures. Therefore, the influence of the two last numbers was not investigated.
Fig. 12presents the evolution of the slamming coefficientf with the edge Mach numberMfor several values of the initial void fraction and two different deadrise angles. Let usfirst examine the case of the pure liquid (α =00 ). Two different impact regimes can be identified. For very low values of Mach number,M<0.05, the slamming coefficient is almost constant, meaning that the effect of liquid compressibility is negligible. At larger Mach numbers, a gradual decrease of the slamming coefficient is observed. Moreover, the slope of the curvef − ln(M)decreases monotonically when the Mach number increases. The value offwhenMis tending towards 1 is about two times smaller than the value corresponding to the incompressible regime for both deadrise angles.
The evolution of the slamming coefficient with the Mach number is more complex for an air-water mixture. At low Mach numbers, the evolution off is identical to the one observed for a pure liquid. The incompressible regime, wherefis constant, also takes place for values ofMlower than 0.05. (However, it should be noted that this corresponds to much lower impact velocities for an aerated liquid. For instance, withα =1%0 andβ = 7°,M = 0. 05is obtained for an impact velocity of only 0.62m/s). ForM>0.05, Table 1
Characteristic values of the pressure distributions plotted inFig. 11.Vcis the surface contact expansion velocity,Pmis the average pressure andPmaxis the peak pressure.
α0 Vc(m/s) Pm(kPa) Pmax(kPa) Pmax/Pm 2Pmax/ρ V0c2
0 103 1155 5325 4.61 1
1% 98 1032 5013 4.86 1.06
5% 89 787 3732 4.74 0.99
10% 85 616 2986 4.84 0.93
Table 2
Values of the sonic speed at atmospheric pressure in an air-water mixture for the initial void fractions considered in the present study.
α (%)0 0% 1% 5% 10%
c (m.s )0 −1 1481 100. 4 45. 9 33.3
the influence of compressibility becomes significant andfdecreases with the Mach number. At the beginning, the evolution offis similar to that for the pure liquid. Nevertheless, whenMgoes beyond 0.3, the relation betweenfandMbecomes dependent of the initial void fraction. In particular, we observe that for an aerated mixture there is a range of Mach number for whichfremains fairly constant. For instance, withα =1%0 andβ = 7°, the slamming coefficient only decrease from 5.82 to 5.44 for0. 73<M< 2.43. Then,f decreases rapidly for larger Mach numbers. This phenomenon is thought to be related to the nonlinearity of the equation of state of the aerated water and the decrease of the air volume fraction due to the large pressures generated by the impact. Indeed, we observed that the values of the Mach number where the evolution offwithMfor the aerated liquids depart from the one for pure water corresponds to impact pressures for which the void fraction begins to drop rapidly, seeFig. 4.
From the results displayed inFig. 12, it appears that the reduction of slamming loads due to aeration cannot be interpreted by considering only the influence of the void fraction on the initial bulk modulus (or sonic speed) of the mixture, as the slamming coefficient generally depends on the Mach numberandthe initial void fraction. A proper analysis of the influence of aeration on slamming loads requires the use of a nonlinear equation of state.
3. Experimental methods and results
3.1. Experimental set-up and methods
3.1.1. Description of the experimental set-up and instrumentation
Impact tests on aerated water were conducted using the SERVOTEST hydraulic shock machine of ENSTA Bretagne, with a large water tank underneath (Fig. 13). The tank was2mwide,3mlong and2mdeep, and wasfilled with water to a height of 1.2 m. An aluminum cone with a deadrise angle of7°and a diameter of33cmwas screwed at the end of the machine piston (Fig. 14). The instrumentation was similar to the one used in previous studies (El Malki Alaoui et al., 2012, 2015). A set of twelve strain gauges was mounted near the piston end. These gauges measured the force acting on the cone. Moreover, a piezo-resistive accelerometer was mounted on the cone to measure its acceleration during the tests and an internal sensor of the machine provided the position of the piston. A differential acquisition system recorded the signals at a frequency of100kHz. Based on the devices sensitivity, the uncertainty on the force measurements is estimated at±103Nand the uncertainty on the acceleration measurements is estimated at
±0. 12g.
a) = °
b) = ° M
2 3 4 5 6 7
1.E-03 1.E-02 1.E-01 1.E+00 1.E+01 1.E+02
f
M
α0=0% α0=1% α0=5% α0=10%
Fig. 12.Evolution of the slamming coefficientf(from ABAQUS/Explicit simulations) as a function of the edge Mach numberM V c= /e 0for aerated liquids with different initial void fractionsα0and for pure water( = %α0 0 ). a) deadrise angleβ= °, b)7 β=15°.
The shock machine is able to maintain the translation velocity of the piston almost constant during the impact stage. For the impact tests reported in this paper, the reference impact velocity was set toV=8 /si m . The cone velocity Vi was computed by integration of the acceleration signal. It was observed that the cone velocity was within±4%of the reference velocity for all tests. The cone vertical position z was computed from the integration of the velocity signal, and checked against the values given by the machine displacement sensor (seeEl Malki Alaoui et al., 2012, 2015).
The total forceFtotis the sum of the inertial forcem. aand the hydrodynamic impact forceFapplied on the cone:
Fig. 13.The hydraulic shock machine used for the experimental impact tests. The water tank is underneath the shock machine. The cone is not shown on this picture.
Fig. 14.Dimensions of the aluminium cone used in the experiments.
F=F −m. atot (15) The mass of the conemis equal to14kg. An example of force signals is shown inFig. 15. The duration of the impact is of2. 10 s−3. At the end, the impact forceFreaches70kNwhile the inertial forcemawas less than6kNduring the impact tests. After the full immersion of the cone, the hydrodynamic force drops when theflow separate from the cone (Peseux et al., 2005; Tassin et al., 2014).
For the purpose of air bubble generation, an aerator was put in the bottom of the water tank. It was made of an array of 30 parallel porous soaker hoses (Fig. 16). The hoses are1. 3min length and the array spans the width of the tank. Compressed air was injected at both ends of each hose. The total air massflow rate was monitored using two rotameters connected in parallel. The injection pressure was controlled using a pressure regulator and measured by a digital manometer. According to Darcy’s law, the flow rate through a porous medium is proportional to the pressure drop across the medium. We carried out severalflow rate measurements for different injection pressures and checked that theflow rate increased linearly with the pressure. The impact tests reported in the present study were performed for three different values of the air massflow rateQ, given in standard liter per minute (L /minstd ) inTable 3. The uncertainty on the massflow rate is estimated at± 2. 5L /minstd while the uncertainty on the air pressure is estimated at±0. 01bar.
3.1.2. Void fraction measurement method
Prior to the impact tests, measurements of void fraction in the impact area were conducted using a single optical probe system (Barrau et al., 1999; Mäkiharju et al., 2013), build by RBI-Instrumentation. The optical probe was made of an opticalfiber with a diameter of10μm. The probe tip was immersed at different positions in the air-water mixture. An optical signal was generated by an optoelectronic module and injected into thefiber. The optical signal is completely reflected back to the optoelectronic module only when the tip is immersed in air (dewetted). This signal is converted to a voltage signal by the optoelectronic module and recorded by a NI acquisition card with a sampling frequency of20KHz. This signal is then binarized in order to get the air characteristic function χ. When the voltage is larger than a user defined threshold, the probe tip is considered to be in contact with air, thus χ = 1. Otherwise, when the voltage is lower than the threshold, the tip is considered to be wetted andχ = 0. The void fraction is defined as
0.0E+00 5.0E-04 1.0E-03 1.5E-03 2.0E-03 2.5E-03 t (s)
Fig. 15.Example of the recorded force signals during an impact test on pure water.Ftotis the total force measured by strain gaugesFis the hydrodynamic impact force andm a. is the inertial force.
Fig. 16.Picture of the air bubble generator: an array of porous soaker hoses (black) at the bottom of the water tank.
the time average of the air characteristic function over the acquisition timeT:
∫
α = 1 T χ(t)dt
0 0 T
(16) In our measurements, the threshold was set to 10% of the voltage maxima. When the threshold is larger than the noise level, the measurement results are shown to be very little sensitive to the threshold. Indeed, the increase of the threshold from 10% to 50% of the maxima leads to a decrease of about10%of the measured void fraction. The acquisition duration was 150 s and the acquisition was repeated three times. A mechanical device was used to translate the probe tip in two directions. The void fraction measurements were made at three horizontal positionsY = 16cm,Y = 0 andY = − 16cm(Y = 0corresponds to the axis of the piston machine), and four vertical positionsZ = 0,Z = 10mm,Z = 20mmandZ = 50mm(the Z axis is oriented downward andZ = 0corresponds to the position of the water free surface when no air is injected).
3.2. Experimental results
3.2.1. Void fraction measurements results
Vertical profiles of void fraction are presented inFig. 17for the three airflow rates considered.. As expected, the void fraction at any position increases with the air massflow rate. For a given air massflow rate, the relative difference between the minimal and maximal void fraction α0 at the different measurement positions varies between 37% for Q = 108. 3 L /minstd and 13% for Q = 174. 6 L /minstd . The average values ofα0for each massflow rate are given inTable 4. The mean void fraction was ranging between0. 35%and1. 1%.
It can be observed that the mean void fraction increases linearly with the air massflow rate. This suggests that the mean rising velocity of the bubbles was not sensitive to the air massflow rate. Taking into account the size of the aerator, the estimated value of the average rising velocity of the bubbles is between19cm.s−1and20cm.s−1. This value corresponds to the terminal velocity of a single spherical bubble of diameter close to1. 3mm rising in still water (Batchelor, 1967). This estimation of the bubble size is in good agreement with measurements performed with a small-scale aerator, made of the same porous soaker houses, in a smaller water tank using a double optical probes system. Indeed, these measurements showed that the bubble size was ranging between1mmand 2mm(Croci et al., 2014). It should be observed that the rising velocity is very small compared to the impact velocity.
3.2.2. Impact force measurements results
Thirteen impact tests were carried out for an impact velocityV=8 /si m : 2 for pure water, 5 forα =0. 35%0 , 3 forα =0. 56%0 and 3 for α =1. 1%0 . The results of the tests are presented inFig. 18. For each test, the evolution of the impact force is plotted as a function of the cone positionz−zs(zsbeing the position of the cone at the time of full immersion, i.e. when the hydrodynamic force reaches its maximum). In previous studies (El Malki Alaoui et al., 2012, 2015), it was showed force measurements during impact tests on pure water are well repeatable. This is also visible inFig. 18-a. Indeed, the results of the two tests forα =0%0 are very close. With aeration, a larger scatter between the results of different tests performed for the same air massflow rate is observed. Most probably, this scatter is due to the unsteadiness of the bubblyflow. Indeed, it is well known that buoyancy-drivenflows in bubble plumes are generally unsteady and turbulent, leading to the inhomogeneity of the void fraction distribution (Buwa et al., 2004;Caballina et al., 2003;Dhotre and Smith, 2007;Mudde, 2005;Upadhyay et al., 2013). Therefore, even if the air massflow is kept constant, the void fraction distribution4in the impact region may change from one impact test to another, resulting in significant differences of the impact force evolution. Despite this scatter, a general tendency of the impact force to decrease with the average void fraction (or air massflow rate) is observed. This is clearly visible by considering the force maxima. While the peak force is larger than70kNfor α =0%0 , it decreases to61kNwhenα =0. 35%0 and to less than47kNwhenα =1. 1%0 .
For each value ofα0, the data from all tests were used tofit to a second-degree polynomial (seeAppendix D). Thefitting curves for eachα0are also shown inFig. 18, and a good agreement with the data is found. This suggests that the impact force is proportional to t2in both pure and aerated water, as shown by the numerical simulations. Thefitted curves for all values ofα0are compared in Fig. 19(the force is plotted as a function ofz−z0, withz0being the position of thefirst contact estimated from regression analysis, see Appendix D). Thisfigure makes it clear that, on average, the impact force increases less rapidly with the cone displacement as aeration increases.
From thefitting procedure, an average value of the slamming coefficientf was determined for each initial void fraction (see Appendix D). The obtained results are presented as a function of the initial average void fractionα0inFig. 20-a and as a function of Table 3
Air mass flow rate through the aerator as a function of the injection pressure.
Air injection pressureP(mBar) 1231 1345 1680
Air massflow rateQ(L /min)std 108. 3 174. 6 327
4The inhomogeneity of the instantaneous void fraction discussed here should not be confused with the slight inhomogeneity shown inFig. 17. Indeed, the results presented inFig. 17correspond to average values of the void fraction over the acquisition time (150s). The instantaneous void distribution is probably much more inhomogeneous.
the edge Mach numberMinFig. 20-b (the initial speed of sound in the mixturec0was calculated fromα0using Eq.(10)). It should be noted that the values ofMfor the tests with aeration are larger than0. 3and reach0. 68for the largest void fraction. Therefore, these tests are outside the range highlighted inSection 2.3.2wherefis dependent onMonly. The slamming coefficient is shown to decrease with the initial void fraction and the Mach number. Indeed, the coefficientfdrops from 6.8 for pure water to 5.5 when the
b) Q = 174 .6 Lstd/ min
c) Q = 108 .3 Lstd/ min
0 10 20 30 40 50
0.2 0.3 0.4 0.5 0.6 0.7 0.8
Z (mm)
α(%)
Y=-16 cm Y=0 cm Y= 16 cm
0 10 20 30 40 50
0.2 0.3 0.4 0.5 0.6 0.7 0.8
Z (mm)
α(%)
Y=-16 cm Y=0 cm Y= 16 cm a) Q = 327 Lstd/ min
Z (mm)
Fig. 17.Measured void fractionsαas a function of the vertical positionZat three horizontal positionsYand for three air massflow ratesQ.Z=0is the free surface horizontal position andY=0is the horizontal position of the cone axis.
Table 4
Average void fractionα0and the corresponding sonic speedc0as a function of the air massflow rate into the aerator.
Q(L /min)std 108. 3 174. 6 327
α0 (%) 0. 35 0. 56 1. 10
c0 (m.s )−1 168. 5 133. 6 95. 8
void fraction isα =0. 35%0 . The slamming coefficient is further reduced when the void fraction isα =1. 1%0 where it reaches 4.74, corresponding to a reduction of 30% in comparison with pure water.
Fig. 20also presents the results offinite element computations carried with the model presented inSection 2. Obviously, the numerical simulations also predict a decrease of the slamming coefficient when the void fraction increases. However, the reduction is less marked than the one observed in experiments. For pure water (α =00 ), the value offderived from the simulations is in close agreement with the experimental value. For aerated liquids, the numerical model overestimates the slamming coefficient. With α =1. 1%0 , the measured value of f is equal to 4.8, while the modelling predicts a value of 5.8. Several phenomena could be responsible for these differences. First, the numerical model assumes a homogeneous initial void fraction distribution. However, because of the unsteady nature of buoyancy-driven bubblyflows, it is expected that inhomogeneity of the instantaneous void fraction distribution in the impact region exist in experiments. Secondly, it is possible that the motion of the bubbles induces a deformation of the water free surface. These points will deserve attention in the future.
Fig. 18.Evolution of the impact force with the cone displacement from impact tests with several mean void fractionsα0.
-1.E+04 0.E+00 1.E+04 2.E+04 3.E+04 4.E+04 5.E+04 6.E+04 7.E+04
0.00E+00 5.00E-03 1.00E-02 1.50E-02
F (N)
z-z0(m)
0% 0.35% 0.56% 1.10%
Fig. 19.Comparison of thefitted curves of the impact forceF(seeFig. 17) as a function of the cone vertical position.
4. Conclusions
In this study, the problem of the impact of a rigid cone upon the surface of aerated water was considered, in order to assess the influence of aeration on slamming loads. The dependence of the impact force on void fraction and impact velocity was investigated by means offinite element simulations for two deadrise angles, 7°and15°and void fractions of1%,5%and10%.
A significant reduction of the impact force with the increase of the void fraction was highlighted. Reductions of wetted surface and average pressure were also reported. The influence of aeration is dependent on the impact conditions and is the more pronounced when the expansion velocity of the wetted surface is between100 .sm −1and200 .sm −1.
A dimensional analysis was carried out to identify the parameters governing the reduction of the slamming load. Two different ranges were observed, depending on the value of the edge Mach numberM(ratio of the expansion velocity of the wetted surface to the initial sonic speed in the bubbly liquid). ForM<0.3, the slamming coefficient depends only on the Mach number (and not on the initial void fraction). This means that in this range the effect of aeration is mainly related to the decrease of the initial sonic speed with the void fraction. When M > 0.3, the slamming coefficient depends on the Mach number andon the void fraction. This behaviour is due to the nonlinearity of the equation of state of the air-water mixture. In this case, analytical models of water impact based on the acoustic framework (assuming a constant bulk modulus) are, in their current form, not suitable for the analysis of impacts on aerated liquids.
Experimental impact tests were performed using a hydraulic shock machine and an air-bubble generator. The void fraction distribution was characterized using optical probes. The impact tests were conducted with a cone having a deadrise angle of7°for an impact velocity of8 .sm −1and three average void fractions, 0.35%, 0.56% and 1.1%. The reduction of the impact force and the slamming coefficient due to aeration have been confirmed by these experiments. However, the numerical model seems to overestimate the impact force in the case of aerated water. The conclusions of this study are not restricted to the specific case of cone water entry. They may also be relevant to other solid-liquid impact problems where aeration occurs. This includes breaking wave impacts on breakwaters, where the effect of aeration on the impact pressures and forces is important.
The present study points to several perspectives. First, the attention was mainly focused on global quantities (total force and average pressure). Even if some preliminary results are presented inSection 2.3.1, the influence of aeration on the pressure distribution on the contact surface deserves a more in-depth analysis. Also, it would be interesting to consider impacting bodies with
a)
b)
0.0% 0.2% 0.4% 0.6% 0.8% 1.0% 1.2%
α0
3 4 5 6 7 8
0.0 0.1 0.2 0.3 0.4 0.5 0.6 0.7 0.8
f
M
ABAQUS/Explicit Impact tests
Fig. 20.Slamming coefficientsfas a function of a) the mean void fractionα0and b) the Mach numberM. Blue: numerical results, orange: experimental results.
●: numerical results from ABAQUS/Explicit,◇: experimental results from impact tests