2Space Science Center, University of New Hampshire, Durham, NH, USA
3Space Vehicles Directorate, Air Force Research Laboratory, Hanscom AFB, Mass., USA
Received: 10 March 2003 – Revised: 5 June 2003 – Accepted: 18 June 2003 – Published: 1 January 2004
Abstract. We document the detailed spatio-temporal struc-ture of the dayside aurora during intervals of ongoing day-side magnetopause reconnection, primarily during interplan-etary magnetic field (IMF) Bz≤0 conditions. The present study is based on ground auroral observations in combina-tion with particle precipitacombina-tion data from a DMSP space-craft. We describe auroral forms corresponding to the fol-lowing particle precipitation regimes identified by Newell and Meng (1994): (i) central plasma sheet (CPS), (ii) pre-cipitation void, (iii) dayside boundary plasma sheet (BPS), and (iv) cusp (LLBL/cusp/mantle). Two distinctly different auroral configurations are observed, corresponding to differ-ent regimes of the IMF clock angle (θ) and the |By|/|Bz| ratio. Two regimes are defined. In regime (I) θ lies within∼ 90–135◦ and|B
y|/|Bz|>1 (By-dominated), while in regime (II)θis in the range 135◦–180◦and|B
y|/|Bz|<1 (Bz-dominated). Within regime (I) the auroral response to reconnection events typically progresses from lower to higher latitudes in stages as indicated below: (A) equator-ward boundary intensifications (EBIs): sequential brighten-ings of closely spaced, fragmented, rayed bands (BPS au-rora) within the∼08:00–15:00 MLT sector, each of which are moving noonward/sunward, (B) poleward moving auro-ral forms (PMAFs): forms expanding westward from the postnoon side (By>0) and later appearing as a poleward expanding form in the convection throat in the ∼09:00– 12:00 MLT sector, with a fading phase in the regime of mantle precipitation. During strongly southward IMF condi-tions (regime II), the intense PMAF activity is replaced by a more latitudinally restricted, but longitudinally wide aurora of moderate intensity. The latter auroral state is accompa-nied by a 2-cell convection pattern which is rather symmetri-cal about noon. This state is very different from the convec-tion/FAC configuration present during IMF regime (I), with its strong zonal flows (convection current), more intense FAC sheets and PMAF activity in the midday sector. The strong
Correspondence to:P. E. Sandholt ([email protected])
IMF regulation of the dayside BPS aurora, consisting of keV electrons, and its location with respect to the green line au-roral gap (precipitation void), indicate that it is an impor-tant signature of the reconnection process, located on open boundary layer field lines. The observed longitudinal bifur-cation of the auroral brightenings (EBIs) preceding PMAFs is consistent with antiparallel magnetopause reconnection. Key words. Magnetospheric physics (auroral phenomena magnetopause, cusp, and boundary layers: solar wind-magnetosphere interactions) – Ionosphere (particle precipi-tation)
1 Introduction
Large statistical surveys have demonstrated that the various plasma populations of the dayside magnetosphere are mani-fested in corresponding particle precipitation regimes, as ob-served from satellites in polar orbit (Newell and Meng, 1988; Newell et al., 1989; Newell and Meng, 1994). While statisti-cal satellite data gives the general (averaged) precipitation pattern, case studies of ground observations of the aurora provide detailed information on the spatio-temporal structure of the precipitation pattern within the restricted fields of view of the ground instruments. Specifically, the magnetospheric response to the variable solar wind/IMF conditions can be monitored from the local ground auroral observations.
The control of dayside auroral activity by IMF parame-ters, such as the clock angle (θ) and the IMF By polarity, has been shown in previous work (Sandholt et al., 1998b). The clock angle is the polar angle of the IMF in GSMY–Z
are typically preceded by so-called equatorward boundary in-tensifications (EBIs) (Sandholt and Farrugia, 2003; Sandholt et al., 2003). In this study the detailed morphology and IMF regulation of the dayside aurora is probed further. We se-lected a 2-h long IMF interval on 8 December 1999, where (i) the IMF clock angle varies over its whole range (0–180◦),
(ii) both abrupt as well as smooth IMF changes occur, (iii) intervals of strongly northward and strongly southward IMFs are present, and (iv) there is an interval where the IMF lies in an “intermediate” (θbetween 90 and 135◦) state of
orien-tation.
Using meridian scanning photometers (MSP) and all-sky camera (ASC) images we detail the response phenomenol-ogy in the dayside aurora, illustrating radically different re-actions to these various IMF states/rotations. We achieve a comprehensive, detailed description of the auroral response to the IMF orientation, as parameterized by the clock an-gle (θ) and the ratio |By/Bz|, in the MLT region 09:00– 12:00 MLT.
Particular attention is directed to the different auroral responses observed when the IMF points strongly south (135◦<θ <180◦) compared to that which we document for
the “intermediate” clock angle regime (90◦<θ <135◦). We
find that, in contrast to the intense and active response evi-dent over a wide latitude range for the “intermediate” regime, the former state is characterized by the absence of PMAF transients. The aurora in this state (strongly south IMF) configures as a longitudinally wide band (expanded cusp) of moderate intensity, located, by comparison, at lower lati-tudes.
The dayside auroral morphology reported here in-volves the following particle precipitation regimes: (i) central plasma sheet (CPS), (ii) precipitation void, (iii) dayside boundary plasma sheet (BPS), and (iv) LLBL/cusp/mantle (Newell and Meng, 1994). The particle precipitation counterpart to the auroral forms is documented by combining ground and satellite observations, as has been done in previous studies (see, e.g. Denig et al., 1993).
Of great interest to us in this study is the role of the dayside BPS aurora in a reconnection setting. At this point we note that our dayside BPS corresponds to the particle precipitation regime referred to as the “soft electron zone” (SEZ) by Lyons et al. (1996). In previous studies it has been pointed out that events of transient magnetopause reconnection may leave an important imprint in the dayside BPS precipitation and its as-sociated aurora (Sandholt and Newell, 1992; Sandholt et al., 1993; Kan et al., 1996; Oksavik et al., 2000). In this paper we document the strong and rapid IMF regulation of the day-side BPS aurora. This IMF regulation, in combination with the presence of a precipitation void (and associated gap in the green line auroral emission) at its equatorward edge, in-dicates that it is located on open field lines. The precipitation void between the CPS and BPS regimes is likely a signature of the escape of CPS electrons to the magnetosheath, along newly-opened field lines (Scholer et al., 1981, 1982). Our inference concerning the location of the BPS aurora with re-spect to the open-closed field line boundary is in agreement
with the reasoning of Lockwood et al. (1996) and Lockwood (1997).
According to the observations reported in this paper, the most spectacular auroral response to reconnection events occurs for IMF clock angles in the intermediate regime (|By|/|Bz|≥1). It consists of the following scenario in the ∼08:00–15:00 MLT/70-80◦MLAT sector: (i)
near-simultaneous activations of BPS auroral forms in the pre- and postnoon sectors, each of which is moving noon-ward, followed by (ii), PMAFs which are moving northwest or northeast, depending on theBy polarity, and (iii), a fad-ing phase, characterized by predominantly poleward motion, within the regime of mantle precipitation.
2 Data presentation
2.1 Interplanetary observations
Figure 1 shows interplanetary parameters from spacecraft Wind for the interval 07:00–09:00 UT on 8 December 1999. We have included the ratio|By|/|Bz|, which gives extra in-formation, in addition to the clock angle, and which past work has shown to be a useful parameter in discussions of ionospheric convection (Knipp et al., 1993; Freeman et al., 1993; Greenwald et al., 1995; Ruohoniemi and Greenwald, 1996).
The 2-h-long interval may be divided into subintervals, ordered by the clock angle, θ, as indicated by the vertical guidelines. We note the following features:
(i) a high speed solar wind (V∼550 km/s) of stable plasma parameters and dynamic pressure∼1.5-2 nPa, and (ii) a fairly steady IMF amplitude of strength∼5 nT, whose orientation is strongly variable.
The vertical guidelines A–G indicate times we shall examine in detail. In particular, we want to focus on these IMF fea-tures:
(i) A–B: strongly northward IMF orientation, (ii) B: sharp southward turning, (iii) C–D: strongly southward IMF (|By|/|Bz|<1), (iv) D:By andBz polarity reversals, (v) D– E:By negative interval, contrasting with the otherwise pre-dominantly positiveBy, (vi) F–G: excursion from a brief en-try into the “intermediate” clock angle regime (90-135◦) to
strongly south (θ >135◦) and back to “intermediate”.
With Wind located behind the dawn terminator at
(−37,−59,2)RE, we estimate a negligible propagation Wind-magnetopause. This estimate is in good agreement with the ground-based observations presented later in the pa-per. While Wind’s Y-coordinate is large, we note that this is of the order of the estimated coherence length of the solar wind/IMF structures in theY-direction (Matsui et al., 2002). 2.2 Auroral observations
Fig. 1. Solar wind plasma and IMF data obtained from Wind during the interval 07:00–09:00 UT on 8 December 1999. Panels from top to bottom show: proton density, bulk velocity, proton temperature, solar wind dynamic pressure, interplanetary magnetic field (IMF) componentsBx,By,Bz, the field magnitude, the IMF clock angle, and the ratio|By/Bz|. Field orientation regimes are marked by vertical
guidelines A–G.
be placed on the response to the IMF variability, which is il-lustrated by the vertical guidelines A–G. The presentation below is mostly, but not always, in chronological order. The exception is the presentation of ASC data for the subinter-val of strongly northward IMF orientation (A–B). Since the latter data are included as a contrast to the data represent-ing southward IMF conditions (the main focus in this paper), they come after the presentation of the southward IMF au-rora in interval B–C. While meridian scanning photometer (MSP) data are shown in two wavelength channels (630.0 and 557.7 nm) for the whole interval, all-sky camera (ASC) data are shown for more limited intervals, which are selected with the purpose of illustrating main features of the 2-D auro-ral response. We also note that in the ASC data presentation we apply the following three options: (i) red line only, (ii) green line only, and (iii) both. The reasons are the following. When the features we want to expose are clearly expressed in one channel (the second channel does not add much) we se-lect the channel showing the features most clearly. For
exam-ple, as the BPS and type 2 aurorae appear most clearly in the green line emission, we show that channel only. (Also note that MSP data for the whole period are shown in both emis-sion lines). On the other hand, since most type 1 features, like the PMAFs, typically appear strongly in both emissions, we decided to give one example in both channels.
2.2.1 Interval 07:00–08:10 UT
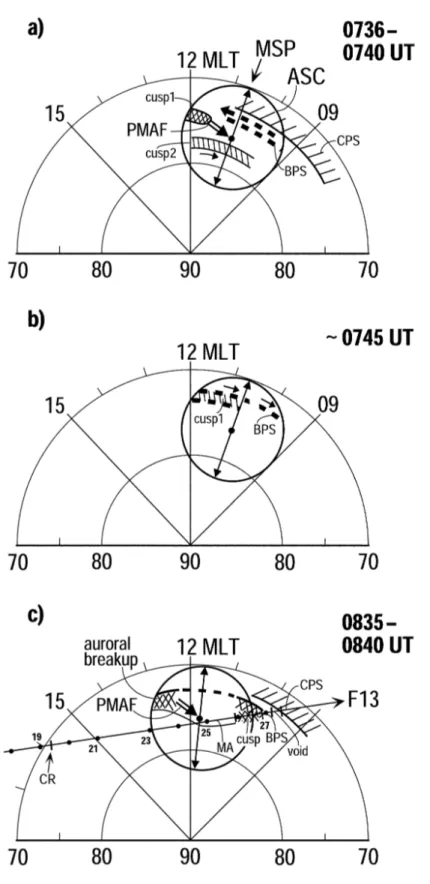
The most relevant meridian scanning photometer (MSP) and all-sky camera (ASC) data for this interval are shown in Figs. 2 and 3, respectively. The observation geometry and a summary of main features of the observations are given in Fig. 4.
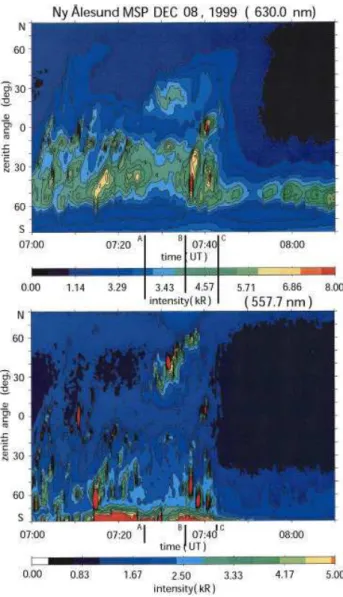
se-Fig. 2.MSP observations from Ny ˚Alesund: Auroral line of sight intensities versus zenith angle for the interval 07:00–08:10 UT. The auroral red (630.0 nm) and green (557.7 nm) lines are shown in the upper and lower panels, respectively. Intensity scales in kilo-Rayleighs (kRs) are given at the bottom of each panel. Times corresponding to specific features in the IMF, shown in Fig. 1, have been marked by vertical guidelines (A–C) in the figure. Intensity scale is given at the bottom of each panel.
lected because they are most sensitive to the precipitation of magnetosheath-origin electrons and low-altitude electron ac-celeration events, respectively (Rees and Luckey, 1974; Rees and Roble, 1986). Auroral events responding to IMF changes marked A, B, and C in Fig. 1 have been indicated in the fig-ure. The top two panels of Fig. 4 summarize the observa-tional phenomenology at the indicated times, the first refer-ring to interval B–C, and the second to the time after C, when the IMFBzis strongly south.
The strong IMF north orientation during interval A–B is seen to elicit a form to the north of zenith, in both emission lines (Fig. 2). This type 2 aurora is marked as cusp 2 in Fig. 4a.
Before the northward turning at A, during 07:00– 07:25 UT, two different auroral types are present. A diffuse, green line aurora is hovering at the southern horizon. This
aurora is absent in the red line emission and is attributed to the precipitation of central plasma sheet (CPS) electrons. It is referred to as CPS in Fig. 4a. Poleward of this is a latitudi-nally wide region containing two auroral bands, prominent in both emission lines. The poleward boundary of this aurora, which is characterized by strong temporal variability, is lo-cated near the zenith of the station (76◦MLAT). This aurora
is referred to as boundary plasma sheet (BPS) in Fig. 4a. We note that the intensity of this aurora is much reduced in the interval marked A–B, corresponding to strongly northward IMF orientation, when the type 2 cusp aurora is present to the north of zenith.
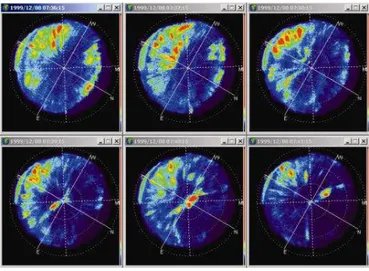
Fig. 3.ASC images at 557.7 nm from Ny ˚Alesund, representing the times 07:36:15, 07:37:15, 07:38:15, 07:39:15, 07:40:15, and 07:41:15 UT
(sequence order: upper panel from left to right, then lower panel in same order). The reference grid is zenith angle (circles at 30, 60, 90◦),
azimuth angle (straight dashed lines). The MSP scanning meridian (see Fig. 4) is marked north (N) – south (S). The integration time is 1 s.
2.2.2 Southward turning at B–C
The BPS aurora reappeared at full intensity after the south-ward turning at B (see Fig. 2). Three distinct brighten-ings are seen in the green line panel of Fig. 2 during in-terval B–C (07:35–07:42 UT). Figure 3 shows an ASC im-age sequence of the green line emission covering the interval 07:36–07:41 UT (i.e. B–C, just after the southward turning at B). The white lines indicate the geomagnetic orientation. N-S corresponds to the MSP scanning meridian. The cir-cles give the zenith angle (30, 60, 90◦). The field of view
(FOV) in the north-south direction is approximately from 70 to 80◦MLAT. We note the high degree of fragmentation
in the two bands of BPS aurora, located within 30–70◦SZ
(south of zenith) in the green line emission. The intensifica-tion of the southernmost of these bands is accompanied by eastward motion (toward noon). The latter motion is marked by the solid arrow in Fig. 4a.
South of the fragmented bands (BPS), and separated by a precipitation void (particularly clear in the 07:37 UT im-age), is a more diffuse emission which is of CPS origin, seen clearly both in Fig. 3 and at the southern boundary of the FOV in Fig. 2. The type 2 aurora in the north is evident in Fig. 3 up to 07:39 UT, corresponding to about 3 min after the southward turning of the IMF. Thereafter it is totally ab-sent. The contrast to the strong BPS aurora present in Fig. 3 is seen in Fig. 5, representing interval A–B (IMF strongly north). Here the BPS aurora south of the zenith is very weak, and the type 2 form (northward IMF cusp aurora) to the north (30–50◦NZ) is strongly present.
There are three auroral effects at time C, i.e. when the IMF becomes strongly south: (1) the CPS aurora, which had been hovering on the southern boundary, disappears from the FOV. This is synonymous with a shrinkage of the closed field line region, reflecting an earthward displacement of the mag-netopause during dayside magnetospheric erosion. (2) The
fragmented BPS bands move out of the MSP FOV to the west (Fig. 4, second panel). (3) Along the MSP meridian these BPS arcs are replaced by a band of red line emission (Fig. 2, top panel). This is a manifestation of the longitudinal expan-sion of the cusp, as indicated in the Fig. 4b schematic under cusp 1.
2.3 Interval 08:10–09:20 UT
Figure 6 gives MSP data for the interval 08:10–09:20 UT. The red and green line emissions are shown in the upper and lower panels, respectively. We shall focus on the strong au-roral brightening marked D, as well as the poleward moving auroral forms (PMAFs) marked F and G. After∼09:05 UT (event H) the aurora configures in two latitudinally sepa-rated forms, which is a typical auroral feature during By -dominant IMF orientation (not shown in Fig. 1). The lati-tudinal separation can be seen in both channels during the interval 09:05–09:20 UT. The northernmost branch is rather weak until∼09:15 UT, after which it becomes the dominant branch. The strong activation of the northernmost branch at 09:18 UT (event I) is the response to a sharp northward turn-ing of the IMF, recorded by Wind at 09:20 UT (not shown). 2.3.1 Response toBypolarity switch at D
The relatively long interval of strongly south IMF orientation (after C) ended by a sharp northward turning at 08:13 UT (Wind time), marked D in Fig. 1. This IMF discontinuity triggered a 5- min long, strong auroral event from 08:14 UT onwards (Fig. 6). After the sharp IMF discontinuity,Bywas strongly negative (∼ −5 nT) and Bz slightly positive for ∼4 min.
merid-Fig. 4.Schematic overview of auroral observations during the intervals(a)07:36–07:40 UT (upper panel),(b)∼07:45 UT (middle panel),
and(c)08:35–08:40 UT. The coordinate system is MLT/MLAT. Fields of view of the all-sky camera and the MSP (at 630.0 nm) in Ny
˚
Fig. 5. ASC images at 557.7 nm from Ny ˚Alesund, representing the times 07:28:15, 07:29:15, 07:30:15, 07:31:15, 07:32:15, and 07:33:45 UT. Same format as in Fig. 3.
ian (N–S) before expanding rapidly eastward, across noon. This eastward direction of motion of the cusp aurora is at-tributed to the negativeBypolarity. Examples of westward expanding auroral events during positiveBy conditions are given below.
2.3.2 Events F and G (classical PMAFs)
Figure 6 shows two classical PMAFs marked F and G. The onsets of the two events, as they appear in these MSP records, are separated in time by 17 min. The corrsponding IMFθis
∼135◦, and|B
y|/|Bz| ∼1, as shown in Fig. 1.
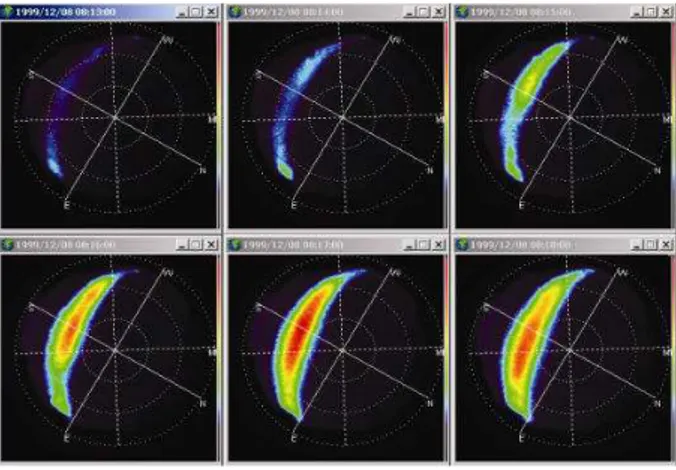
The red and green line ASC observations for event F are shown in Figs. 8 and 9, respectively. (We note that the colour scales in Fig. 7 and Fig. 9 are different.) As revealed by these illustrations the auroral phenomenon may be divided into two phases. The major initial activation occurs on the eastern boundary of the FOV. A less intense activation is also seen at the western boundary of the FOV. A clear “midday gap” is seen between the prenoon and postnoon activations. This “midday gap” is marked by a dashed line in Fig. 4c. A rapid westward advance of the major activation (postnoon side) oc-curs during 08:35–08:37 UT, and then a poleward expansion takes place. The two phases may be considered as approx-imately sequential. As revealed by the green line emission shown in Fig. 9 the event started to fade at 08:40 UT, at the latitude of the ground station (76◦MLAT). This
expan-sion of the event is also illustrated in Fig. 4c, specifically the PMAF with an arrow pointing northwest, thus capturing the two components of the motion. We note that the direction of the longitudinal expansion is opposite to that discussed above for the reverseBypolarity (event D).
Figure 4 shows, in addition, particle precipitation regimes as inferred from a DMSP F13 pass during the interval 08:18– 08:30 UT (see below).
2.3.3 Interval between events F and G (08:40–08:53 UT) We recall from Fig. 1 that this interval corresponds to a strongly south IMF orientation, with 135◦<θ <170◦ and
|By|/|Bz|<1. The initiations of the two PMAFs F and G correspond to the boundaries of this interval when this ratio is≈1 andθ∼135◦.
The auroral state in interval F–G is the same as that for the interval of strongly southward IMF between C and D (see Fig. 2), which was also characterized by an east-west elongated cusp band of moderate intensity (compared to the PMAFs) and the total absence of PMAFs. Thus, this ab-sence is not due to the periodicity of the PMAFs, because its duration (17 min from onset to onset) is much longer than typical PMAF recurrence periods (5–10 min). Rather, it is a response to the external IMF conditions, i.e. the strongly south IMF orientation.
We thus conclude that the upper limit on θ for PMAF activity is around 135–150◦. For larger clock angles,
PMAF activity is replaced by a longitudinally extended band of cusp emission at reduced intensity (Fig. 2,
07:40–08:10 UT; Fig. 6, 08:40–08:53 UT). The auro-ral response to the strongly south IMF condition cor-responds to the “cusp state” which is referred to in the literature as “opening the cusp” (Crooker et al., 1991). The longitudinal expansion in our case is schematically indicated in Fig. 4c. In the same figure (panel c) the reduced auroral intensity during the interval between PMAFs (F–G) is illustrated by a dashed curved line marking the cusp equatorward boundary.
2.4 Ground magnetic disturbance
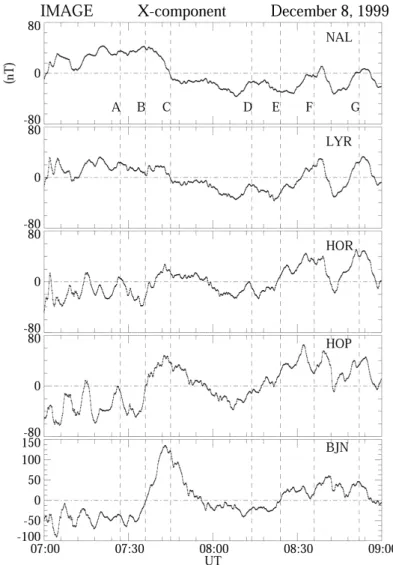
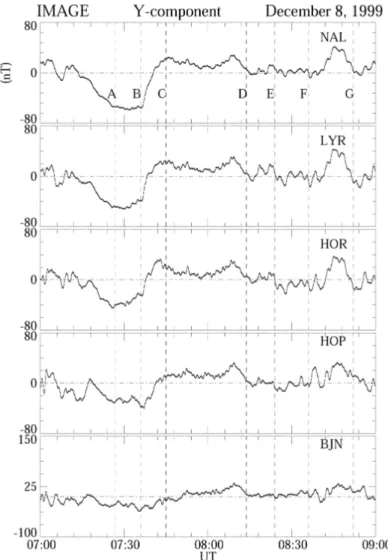
Figure 10a shows X- and Y-component magnetic deflections from the IMAGE stations on Svalbard (see http://www.geo.fmi.fi/image/). The stations are listed according to magnetic latitude, from north to south, spanning the range from 75–71◦MLAT. The northernmost
station, Ny ˚Alesund (NAL), is the optical site. The magnetic coordinates (CGM lat.; long.) of the stations are: NAL (75.25; 112.08); LYR (75.12; 113.00); HOR (74.13; 109.59); HOP (73.06; 115.10); BJN (71.45; 108.07).
Events marked in the IMF data (Fig. 1) and showing cor-responding signatures in the aurora have been marked by the vertical guidelines A–G in Fig. 10a. We note the following features: (i) the presence of Pc5 magnetic pulsations at the lowest-latitude station (BJN) during 07:00–07:35 UT (up to B), (ii) Pc 5 pulsations at BJN are replaced by a strong con-vection bay (positiveX) at 07:35 UT (B–C), (iii) the high-latitude convection bay (positive X; negative Y) at station NAL ended at 07:40 UT (after southward turning), while the lower-latitude convection bay at BJN-HOR strengthened during the interval 07:35–07:43 UT (B–C), (iv) negative
X-deflection beginning (at HOR) at 08:13 UT (D), (v) pos-itiveX-deflection at HOR-HOP-BJN at 08:22 UT (E), and (vi) strong convection bays, extending to high latitudes (sta-tion NAL), centered at 08:35 UT (F) and at 08:42 UT (G).
We note that the high-latitude event at A–B ocurred dur-ing intervals of strongly northward IMF orientation, charac-terized by the presence of a strong type 2 cusp aurora. In a previous study we have shown that this type of magnetic de-flection (positiveX; negativeY) is due to sunward polar cap (lobe cell) convection (Sandholt et al., 1999).
The two events of positiveX-deflection marked F and G are clearly associated with the two major auroral breakup events/PMAFs described in the auroral section. We shall focus on two types of magnetic disturbance. While events F and G are characterized by magnetic deflection of type I (positiveX; minorY), the other type, which we call II (small
Fig. 7. ASC images at 630.0 nm from Ny ˚Alesund, representing the times 08:13:00, 08:14:00, 08:15:00, 08:16:00, 08:17:00, and 08:18:00 UT. The reference grid is zenith angle (circles at 30, 60, 90deg) azimuth angle (straight dashed lines). The MSP scanning meridian (see Fig. 4) is marked north (N) — south (S). The integration time is 2 s.
Fig. 8. ASC images at 630.0 nm from Ny ˚Alesund, representing the times 08:35:00, 08:36:00, 08:37:00, 08:38:00, 08:39:00, and 08:40:00 UT. The format is the same as in Fig. 3.
Fig. 10a. Panels(a)and(b) showX- andY-component magnetic deflections, respectively, at the IMAGE Svalbard stations during the interval 07:00–09:00 UT on 8 December 1999. The stations acronyms are NAL (the optical site), LYR, HOR, HOP, and BJN, spanning the
latitude range 76–71◦MLAT. The deflection scale is given along the vertical axis on the left side. Events in the IMF data and in the auroral
records are marked by vertical guidelines A–G.
sector, and (II) the more symmetrical 2-cell pattern (see dis-cussion section).
2.5 DMSP observations
Figure 11 shows DMSP F13 data obtained during the inter-val 08:21–08:30 UT on 8 December 1999. The satellite track for the interval 08:18–08:28 UT is indicated in Fig. 4. From the latter figure we can see that the satellite crossed the field of view of the MSP in Ny ˚Alesund, in the close vicinity of the station, at 08:24:45 UT, near 11:30 MLT/76◦MLAT. At
this time structured electron precipitation in the energy range 30–400 eV is observed. This is the type of precipitation of-ten observed in the regime called the mantle (poleward of the cusp) during southward IMF conditions (Newell et al., 1991; Newell and Meng, 1994). From the MSP records in Fig. 6 we can see that the cusp aurora at this time (see arrow in the MSP figure) is centered at∼40◦south of zenith in Ny
˚
Alesund (at∼73–74◦MLAT). A weak PMAF is approaching
the zenith of the station. A patch of cusp-type energy spec-trum of the ion-electron plasma is co-located with a chan-nel of enhanced antisunward convection, recorded by the satellite in the 10:30–11:00 MLT/73–74◦MLAT sector
Fig. 10b.See Fig. 10a.
The magnetic deflections recorded from F13 (not shown) indicate the presence of a downward directed cusp current during 08:26–08:27 UT and an upward directed mantle cur-rent during 08:24–08:26 UT. The latter curcur-rent is intensified (steeper gradient) during 08:25:30–08:26:00 UT.
The precipitation recorded from DMSP F13 at
∼72.8◦MLAT/10:00 MLT (08:27 UT), which we refer
to as BPS, characterized by keV electrons, corresponds to the aurora (fragmented arcs/bands) called dayside BPS in Fig. 4a, representing 07:36–07:40 UT (see MSP and ASC data in Figs. 2 and 3). We note that the two precipitation features observed at 07:35–07:40 UT and at 08:27 UT, re-spectively, occur in the same local time sector (∼10:00 MLT) and correspond to very similar IMF conditions (see Fig. 1).
3 Discussion
3.1 Summary of observations
We have documented in a case study the detailed phe-nomenology of the dayside auroral response to changing
IMF orientations as given by the clock angleθ and the ra-tio |By|/|Bz|. In this study we show examples from the 09:00–12:00 MLT sector. Two distinct auroral configurations are seen corresponding respectively to the (I) “intermediate” clock angle regime (By–dominant;θ: 90–135◦), and (II) the strongly southward-pointing IMF (θ: 135–180◦).
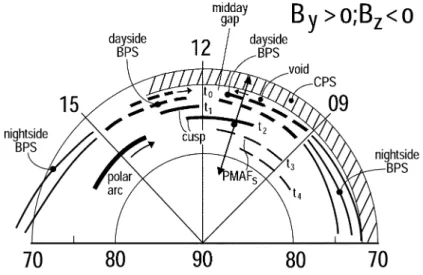
During the “intermediate” clock angle range, underBy > 0 conditions, the auroral configuration appears as indicated in Fig. 12. Progressing from lower to higher latitudes, we find the following auroral forms:
(i) At the lowest latitudes (∼70◦MLAT and below) there is
the diffuse aurora of CPS origin.
(ii) Contiguous to this and on the poleward side is a gap in the green emission, corresponding to a precipitation void (Sand-holt et al., 2002a).
ob-Fig. 11. Particle spectrograms and ion drift obtained from spacecraft DMSP F13 during the interval 08:21–08:30 UT on 8 December 1999. Panels 1 and 2 show differential energy flux for electrons (solid) and ions (dashed) and average energy, respectively. Panels 3 and 4 show color-coded particle spectrograms for electrons and ions, respectively. Panel 5 show ion drift in the horizontal (cross track; violet) and vertical (upward; green) directions. Different precipitation regimes are marked by vertical guidelines. The precipitation void at the equatorward boundary of the BPS regime is marked by an arrow.
Fig. 12.Schematic overview of the dayside auroral configuration in MLAT/MLT coordinates for the “intermediate” clock angle regime (IMF
By>0 conditions). Auroral forms are named after their respective particle precipitation sources. Auroral motions are indicated by arrows.
The spatio-temporal evolution of the auroral response (PMAF activity) to magnetopause reconnection events (FTEs) is indicated by labels
t0–t4. The field of view of the MSP in Ny ˚Alesund (at∼08:00 UT) is marked by double-arrowed meridional line.
served in the morning and evening sectors. The latter forms are marked at nightside BPS in Fig. 12. Our distinction be-tween dayside and nightside BPS aurorae corresponds to the categories corona and multiple arcs, respectively, in the ter-minology of Yang et al. (2000).
(iv) Poleward of the dayside BPS aurora is the transient PMAF activity (marked cusp 1/PMAFs in the figure). In the case illustrated (By >0; Northern Hemisphere) they move westward and poleward. The east-west motion is reversed for the oppositeBypolarity.
A central question in this study is how the dayside auro-ral pattern responds to southward turnings of the IMF and
the associated reconnection enhancements. In this study we document the following response scenario for different times (t0,t1,t2,t3,t4), when the IMF orientation after the
south-ward turning is characterized by a clock angle in the range 90–135◦(the “intermediate” state):
t0: intensification/activation and noonward motion of the
fragmented bands of dayside BPS origin.
t1–t2: westward and poleward expansion of cusp 1 aurora
(PMAFs).
t3–t4: poleward PMAF motion in the fading stage.
au-Figure 13
Fig. 13.Schematic overview of the IMF regulation of the green line aurorae, as monitored by the meridian scanning photometer (MSP; see the lower panel). The zenith angle of the MSP records is shown along the vertical axis in the lower panel. North is up. The upper panel shows the essential features of the variability of the IMF clock angle. Clock angle regimes I and II are deliminated by horizontal lines. The
interval shown is 07:10–09:00 UT, representing the∼10:00–12:00 MLT sector.
roral characteristics are observed: (i) A weaker and more latitudinally restricted, but longitudinally wide auroral band, compared to the PMAF activity. This state is schematically illustrated in Fig. 4b. The equatorward boundary of this rora is often located at a lower latitude than the cusp 1 au-rora during aBy-dominant IMF orientation (see, e.g. Sand-holt et al., 2003). The more equatorward displacement of the cusp in this state is an indication of strong erosion. This is the aurora corresponding to the expanded cusp (Crooker et al., 1991). Further documentation of the auroral signature of the expanded cusp following a strong southward turning of the IMF, is given by, e.g. Sandholt et al. (1998b).
(ii) The auroral activity referred to as PMAF activity is ab-sent, as exemplified by the interval marked C–D and the 13-min interval between events F and G in the present case. Thus, we find that the PMAF activity is limited to a more narrow clock angle regime (∼90–140◦) than usually thought
(on this point, see also Drury et al., 2003). By the term PMAF activity we mean an equatorward boundary intensi-fication (EBI), manifest in the BPS aurora, followed by the activation of a cusp form (LLBL/cusp/mantle precipitation) which is moving northwest or northeast, depending on the IMFBypolarity, as described above. The strong erosion tak-ing place durtak-ing IMF state II (strongly south) is seen in our case as the equatorward advance of the poleward boundary of the CPS aurora at event C (see lower panel of Fig. 2).
An additional feature to notice in the auroral observations is that the initial appearance of brightening events occur in the prenoon (event D) or postnoon (events F and G) sec-tors, depending on the IMFBypolarity (see also Moen et al., 1999). This is consistent with the IMFBy-related longitu-dinal shift of the center of the cusp precipitation reported by Newell et al. (1989). These observations may be ex-plained by the partial penetration of IMFBy into the mag-netosphere (see, e.g. Cowley, 1981).
A schematic illustration of the IMF regulation of dayside aurorae during the interval 07:10–09:00 UT, representing the
∼10:00–12:00 MLT sector, is shown in Fig. 13. We note the following features: (i) IMF regulation of the dayside BPS aurora, illustrated by its disappearance during the interval of strongly northward IMF (A–B), and its re-appearance at the time of the rapid southward turning at B, (ii) appearance of a polar arc at the cusp poleward boundary in interval A–B, (iii) equatorward expansion (disappearance from the FOV) of the poleward boundary of the CPS aurora at C (erosion event; marked by arrow in Fig. 13), (iv) the presence of “mid-day gap” aurora (absence of PMAFs; moderate auroral inten-sity) during intervals of strongly southward IMF (clock an-gle regime II), (v) activation of transient type 1 cusp aurora (strong red line emission) at the time of the IMF directional discontinuity at D, (vi) activations of classical PMAFs at the time of transitions of the clock angle from regime II to regime I (at F and G).
3.2 Elements of interpretation
It is suggested that the two dayside auroral configurations present during the “intermediate” clock angle regime (I) and the strongly south IMF orientation (II), correspond, respec-tively, to two different plasma convection/field-aligned cur-rent configurations: (I) a distorted cell versus (II) a 2-cell pattern which is rather symmetrical about noon (see, e.g. Cowley, 2000). This interpretation is supported by the ground magnetometer data reported in this paper. The mag-netic disturbance during the intervals of strongly southward IMF (07:50–08:10 UT and 08:40–08:50 UT) are very similar (Xcomponent dips; strong, positiveYdeflection) and differ-ent from that during the “intermediate” clock angle regime (interval B–C and events F and G). The strong, positiveY
IMF orientation is consistent with the expected antisunward convection (sunward Hall current) in a symmetrical 2-cell pattern. Events F and G are, on the other hand, charac-terized by positive X-deflections, and minor Y-deflection, which reflect a convection pattern (convection currents) con-taining a strong (dominant) zonal component (westward convection/eastward Hall current).
The rather symmetrical 2-cell convection pattern and lon-gitudinally expanded cusp during strongly southward IMF may imply less intense field-aligned currents (FACs) at noon (see, e.g. Iijima and Potemra, 1976b,a, 1978), compared to the high current intensities, in the form of strong sheet cur-rents, associated with the zonal flow, during the intervals when a strong IMFBy component is present. The reduced local current intensity near magnetic noon is consistent with the depressed auroral intensity observed in interval C–D, compared to that during the events of PMAF activity (F and G).
Previously, it has been pointed out that the IMFBypolarity is essential for the motion pattern of PMAFs. The present ob-servations highlight the importance of IMFBy(|By|/|Bz|≥1) for the occurrence of PMAF activity. According to this inter-pretation, the 17-min long interval between onsets of events F and G is not due to a natural (intrinsic) recurrence time of PMAFs, which is much shorter (Fasel, 1995), but is rather due to the fact that the required external condition for PMAF occurrence (|By|/|Bz|≥1) is not generally satisfied during this interval. In view of the previously established associa-tion between FTEs and PMAFs (Sandholt et al., 1986; Lock-wood et al., 1990; Elphic et al., 1990; Fasel, 1995), the ob-servation of the absence of PMAFs during intervals of small or zero IMF By component, may indicate that a so-called guidefield along the reconnection line (see, e.g. Siscoe et al., 2001) is a necessary condition for transient reconnection. We note, however, that such an effect has not been seen in statistical studies of the IMF regulation of FTE occurrence (Berchem and Russell, 1984; Kawano and Russell, 1997).
An interesting aspect of the observations is the presence of a longitudinal “gap” (weak background) in the auroral emis-sion, located between clear cusp activations in the prenoon and postnoon sectors, during the time of PMAF activity (see ASC data in Fig. 8 and Fig. 4c for a schematic illustration). This auroral “gap” seems to be consistent with the predicted ionospheric signature of antiparallel reconnection at the day-side magnetopause (Crooker, 1979; Luhmann et al., 1984; Coleman et al., 2001; Rodger et al., 2003). Furthermore, the existence of a restricted IMF clock angle regime (∼90–140◦)
which is favourable for PMAF occurrence, may also indicate that this auroral phenomenon is a signature of high-latitude, antiparallel reconnection.
On the high-latitude aurora present during the interval of strongly northward IMF (A–B) we note the following. It seems that this aurora, often referred to as type 2 cusp (see Fig. 4a), involves electron precipitation at higher energy than in the type 1 cusp. In the present case this may be inferred from the strong green line intensity. We suggest two pos-sible reasons: (i) different acceleration mechanisms at high
and low magnetopause latitudes (Frey et al., 2003; Østgaard et al., 2003), and (ii) the presence of polar arcs at the cusp poleward boundary during northward IMF orientation (Sand-holt et al., 2001, 2002b). The latter is due to current continu-ity requirements (see, e.g. Reiff et al., 1978) at the poleward boundary of a plasma convection channel in the northward IMF cusp aurora (see illustration in Sandholt et al., 1998a, their Fig. 10).
Next we discuss the question of the dayside BPS aurora in relation to the open-closed field line boundary. Accord-ing to Kan et al. (1996), the auroral response to reconnection events (FTEs) consists of two parts, (i) “the poleward mo-tion associated with the configuramo-tional change and (ii) the noonward motion associated with the convection itself.” The noonward moving auroral forms, which correspond to our BPS aurora, are located on closed field lines, according to Kan. In this paper we document a strong IMF regulation of the dayside BPS aurora. It is observed to be strongly at-tenuated by the sharp northward turning marked (A), but is clearly re-activated by the subsequent southward turning (B). These fast responses to northward and southward turnings of the IMF, are, in our view, an indication that the dayside BPS is located on open field lines, in agreement with Lockwood et al. (1996) and Lockwood (1997). Our observations are also in agreement with the statement by Lyons et al. (1996) “that large portions of the soft electron zone (SEZ) are on open field lines.”
A second argument which supports the same interpretation is the observation of the green line gap in the aurora, and the associated precipitation void (see Fig. 11) separating the BPS and CPS aurorae in our case. This phenomenon can be explained by the escape of CPS electrons along newly-opened field lines (Scholer et al., 1982; Lockwood, 1997). In an auroral context, the green line gap has been observed previously by Joe Minow (personal communication, 1992), and by Sandholt et al. (2002a) and Sandholt and Farrugia (2002).
Based on these two independent and consistent observa-tions, we conclude that the dayside BPS aurora, appear-ing in the form of noonward movappear-ing fragmented bands in the∼09:00–15:00 MLT sector, is an important ionospheric manifestation of the reconnection process. This auroral phenomenon may have interesting implications on the re-connection topology and dynamical behaviour of the recon-nectionX-line (see, e.g. Moore et al., 2002) and the associ-ated boundary layer (Sonnerup and Siebert, 2003) (see their Fig. 8). Details on this are outside the scope of this presenta-tion and will be the topic of a separate paper.
phenomenon (particle precipitation and field-aligned current structure) has been discussed by Eriksson et al. (2002) as a signature of lobe reconnection.
Acknowledgements. The Wind data are courtesy of R. P. Lepping and K. W. Ogilvie. We thank Bjørn Lybekk and Espen Trondsen for technical assistance during the auroral observation campaigns in Ny
˚
Alesund, and with the presentation of the optical data. Magnetome-ter data from the IMAGE chain have been used in this paper. We thank the institutes who maintain the IMAGE magnetometer array. The auroral observation program on Svalbard is supported by the Norwegian Research Council, the Norwegian Polar Research Insti-tute and AFOSR Task 2311AS. This work is supported in part by NASA Living with a Star grant NAG5-12189, NASA Wind grant NAG5 - 11803, and NASA Polar grant NAG5-11676.
Topical Editor T. Pulkkinen thanks two referees for their help in evaluating this paper.
References
Berchem, J. and Russell, C. T.: Flux transfer events on the magne-topause: Spatial distribution and controlling factors, J. Geophys. Res., 89, 6689–6703, 1984.
Coleman, I. J., Chisham, G., Pinnock, M., and Freeman, M. P.: An ionospheric convection signature of antiparallel reconnection, J. Geophys. Res., 106, 28, 995, 2001.
Cowley, S. W. H.: Magnetospheric asymmetries associated with the
Y-component of the IMF, Planet. Space Sci., 29, 79, 1981.
Cowley, S. W. H.: Magnetosphere-Ionosphere Interactions: A Tu-torial Review, in Magnetospheric Current Systems, vol. 118 of Geophysical Monograph Series, 91–106, AGU (American Geo-physical Union), Washington D.C., USA, 2000.
Crooker, N. U., Toffoletto, F. R., and Gussenhoven, M. S.: Opening the cusp, J. Geophys. Res., 96, 3497, 1991.
Crooker, N. U.: Dayside merging and cusp geometry, J. Geophys. Res., 84, 951, 1979.
Denig, W. F., Burke, W. J., Maynard, N. C., Rich, F. J., Jacobsen, B., Sandholt, P. E., Egeland, A., Leontjev, S., and Vorobjev, V. G.: Ionospheric signatures of dayside magnetopause transients: A case study using satellite and ground measurements, J. Geophys. Res., 98, 5969–5980, 1993.
Drury, E. E., Mende, S. B., Frey, H. U., and Doolittle, J. H.: South-ern hemisphere poleward moving auroral forms, J. Geophys. Res., 108(A3), 1114, doi:10.1029/2001JA007536, 2003. Elphic, R. C., Lockwood, M., Cowley, S. W. H., and Sandholt, P. E.:
Flux transfer events at the magnetopause and in the ionosphere, Geophys. Res. Lett., 17, 2241, 1990.
S. B., Hubert, B., Østgaard, N., and Le, G.: Properties of local-ized, high-latitude, dayside aurora, J. Geophys. Res., 108(A4), doi:10.1029/2002JA009332, 2003.
Greenwald, R. A., Bristow, W. A., Sofko, G. J., Senior, C., Cerisier, J.-C., and Szabo, A.: Super Dual Auroral Radar Network radar imaging of dayside high-latitude convection under northward in-terplanetary magnetic field: Toward resolving the distorted two-cell versus multitwo-cell controversy, J. Geophys. Res., 100, 11 805, 1995.
Iijima, T. and Potemra, T.: Large scale characteristics of field-aligned currents associated with substorms, J. Geophys. Res., 83, 599–615, 1978.
Iijima, T. and Potemra, T. A.: Field-aligned currents in the dayside cusp observed by Triad, J. Geophys. Res., 81, 5971, 1976a. Iijima, T. and Potemra, T. A.: The amplitude distribution of
field-aligned currents at northern high latitudes observed by Triad, J. Geophys. Res., 81, 2165, 1976b.
Kan, J. R., Deehr, C. S., Lyu, L. H., and Newell, P. T.: Ionospheric signatures of the patchy and intermittent reconnection at the day-side magnetopause, J. Geophys. Res., 101, 10 939, 1996. Kawano, H. and Russell, C.: Survey of flux transfer events observed
with the ISEE 1 spacecraft: Dependence on the interplanetary magnetic field, J. Geophys. Res., 102, 11 307, 1997.
Knipp, D. J., Emery, B. A., Richmond, A. D., Crooker, N., Hairston, M. R., Cumnonck, J. A., Denig, W. F., Rich, F. J., de la Beau-jardiere, O., Ruohoniemi, J. M., Rodger, A. S., Crowley, G., Ahn, B.-H., Evans, D. S. Fuller-Rowell, T. J., Friis-Christensen, E., Lockwood, M., Kroehl, H. W., Maclennan, C. G., Mc Ewin, A., Troshichev, O., Sato, N., Sutcliffe, P., and Tomlinson, L.: Iono-spheric convection response to slow, strong variations in a north-ward interplanetary magnetic field: A case study for January 14, 1988, J. Geophys. Res., 98, 19 273, 1993.
Lockwood, M.: Relationship of dayside auroral precipitations to the open-closed separatrix and the pattern of convective flow, J. Geophys. Res., 102, 17 475, 1997.
Lockwood, M., Cowley, S. W. H., and Sandholt, P. E.: The search for ionospheric signatures of transient reconnection, Eos Trans., 71, 709, 1990.
Lockwood, M., Cowley, S. W. H., and Onsager, T. G.: Ion accel-eration at both the interior and exterior Alfven waves associated with the magnetopause reconnection site: Signatures in cusp pre-cipitation, J. Geophys. Res., 101, 21 501, 1996.
Luhmann, J. G., Walker, R. J., Russell, C. T., Crooker, N. U., Spre-iter, J. R., and Stahara, S. S.: Patterns of potential magnetic field merging sites on the dayside magnetopause, J. Geophys. Res., 89, 1739, 1984.
campaign, J. Geophys. Res., 101, 27 283, 1996.
Matsui, H., Farrugia, C. J., and Torbert, R. B.: Wind-ACE correla-tions, 1999: An approach through spectral analysis, J. Geophys. Res., 107, 1355, 2002.
Moen, J., Carlson, H. C., and Sandholt, P. E.: Continuous
observa-tion of cusp auroral dynamics in response to an IMFBypolarity
change, Geophys. Res. Lett., 26, 1243, 1999.
Moore, T. E., Fok, M.-C., and Chandler, M. O.: The
day-side reconnection X line, J. Geophys. Res., 107(A10), 1332, doi:10.1029/2002JA009381, 2002.
Neudegg, D. A., Cowley, S. W. H., McWilliams, K. A., Lester, M., Yeoman, T. K., Sigwarth, J., Haerendel, G., Baumjohann, W., Auster, U., Fornacon, K.-H., and Georgescu, E.: The UV aurora and ionospheric flows during flux transfer events, Ann. Geophys., 19, 179, 2001.
Newell, P. T. and Meng, C. I.: The cusp and the cleft/boundary layer: Low - altitude identification and statistical local time vari-ation, J. Geophys. Res., 93, 14 549, 1988.
Newell, P. T. and Meng, C.-I.: Ionospheric projection of magneto-spheric regions under low and high solar wind pressure condi-tions, J. Geophys. Res., 99, 273, 1994.
Newell, P. T., Meng, C.-I., Sibeck, D., and Lepping, R.: Some low-altitude cusp dependencies on the interplanetary magnetic field, J. Geophys. Res., 94, 8921, 1989.
Newell, P. T., Burke, W. J., Meng, C. I., Sanchez, E. R., and Greenspan, M. E.: Identification and observation of the plasma mantle at low altitude, J. Geophys. Res., 96, 35, 1991.
Oksavik, K., Søraas, F., Moen, J., and Burke, W. J.: Optical and particle signatures of magnetospheric boundary layers near mag-netic noon: Satellite and ground-based observations, J. Geophys. Res., 105, 27 555, 2000.
Østgaard, N., Detrick, D., Rosenberg, T. J., Vondrak, R. R., Frey, H. U., Mende, S. B., and H˚aland, S.: High-latitude dayside
en-ergetic precipitation and IMFBz rotations, J. Geophys. Res.,
108(A4), doi:10.1029/2002JA009350, 2003.
Rees, M. H. and Luckey, D.: Auroral electron energy derived from ratios of spectroscopic emissions, J. Geophys. Res., 79, 5181, 1974.
Rees, M. H. and Roble, R. G.: Excitation of O(1D) atoms in aurora
and emission of the [OI] 6300 ˚A line, Can. J. Phys., 64, 1608,
1986.
Reiff, P. H., Burch, J. L., and Heelis, R. A.: Dayside auroral arcs and convection, Geophys. Res. Lett., 5, 391, 1978.
Rodger, A. S., Chisham, G., Coleman, I. J., Freeman, M. P., and Pinnock, M.: Anti-parallel reconnection at the dayside magnetopause: Ionospheric signatures and implications for the low-latitude boundary layer, in Earth’s Low-Latitude Boundary Layer, edited by P. T. Newell and T. Onsager, vol. 133 of Geo-physical Monograph, 311–318, American GeoGeo-physical Union, Washington DC, 2003.
Ruohoniemi, J. and Greenwald, R.: Statistical patterns of high-latitude convection obtained from Goose Bay HF radar obser-vations, J. Geophys. Res., 101, 21 743, 1996.
Sandholt, P. E. and Farrugia, C. J.: Monitoring magnetosheath-magnetosphere interconnection topology from the aurora, Ann. Geophys., 20, 629, 2002.
Sandholt, P. E. and Farrugia, C. J.: The aurora as monitor of so-lar wind-magnetosphere interactions, in Earth’s Low-Latitude Boundary Layer, edited by P. T. Newell and T. Onsager, vol. 133 of Geophysical Monograph, 335–349, AGU, Washington, DC, 2003.
Sandholt, P. E. and Newell, P. T.: Ground and satellite observations of an auroral event at the cusp/cleft equatorward boundary, J. Geophys. Res., 97, 8685, 1992.
Sandholt, P. E., Deehr, C. S., Egeland, A., Lybekk, B., Viereck, R., and Romick, G. J.: Signatures in the dayside aurora of plasma transfer from the magnetosheath, J. Geophys. Res., 91, 10 063, 1986.
Sandholt, P. E., Moen, J., Rudland, A., Opsvik, D., Denig, W. F., and Hansen, T.: Auroral event sequences at the dayside polar cap boundary for positive and negative interplanetary magnetic fieldBy, J. Geophys. Res., 98, 7737, 1993.
Sandholt, P. E., Farrugia, C. J., and Cowley, S. W. H.: Pulsating cusp aurora for northward interplanetary magnetic field, J. Geo-phys. Res., 103, 26 507, 1998a.
Sandholt, P. E., Farrugia, C. J., Moen, J., Noraberg, Ø., Lybekk, B., Sten, T., and Hansen, T.: A classification of dayside auroral forms and activities as a function of IMF orientation, J. Geophys. Res., 103, 23 325, 1998b.
Sandholt, P. E., Farrugia, C. J., Cowley, S. W. H., Lester, M., Moen, J., Lybekk, B., and Trondsen, E.: Excitation and decay of mag-netospheric lobe cell convection and its associated aurora, Geo-phys. Res. Lett., 26, 3597, 1999.
Sandholt, P. E., Farrugia, C. J., Cowley, S. W. H., Lester, M., and Cerisier, J.-C.: Excitation of transient lobe cell convection and auroral arc at the cusp poleward boundary during a transition of the interplanetary magnetic field from south to north, Ann. Geo-phys., 19, 487, 2001.
Sandholt, P. E., Denig, W. F., Farrugia, C. J., Lybekk, B., and Trondsen, E.: Auroral structure at the cusp equatorward boundary: Relationship with the electron edge of low-latitude boundary layer precipitation, J. Geophys. Res., 107(A9), 1235, doi:10.1029/2001JA005081, 2002a.
Sandholt, P. E., Farrugia, C. J., Moen, J., and Denig, W. F.: The cusp in rapid transition, J. Geophys. Res., 107(A12), 1427, doi:10.1029/2001JA009214, 2002b.
Sandholt, P. E., J., M., Farrugia, C. J., Cowley, S. W. H., Lester, M., Milan, S. E., Valladares, C., Denig, W. F., and Eriksson, S.: Multi-site observations of the association between aurora and plasma convection in the cusp/polar cap during a south-eastward (By≃ |Bz|) IMF orientation, Ann. Geophys., 21, 539, 2003.
Scholer, M., Ipavich, F. M., Gloeckler, G., Hovestadt, D., and Klecker, B.: Leakage of magnetospheric ions into the tosheath along reconnected field lines at the dayside magne-topause, J. Geophys. Res., 86, 1299, 1981.
Scholer, M., Hovestadt, D., Ipavich, F. M., and Gloeckler, G.: En-ergetic protons, alpha particles, and electrons in magnetic flux transfer events, J. Geophys. Res., 87, 2169, 1982.
Siscoe, G. L., Erickson, G. M., Sonnerup, B. U. O., Maynard, N. C., Siebert, K. D., Weimer, D. R., and White, W. W.: Global role of
Ekin magnetopause reconnection: An explicit demonstration, J.
Geophys. Res., 106, 13 015, 2001.
Sonnerup, B. U. O. and Siebert, K. D.: Theory of the low-latitude boundary layer and its coupling to the ionosphere: A tutorial re-view, in Earth’s Low-Latitude Boundary Layer, edited by P. T. Newell and T. Onsager, vol. 133 of Geophysical Monograph, 13– 32, American Geophysical Union, Washington, DC, 2003. Yang, H., Sato, N., Makita, K., Kikuchi, M., Kadokura, A.,