ACPD
12, 14447–14482, 2012Modeling SOA formation
B. Aumont et al.
Title Page
Abstract Introduction
Conclusions References
Tables Figures
◭ ◮
◭ ◮
Back Close
Full Screen / Esc
Printer-friendly Version Interactive Discussion
Discussion
P
a
per
|
Dis
cussion
P
a
per
|
Discussion
P
a
per
|
Discussio
n
P
a
per
|
Atmos. Chem. Phys. Discuss., 12, 14447–14482, 2012 www.atmos-chem-phys-discuss.net/12/14447/2012/ doi:10.5194/acpd-12-14447-2012
© Author(s) 2012. CC Attribution 3.0 License.
Atmospheric Chemistry and Physics Discussions
This discussion paper is/has been under review for the journal Atmospheric Chemistry and Physics (ACP). Please refer to the corresponding final paper in ACP if available.
Modeling SOA formation from the
oxidation of intermediate volatility
n
-alkanes
B. Aumont1, R. Valorso1, C. Mouchel-Vallon1, M. Camredon1, J. Lee-Taylor2, and S. Madronich2
1
LISA, UMR CNRS/INSU 7583, Universit ´e Paris Est Cr ´eteil et Universit ´e Paris Diderot, Institut Pierre Simon Laplace, 94010, Cr ´eteil, France
2
NCAR, National Center for Atmospheric Research, Boulder, CO, USA
Received: 24 May 2012 – Accepted: 28 May 2012 – Published: 7 June 2012
Correspondence to: B. Aumont ([email protected])
ACPD
12, 14447–14482, 2012Modeling SOA formation
B. Aumont et al.
Title Page
Abstract Introduction
Conclusions References
Tables Figures
◭ ◮
◭ ◮
Back Close
Full Screen / Esc
Printer-friendly Version Interactive Discussion
Discussion
P
a
per
|
Dis
cussion
P
a
per
|
Discussion
P
a
per
|
Discussio
n
P
a
per
|
Abstract
The chemical mechanism leading to SOA formation and ageing is expected to be a multigenerational process, i.e. a successive formation of organic compounds with higher oxidation degree and lower vapor pressure. This process is here investigated with the explicit oxidation model GECKO-A (Generator of Explicit Chemistry and
Kinet-5
ics of Organics in the Atmosphere). Gas phase oxidation schemes are generated for the C8–C24series ofn-alkanes. Simulations are conducted to explore the time evolution of organic compounds and the behavior of secondary organic aerosol (SOA) formation for various preexisting organic aerosol concentration (COA). As expected, simulation results show that (i) SOA yield increases with the carbon chain length of the parent
10
hydrocarbon, (ii) SOA yield decreases with decreasingCOA, (iii) SOA production rates increase with increasingCOA and (iv) the number of oxidation steps (i.e. generations) needed to describe SOA formation and evolution grows whenCOAdecreases. The sim-ulated oxidative trajectories are examined in a two dimensional space defined by the mean carbon oxidation state and the volatility. Most SOA contributors are not oxidized
15
enough to be categorized as highly oxygenated organic aerosols (OOA) but reduced enough to be categorized as hydrocarbon like organic aerosols (HOA), suggesting that OOA may underestimate SOA. Results show that the model is unable to produce highly oxygenated aerosols (OOA) with large yields. The limitations of the model are discussed.
20
1 Introduction
Fossil fuel and biomass combustion leads to the emission of long carbon chain hy-drocarbons (C>10) in the atmosphere. A large fraction of these Intermediate Volatility Organic Compounds (IVOC) is expected to be first emitted in the condensed phase and rapidly volatilized by atmospheric dilution (Robinson et al., 2007). IVOC are expected
25
ACPD
12, 14447–14482, 2012Modeling SOA formation
B. Aumont et al.
Title Page
Abstract Introduction
Conclusions References
Tables Figures
◭ ◮
◭ ◮
Back Close
Full Screen / Esc
Printer-friendly Version Interactive Discussion
Discussion
P
a
per
|
Dis
cussion
P
a
per
|
Discussion
P
a
per
|
Discussio
n
P
a
per
|
Grieshop et al., 2009). The SOA formation potential was recently examined in labora-tory studies for few IVOC precursors, mostly alkanes (Lim and Ziemann, 2009; Presto et al., 2010), alkenes (Matsunaga et al., 2009), aromatics (Chan et al., 2009) and oxygenated IVOC (Chacon-Madrid and Donahue, 2011). These experimental studies confirmed the high SOA formation potential for such precursors. Furthermore, recent
5
numerical simulations have shown that IVOC are likely a substantial source of SOA in the plume of megacities (e.g., Dzepina et al., 2011; Tsimpidi et al., 2010; Hodzic et al., 2010; Li et al., 2011; Lee-Taylor et al., 2011) and at continental scales (Jathar et al., 2011).
The chemical mechanism leading to SOA formation and ageing is expected to be
10
a multigenerational process, i.e. a successive formation of organic compounds with higher oxidation degree and lower vapor pressure (e.g., Camredon et al., 2007; Kroll and Seinfeld, 2008). Parameterizations were recently developed to describe this pro-cess in a simplified way. For example, multigenerational oxidation is represented in the volatility basis set (VBS) approach by a decrease in the volatility and an increase of
15
the mass after each oxidation step (e.g., Robinson et al., 2007; Grieshop et al., 2009; Donahue et al., 2006, 2011, 2012). These parameterizations are developed with an empirical approach, based on laboratory observations. However, major uncertainties remain concerning these multigenerational processes and, as a result, parameteriza-tions implemented in current models to account for SOA formation and ageing from
20
IVOC precursors are weakly constrained. The development of such parameterizations suffers from a lack of information concerning the chemical mechanism controlling SOA formation and evolution in the atmosphere.
The aim of this study is to explore SOA formation from IVOC precursors using an ex-plicit modeling approach. Alkanes are major contributors to anthropogenic emissions
25
(Calvert et al., 2008; Lim and Ziemann, 2005) and this chemical family was recently used as a substitute for IVOC emissions (Lee-Taylor et al., 2011). Here, we develop explicit oxidation schemes for then-alkane series (C8–C24), using the self-generating
ACPD
12, 14447–14482, 2012Modeling SOA formation
B. Aumont et al.
Title Page
Abstract Introduction
Conclusions References
Tables Figures
◭ ◮
◭ ◮
Back Close
Full Screen / Esc
Printer-friendly Version Interactive Discussion
Discussion
P
a
per
|
Dis
cussion
P
a
per
|
Discussion
P
a
per
|
Discussio
n
P
a
per
|
are used to examine the contribution of the multigenerational process to the time evolu-tion of the gas and aerosol phases. The modeling tools and simulaevolu-tions are presented in Sect. 2 and results are discussed in Sect. 3.
2 Model description
2.1 The GECKO-A mechanisms
5
The development of explicit oxidation schemes for IVOC precursors involves millions of reactions and secondary organic species, far exceeding the size of chemical schemes that can be written manually (Aumont et al., 2005; Goldstein and Galbally, 2007; Kroll et al., 2011). Here, gas-phase oxidation schemes were generated automatically us-ing the Generator for Explicit Chemistry and Kinetics of Organics in the Atmosphere
10
(GECKO-A) (Aumont et al., 2005; Camredon et al., 2007; Valorso et al., 2011). This tool can be viewed as an expert system that mimics the steps by which chemists might develop chemical schemes, i.e. writing the list of the reactions involved in the oxidation of a given species and their associated rate constants.
GECKO-A generates chemical schemes according to a prescribed protocol
as-15
signing reaction pathways and kinetics data on the basis of experimental data and Structure-Activity Relationships (SAR). The protocol is the set of rules that lays out the choice of reaction pathways and estimates the rate coefficients needed in the mecha-nism based on the species’ molecular structure. The protocol currently implemented in GECKO-A is described by Aumont et al. (2005). The chemical fate of alkoxy radicals
20
produced during oxidation plays a crucial role in the context of the present study. These radicals either fragment (i.e. C-C bond breaking), functionalize the carbon skeleton by O2reaction, or isomerize via an H-shift (e.g., Atkinson et al., 2003). The fragmentation
route progressively breaks the carbon skeleton and ultimately leads to CO2
produc-tion after several successive oxidaproduc-tion steps. The funcproduc-tionalizaproduc-tion route progressively
25
ACPD
12, 14447–14482, 2012Modeling SOA formation
B. Aumont et al.
Title Page
Abstract Introduction
Conclusions References
Tables Figures
◭ ◮
◭ ◮
Back Close
Full Screen / Esc
Printer-friendly Version Interactive Discussion
Discussion
P
a
per
|
Dis
cussion
P
a
per
|
Discussion
P
a
per
|
Discussio
n
P
a
per
|
of species with low vapor pressure that may condense onto preexisting aerosol. The GECKO-A protocol was therefore updated to include the recent SAR of Atkinson (2007) for alkoxy radical chemistry. In addition, the SAR of Kwok and Atkinson (1995) imple-mented in GECKO-A for the reaction of aliphatic compounds with OH radicals was up-dated to include the recommendation of Bethel et al. (2001) about the reactive sites in
5
the vicinity of alcoholic moiety. To our knowledge, the schemes generated by GECKO-A are the sole gas phase mechanisms currently available to describe in a detailed way the oxidation of IVOC in the atmosphere.
The saturation vapor pressure Pvap is required to describe phase partitioning (Pankow, 1994) for the organic species involved in the mechanism. Here, Pvap was
10
estimated for every non-radical species using the Nannoonal et al. (2008) method, coupled with the Nannoonal et al. (2004) SAR to estimate the required boiling points. Barley and McFiggans (2010) recently identified this method as one of the most reli-able SAR to estimatePvapin the context of SOA production. Furthermore, this method was found by Valorso et al. (2011) to provide the best agreement of the simulated
15
SOA yields with smog chamber observations. Group contribution values not provided by Nannoonal et al. (2004, 2008) were taken from Compernolle et al. (2010), as de-scribed in Valorso et al. (2011).
Assuming that the gas/particle partitioning is controlled by an absorption process (Pankow, 1994), and that the aerosol is a well mixed homogeneous phase,
thermody-20
namic equilibrium is described by:
Pi =γixiPivap (1)
where xi is the mole fraction of species i in the aerosol phase, Pivap its saturation vapor pressure,γi its activity coefficient andPi its equilibrium partial pressure. Phase partitioning was implemented in the model as described by Camredon et al. (2007).
25
ACPD
12, 14447–14482, 2012Modeling SOA formation
B. Aumont et al.
Title Page
Abstract Introduction
Conclusions References
Tables Figures
◭ ◮
◭ ◮
Back Close
Full Screen / Esc
Printer-friendly Version Interactive Discussion
Discussion
P
a
per
|
Dis
cussion
P
a
per
|
Discussion
P
a
per
|
Discussio
n
P
a
per
|
is solved using the 2-step solver (Verwer et al., 1994, 1996). In this model configuration, no reactions occur in the condensed phase.
2.2 Simulation conditions
At thermodynamic equilibrium, the fraction ξi of a species i in the aerosol phase is given by (e.g., Donahue et al., 2006):
5
ξaer
i =
Ni,aer Ni,aer+Ni,gas =
1+
MOAγiPivap
COART ×10
6
−1
= 1+ C
∗ i COA
!−1
(2)
whereNi,j is the number concentration in phase j (molecule of species i per cm3 of air), R is the ideal gas constant (atm m3K−1mol−1), T the temperature (K), COA the aerosol mass concentration (µg m−3
of air), MOA is the mean organic molar mass in the aerosol (g mol−1
) and C∗
i is an effective saturation mass concentration (µg m −3
of
10
air). Beyond the pure compound properties (Pvap), COA appears as a key parameter driving the phase distribution of a given organic species. Simulations were conducted for fixed aerosol mass concentrations, with values set in the 0.1–1000 µg m−3
range. This range encompasses typical atmospheric levels and most experiments performed in smog chambers. A value of 250 g mol−1
was used forMOA.
15
The number of species included in the oxidation scheme generated by GECKO-A grows exponentially with the number of carbon atom of the precursor (GECKO-Aumont et al., 2005). For a C8parent compound, the explicit mechanism contains about 10
6
species, close to computational limits for box modeling. Target species in this study are the C8–C24 n-alkanes and significant reductions are required to bring the schemes down
20
to a manageable size. Equation (2) shows that species having a vapor pressure be-low 10−13
ACPD
12, 14447–14482, 2012Modeling SOA formation
B. Aumont et al.
Title Page
Abstract Introduction
Conclusions References
Tables Figures
◭ ◮
◭ ◮
Back Close
Full Screen / Esc
Printer-friendly Version Interactive Discussion
Discussion
P
a
per
|
Dis
cussion
P
a
per
|
Discussion
P
a
per
|
Discussio
n
P
a
per
|
under atmospheric conditions and their gas phase oxidation can be considered as in-significant. These species are therefore treated as end products during mechanism generation. With this approximation, the computational limits are reached for C12
hy-drocarbons (Aumont et al., 2008). To further decrease the number of species, a lump-ing protocol has been implemented in GECKO-A (Aumont et al., 2008; Valorso et al.,
5
2011; Lee-Taylor et al., 2011). This lumping protocol is not used in the present study so that the oxidation process described is fully explicit. Instead, we restricted the mech-anism to high NOx conditions, ignoring the cross reactions between peroxy radicals. Formation of hydroperoxides from the RO2+HO2 reactions is thus not considered in
this study. This is a severe approximation, especially to examine the chemical
evolu-10
tion on timescales exceeding one day for which keeping high NOx is hardly represen-tative of atmospheric conditions. Simulations performed here are clearly exploratory and intended to examine some, though not all, aspects of SOA formation during the multigenerational oxidation of long carbon chain of aliphatic species. Finally, additional reductions of the chemical scheme were still required for long chain alkanes (C>16) to
15
remain within the computational limits. For these species, the number of generation in the oxidation mechanism of the precursor was limited to 6. For hexadecane, simu-lations showed that increasing the number of generations does not lead to significant changes in the composition and evolution of the gas and aerosol phases. Table 1 lists the number of species finally included in the mechanisms for the various precursors.
20
Oxidation of the IVOC precursors leads to SOA formation. This process may obvi-ously contribute to a significant increase in the prescribed aerosol concentrationCOA. In this study, the initial concentrationC0of the precursor is selected to be negligible com-pared toCOA. The initial mixing ratio was set to 10 ppt carbon (about 6.5×10⁻³µg m−3).
For such conditions (C0≪COA), the simulated aerosol concentration is proportional to
25
C0or, in other words, the time-dependent aerosol yield is independent ofC0.
The simulations are performed with constant physical conditions. Temperature is fixed at 298 K. Photolysis frequencies are computed for mid-latitude and for a solar zenith angle of 30◦
ACPD
12, 14447–14482, 2012Modeling SOA formation
B. Aumont et al.
Title Page
Abstract Introduction
Conclusions References
Tables Figures
◭ ◮
◭ ◮
Back Close
Full Screen / Esc
Printer-friendly Version Interactive Discussion
Discussion
P
a
per
|
Dis
cussion
P
a
per
|
Discussion
P
a
per
|
Discussio
n
P
a
per
|
NOx concentration is held constant at a value of 1 ppb. Finally, an OH source of 2×10⁷radicals cm−3s−1 was included to initiate the oxidation of the organic species.
For these conditions, organic oxidation is almost exclusively driven by OH.
3 Results
3.1 Carbon budget
5
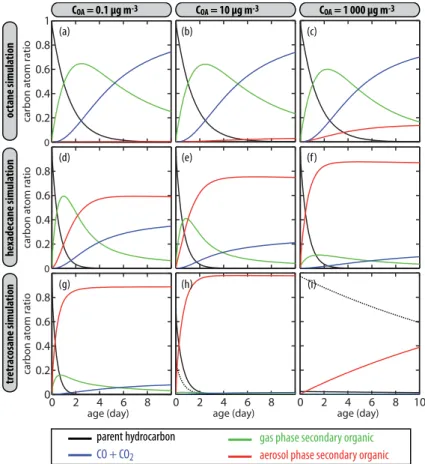
Figure 1 shows the distribution of secondary organic carbon in the aerosol and gas phase as well as in the form of the final oxidation products CO or CO2. In Fig. 1,
the simulated time is scaled to typical atmospheric conditions. We define here the photochemical ageτas:
τ= 1
[OH]atm
t
Z
0
[OH]simdt (3)
10
where [OH]atm is the typical OH concentration in the atmosphere (here taken as 106molecule cm−3
), and [OH]sim is the simulated OH concentration. Figure 1 shows
that aerosol yields grow withCOA and with the chain length of the parent compound. The opposite trend is found for CO and CO2 production. After 10 days of atmospheric oxidation, the carbon initially present as octane mainly ends up in the form of CO
15
and CO2(typically 70 %), the remaining fraction being mostly gas phase organic
car-bon. The aerosol yield for octane becomes significant only for conditions represen-tative of some smog chamber experiments (about 15 % on a carbon basis when
COA=103µg m−3
). For tetracosane (C24 n-alkane), the fraction of the carbon that is
ultimately oxidized to CO or CO2 is minor for COA=0.1 µg m
−3
(about 10 %) and
be-20
comes negligible for higher aerosol load. On a carbon basis, the aerosol yield is close to 1 (see Fig. 1). However, forCOA=103µg m−3
ACPD
12, 14447–14482, 2012Modeling SOA formation
B. Aumont et al.
Title Page
Abstract Introduction
Conclusions References
Tables Figures
◭ ◮
◭ ◮
Back Close
Full Screen / Esc
Printer-friendly Version Interactive Discussion
Discussion
P
a
per
|
Dis
cussion
P
a
per
|
Discussion
P
a
per
|
Discussio
n
P
a
per
|
as inert in this model configuration). Hexadecane shows an intermediate behavior. For atmospheric conditions (i.e.COA in the 0.1–10 µg m−3
range), the carbon distribution is initially dominated by the production of gas-phase intermediates, and subsequently by particulate or oxidized carbon. After 10 days of oxidation, particulate organic carbon is the major fraction (60–75 %), the remaining carbon being mostly CO+CO2(20–35 %).
5
The carbon evolution shown in Fig. 1 is a multigenerational oxidative process. Oxi-dation leads to progressive functionalization of the carbon skeleton and produces suc-cessive generations of compounds with lower volatility. Aerosol formation occurs when species with low enough volatility are produced. This volatility threshold is linked to the aerosol loadCOA(Eq. 2). The functionalization mechanism competes with the
fragmen-10
tation of the carbon backbone, the latter leading to the successive formation of organic intermediates with higher volatility and ultimately to CO2. Note that the fragmentation
probability increases with the number of organic moieties born by the carbon skeleton (e.g., Atkinson, 2007; Calvert et al., 2011; Chacon-Madrid and Donahue, 2011). For octane oxidation, fragmentation of the carbon backbone takes place before sufficient
15
functionalization to allow SOA formation (see also Sect. 3.6) and thus progressively leads to the formation of CO and CO2 as shown in Fig. 1. For hexadecane, function-alization leads in a few generations to the formation of non-volatile compounds that partition to the aerosol phase. Fragmentation is however still significant, especially for lowCOA (see Fig. 1). Finally for tetracosane, fragmentation appears as a minor
mech-20
anism, since organic species produced by the first oxidation steps are of low enough volatility to partition to the particles (where further oxidation in not considered in this version of the model). This multigenerational oxidation mechanism is examined in detail in the section below.
3.2 The multigenerational oxidation step by step 25
ACPD
12, 14447–14482, 2012Modeling SOA formation
B. Aumont et al.
Title Page
Abstract Introduction
Conclusions References
Tables Figures
◭ ◮
◭ ◮
Back Close
Full Screen / Esc
Printer-friendly Version Interactive Discussion
Discussion
P
a
per
|
Dis
cussion
P
a
per
|
Discussion
P
a
per
|
Discussio
n
P
a
per
|
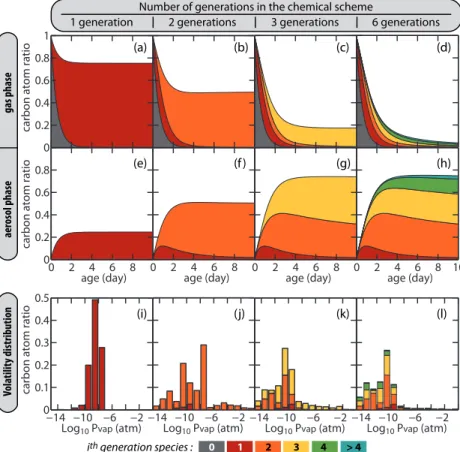
the simulated mass distribution when the scheme includes one generation only. In this case, first generation organic species are effectively treated as non reactive com-pounds that may partition between the various phases. The parent hydrocarbon exam-ined is hexadecane and the simulation is performed withCOA set to 10 µg m−3
. First generation products are C16 species and include 1-4 hydroxy-ketones (49 % on a
car-5
bon basis), monofunctional nitrates (28 %), 1-4 hydroxy-nitrates (21 %), and trifunc-tional species (2 %). The carbon atoms of these first generation species partition to the gas and aerosol phases in a ratio of about 4 : 1. Figure 2i gives the simulated volatil-ity distribution of the species after 5 days of atmospheric oxidation. For the conditions of the simulation, a species is equally split between the two phases when its
satura-10
tion vapor pressure is 10−9
atm (ξ=0.5, see Eq. 2). A species can be considered as semi volatile whenξis in the 0.01–0.99 range. This corresponds here to saturation va-por pressure in the 10−11
–10−7
atm range. Most first generation products have volatili-ties in that range and thus behave as semi-volatile compounds (see Fig. 2i). Including a chemical loss to produce the set of second generation species therefore removes
15
not only the gas phase species but also those absorbed in the aerosol phase due to re-volatilisation of first-generation products to maintain the thermodynamic equilibrium between the particle and gas phases. After gas phase processing, a fraction of the next generation species return to the particle phase with an increased oxidation state. This mechanism has been named “semi-volatile pumping” (Miracolo et al., 2010). This
20
behavior is seen in Fig. 2b, f when the chemical scheme is generated up to the second generation species. The carbon distribution between the two phases is about 50/50 after a few days of atmospheric oxidation. The contribution of first generation species to the aerosol mass budget does not then exceed a few percent (see Fig. 2b, f). The volatility distribution of the second generation species spans 14 orders of magnitude.
25
The functionalization of the carbon backbone leads to species that can here be con-sidered as non-volatile whenPvapis below 10−11
atm (i.e.ξ >0.99). For these species, the gas phase concentration is negligible and oxidation becomes a minor process. The fragmentation route leads to volatile species (Pvap>10−7
ACPD
12, 14447–14482, 2012Modeling SOA formation
B. Aumont et al.
Title Page
Abstract Introduction
Conclusions References
Tables Figures
◭ ◮
◭ ◮
Back Close
Full Screen / Esc
Printer-friendly Version Interactive Discussion
Discussion
P
a
per
|
Dis
cussion
P
a
per
|
Discussion
P
a
per
|
Discussio
n
P
a
per
|
carbon atoms. The fraction of the second generation species in the semi-volatile and volatile category will be subject to oxidation if the mechanism is extended to higher generations as seen in Fig. 2d, h.
This progressive evolution lasts as long as oxidation produces organic species with high enough volatilities to be further oxidized in the gas phase at a rate relevant in
5
the context of atmospheric chemistry. The atmospheric lifetime of submicron aerosols does not exceed a few weeks. The “re-volatilization – gas phase oxidation” mecha-nism described above is therefore efficient if it occurs with a characteristic time lower than this aerosol lifetime. For a typical OH concentration of 106molecule cm−3 and taking 2×10⁻¹¹cm3s−1 as a representative organic+OH reaction rate, a chemical
10
lifetime of about 2 months may be estimated forξ=0.999 (i.e. C∗
=10−3
COA). With this model configuration organic matter is thus either progressively transferred to the particle phase in a form that can be considered as a “permanent” non-volatile state or is finally oxidized to CO2. For hexadecane and the conditions of the simulation, Fig. 2 shows that about 6 oxidation steps must be taken into account to reach this state.
15
Species contributing to SOA production are mostly products from the 2nd to the 4th generation. Species produced after at least 4 oxidation steps become non-negligible in the mass budget only after the second day of atmospheric oxidation.
3.3 Number of generations and organic aerosol load
For a given species, the partition ratio ξ is a function of COA (see Eq. 2). The
be-20
havior of a given volatile species may change to semi-volatile or non-volatile if COA
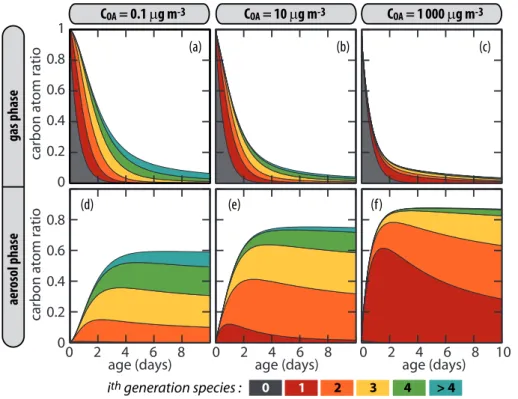
increases. The number of oxidation steps required to saturate the gas phase must therefore grow when COA decreases. Figure 3 shows the carbon distribution for the hexadecane simulation withCOAset to 0.1, 10 and 1000 µg m−3
. As expected, species produced after many generations contribute more significantly to SOA mass whenCOA 25
decreases. ForCOA=103µg m−3
ACPD
12, 14447–14482, 2012Modeling SOA formation
B. Aumont et al.
Title Page
Abstract Introduction
Conclusions References
Tables Figures
◭ ◮
◭ ◮
Back Close
Full Screen / Esc
Printer-friendly Version Interactive Discussion
Discussion
P
a
per
|
Dis
cussion
P
a
per
|
Discussion
P
a
per
|
Discussio
n
P
a
per
|
budget even during the first day of atmospheric oxidation. For such low organic aerosol content, species produced after 4 or more generations contribute strongly to the SOA budget (up to 50 %, see Fig. 3d). The rate of SOA production therefore decreases with
COAsince longer timescale are required to produce substantial quantities of the higher generation products. For example, for COA=103µg m−3, the initial rate of transfer of
5
carbon atoms from the precursor (here hexadecane) to the SOA contributors is 73 % per day (see Fig. 3c). This rate drops to 40 and 20 % per day forCOA values of 10 and 0.1 µg m−3, respectively.
3.4 Precursor chain length and number of generations
Increasing the number of carbon atoms of the precursor shifts toward lower values the
10
vapor pressure of the species involved in a given oxidative reaction sequence. The number of oxidation steps needed to saturate the gas phase is thus expected to be smaller when the size of the carbon backbone increases. Figure 4 shows the organic carbon budget for octane, hexadecane, and tetracosane discriminated on a genera-tional basis. Simulations are conducted with COA set to 10 µg m−3. For tetracosane,
15
the first generation products are almost exclusively in the particle phase and repre-sent about 80 % of the carbon budget. The rate of chemical pumping is low, owing to the strong partitioning of the first generation species to the particle phase. However, a small fraction still remains in the gas phase at equilibrium. This fraction is subjected to oxidation and produces low volatility second generation products (about 15 %, see
20
Fig. 4c). For octane, the successive generations of species produced during oxidation remain too volatile to condense with high yield in the particle phase owing to significant fragmentation of the carbon skeleton when the O/C ratio becomes large (see Sect. 3.6). SOA contributors are 3rd and 4th generation species produced after few days of atmo-spheric oxidation (less than 5 % of the carbon budget). As expected, Fig. 4 shows that
25
ACPD
12, 14447–14482, 2012Modeling SOA formation
B. Aumont et al.
Title Page
Abstract Introduction
Conclusions References
Tables Figures
◭ ◮
◭ ◮
Back Close
Full Screen / Esc
Printer-friendly Version Interactive Discussion
Discussion
P
a
per
|
Dis
cussion
P
a
per
|
Discussion
P
a
per
|
Discussio
n
P
a
per
|
compound decreases in length. Oxidation states of SOA contributors are examined in more detail in Sect. 3.6.
3.5 SOA yield and organic aerosol load
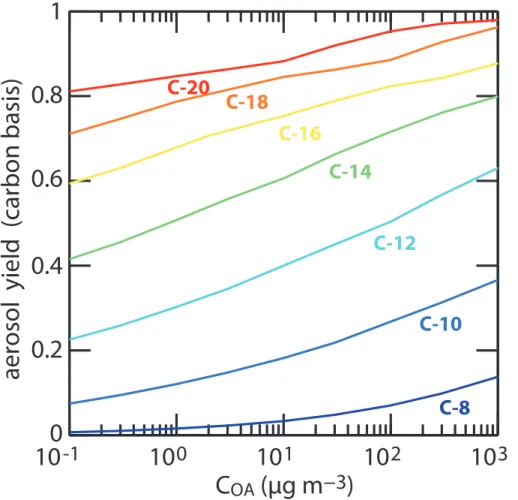
Figure 5 shows the maximum carbon atom ratio in the particle phase as a function of
COA for C8 to C20 n-alkanes. This maximum ratio is observed after the consumption
5
of the parent hydrocarbon (see Fig. 1). The maximum ratio is therefore equivalent to a SOA yieldYC expressed on a carbon basis. As expected, YC grows with the chain length and withCOA. For C8–C14 alkanes,YCincreases by about 10 % for each carbon atom added to backbone. This increase then levels off for longer chain length when
YC approaches unity (see Fig. 5). YC also shows a logarithmic growth withCOA in the
10
10−1
–103µg m−3
range. For the C10 to C16 series, theYC increase is in the range of 7–10 % per decade inCOA. The slope is slightly lower for longer carbon chains, asYC
approaches unity. Figure 5 shows significant yields at lowCOA concentration even for comparatively small carbon backbones. For example, for COA=0.1 µg m−3
,YC is 7 % for decane and 41 % for tetradecane. However, the timescale to reach the maximum
15
yield increases asCOA or hydrocarbon carbon chain length decrease (see Sect. 3.3). For example, the atmospheric oxidation timescale required to reach the maximum yield is about 4 days for tetradecane and exceeds 1 week for decane. These results suggest that a substantial fraction of the C10–C14 anthropogenic hydrocarbons may end up as
organic aerosols given enough time for oxidation, even under substantial atmospheric
20
dilution (i.e. lowCOA). Confirming such yields on an experimental basis is a real chal-lenge, owing to detection limits for such lowCOA conditions (below 1 µg m−3
) and the timescale linked to this gas phase aging process. Furthermore, it should be pointed out that most organic intermediates involved in the production of the low volatility SOA contributors are expected to be water soluble and may either be removed through dry
25
ACPD
12, 14447–14482, 2012Modeling SOA formation
B. Aumont et al.
Title Page
Abstract Introduction
Conclusions References
Tables Figures
◭ ◮
◭ ◮
Back Close
Full Screen / Esc
Printer-friendly Version Interactive Discussion
Discussion
P
a
per
|
Dis
cussion
P
a
per
|
Discussion
P
a
per
|
Discussio
n
P
a
per
|
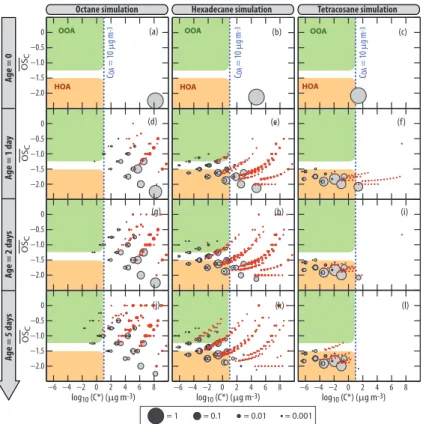
3.6 Trajectories in the OSC– volatility space
Various conceptual frameworks have been proposed to examine the oxidation trajecto-ries from the parent organic species down to the ultimate oxidation product CO2. These frameworks are 2-dimensional spaces designed to capture both volatility and polar-ity changes during oxidation. For example, two-dimensional frameworks proposed for
5
the design of models include polarity vs carbon number (Pankow and Barsanti, 2009; Barsanti et al., 2011), mean carbon oxidation state (OSC) vs. carbon number (Kroll
et al., 2011), and OSC (or O/C) vs. volatility (2-D-VBS, Donahue et al., 2011, 2012).
Note that the degree of oxidation is a key parameter not only to examine SOA forma-tion and aging but also to retrieve aerosol properties like hygroscopicity (e.g., Jimenez
10
et al., 2009). Two metrics that can be measured during laboratory or field experiments have been proposed for the development of empirical models: the O/C atom ratio (or OSC) and the volatility (Donahue et al., 2012). In this section, we examine the simulated trajectories for then-alkane in the OSC–C∗
space described by Donahue et al. (2012). The saturation vapor pressure Pvap is a fundamental property estimated for each
15
non-radical organic species by GECKO-A. Effective saturation mass concentrationsC∗
are computed based on Eq. (2), assuming ideality andMOA=250 g mol−1
. Conversion ofPvaptoC∗
is straightforward (e.g.C∗
=1.0 µg m−3
is equivalent toPvap=10−10
atm). GECKO-A provides the explicit oxidation schemes (see Sect. 2) and the mean car-bon oxidation state can therefore be computed for each intermediate. The evolution of
20
the species in OSC–C∗
space is given in Fig. 6, where the oxidation of octane, hex-adecane and tetracosane is examined forCOA of 10 µg m−3. Distributions are given for increasing atmospheric aging times, from 0 to 5 days. Position isomers having identical
C∗
and OSC are lumped into the same bubble in Fig 6. Overlaps inC∗
arise when the structure/activity relationship used to estimatePvapprovides identical values for distinct
25
position isomers. For clarity, species with a carbon atom ratio lower than 10−4
ACPD
12, 14447–14482, 2012Modeling SOA formation
B. Aumont et al.
Title Page
Abstract Introduction
Conclusions References
Tables Figures
◭ ◮
◭ ◮
Back Close
Full Screen / Esc
Printer-friendly Version Interactive Discussion
Discussion
P
a
per
|
Dis
cussion
P
a
per
|
Discussion
P
a
per
|
Discussio
n
P
a
per
|
In Fig. 6, species having the number of carbon atom of the parent compound (gray bubbles) are distinguished from species with smaller carbon skeletons (red bubbles). The former delineate the functionalization trajectories only (i.e. increasing number of functional groups on the carbon skeleton) while the latter draw joint fragmenta-tion/functionalization trajectories (i.e. bond breaking of the carbon skeleton with an
5
overall increased carbon oxidation state). As expected, Fig. 6 shows that fragmenta-tion increases with chemical age and decreases with shorter parent compound chain lengths (see also the CO and CO2budget in Fig. 1). For octane, functionalization routes first lead to species with large OSC after a few oxidation steps. As already stated, fragmentation probability increases with OSC (see Sect. 3.1). Fragmentation occurs
10
before the functionalization routes can produce large amount of low volatility species, ultimately leading to CO2 (see Fig. 1b). Therefore, SOA yield remains low even after
5 days of atmospheric oxidation. Tetracosane shows the opposite behavior.C∗
values for first generation products lie well belowCOA (see Fig. 6). The gas-phase chemical pump is therefore inefficient and OSC remains below −1.5 for most SOA contributors
15
Fragmentation is thus a negligible route in the tetracosane evolution. For hexadecane, there is significant fragmentation of the carbon skeleton, leading to a myriad of gas-phase products (see Fig. 6). Most fragmentation products evolve toward the production of CO and CO2 (upper right direction of Fig. 6). After 5 days of atmospheric
process-ing, 16 % of the hexadecane carbon atoms have been converted to CO or CO2 (see
20
Fig. 1e). In the particle phase, species with 16 carbon atoms (i.e. derivatives of the parent compound) contribute to 92 % of the SOA carbon budget. The mean number of carbon per species contributing to the SOA mass is 15.4. The major SOA contributors are therefore produced via the functionalization pathways with only minor contributions from trajectories including at least one fragmentation step. The overall SOA oxidation
25
ACPD
12, 14447–14482, 2012Modeling SOA formation
B. Aumont et al.
Title Page
Abstract Introduction
Conclusions References
Tables Figures
◭ ◮
◭ ◮
Back Close
Full Screen / Esc
Printer-friendly Version Interactive Discussion
Discussion
P
a
per
|
Dis
cussion
P
a
per
|
Discussion
P
a
per
|
Discussio
n
P
a
per
|
3.7 Highly oxygenated aerosols (OOA) vs. hydrocarbon like organic aerosols (HOA)
Atmospheric observations based on aerosol mass spectrometer (AMS) measurements show that submicron organic aerosols can be categorized into a few components or factors (e.g., Zhang et al., 2005). One of these components consists of highly
oxy-5
genated organic aerosols (OOA) (Zhang et al., 2005, 2007) and is characterized by an O/C ratio larger than 0.25 (Jimenez et al., 2009). This OOA component is usually given equivalent status to SOA. OSCcan be approximated based on the elemental O/C
and H/C ratios (Kroll et al., 2011). Analysis of elemental ratios measured for organic aerosols shows that O/C ratio is on average a linear function of H/C ratio (Heald et al.,
10
2010). The combination of these relationships leads to an average OSC≈3(O/C)−2
(Donahue et al., 2012). OOA can therefore be equivalently characterized by an OSC
greater than about−1.25. Another often-reported component shows features
resem-bling emissions from motor exhausts and is usually named hydrocarbon like organic aerosols (HOA) (e.g., Zhang et al., 2005). This component is commonly ascribed to
15
primary organic aerosols (POA). The expected OSCfor this HOA factor is below−1.5
(Donahue et al., 2012).
The shaded green area in Fig. 6 marks the OOA domain. The tetracosane oxida-tion simulaoxida-tion yields negligible amounts of species falling in that domain. For octane, the simulated SOA contributors match the oxidation state expected for OOA but, as
20
discussed above, the aerosol yield is very low (see Fig. 1b). The hexadecane oxida-tion simulaoxida-tion yields SOA contributors that are mostly too reduced to be categorized as OOA (see Fig. 6). The OOA fraction grows slowly with age but remains a minor component. After 5 days of atmospheric processing, OOA contributes only 10 % of the overall SOA production on a carbon atom basis in the hexadecane case. The shaded
25
ACPD
12, 14447–14482, 2012Modeling SOA formation
B. Aumont et al.
Title Page
Abstract Introduction
Conclusions References
Tables Figures
◭ ◮
◭ ◮
Back Close
Full Screen / Esc
Printer-friendly Version Interactive Discussion
Discussion
P
a
per
|
Dis
cussion
P
a
per
|
Discussion
P
a
per
|
Discussio
n
P
a
per
|
overall SOA production in the hexadecane case. Virtually all SOA contributors fall in the HOA category in the tetracosane simulation (see Fig. 6).
Species produced during octane and hexadecane oxidation border the right and bot-tom of the OOA domain, respectively, suggesting thatn-alkanes of intermediate carbon chain length (i.e. C9–C15) might produce OOA with greater yields. Figure 7 shows the
5
simulated species distribution after 5 days of atmospheric oxidation for decane, do-decane and tetrado-decane. As expected, the fraction of SOA contributors falling in the OOA category decreases with increasing carbon chain length. On a carbon atom ba-sis, OOA represents 82 %, 49 %, 22 % of SOA produced after 5 days of atmospheric oxidation of decane, dodecane and tetradecane, respectively. The SOA yield and the
10
OOA fraction show opposite trends, increasing and decreasing, respectively with the chain length. For an aging time of 5 days and for COA=10 µg m−3
, the OOA carbon yieldYCOOA (i.e. OOA produced per parent hydrocarbon reacted) is greatest for the do-decane oxidation, reaching 0.19. Note that the fraction of SOA contributors falling in the HOA domain grows with the chain length (see Fig. 7). For an aging period of 5 days,
15
HOA represents 8 %, 24 % and 35 % of SOA produced in the simulation of decane, dodecane and tetradecane, respectively.
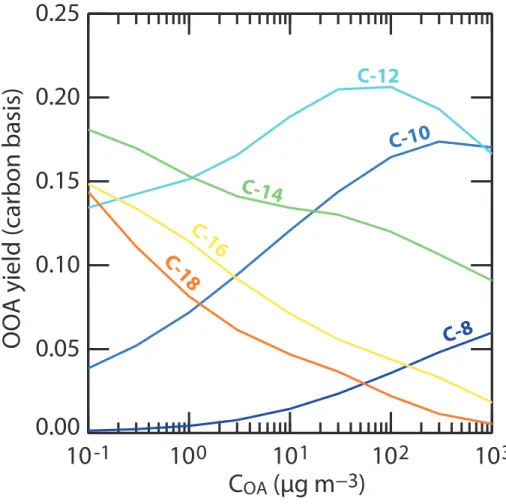
Figure 8 showsYCOOA computed for C8–C18 n-alkane as a function of COA. For the
condition explored within this study,YCOOAnever exceeds 25 %. For any given precursor,
YCOOAexhibits a bell shaped curve which arises from the competition between
fragmen-20
tation and functionalization. The functionalization pathways dominate the initial oxida-tion steps. For highCOAcontent, first generation species partition to the aerosol phase. The gas phase chemical pump efficiency decreases and the OOA fraction remains low, explaining the low YCOOA values even though YC is large. For low COA content, many successive oxidation steps are required to produce species with low enough
volatil-25
ity to condense. As stated above, fragmentation pathways dominate the gas phase oxidation of highly oxygenated species and most species then evolve toward CO2
ACPD
12, 14447–14482, 2012Modeling SOA formation
B. Aumont et al.
Title Page
Abstract Introduction
Conclusions References
Tables Figures
◭ ◮
◭ ◮
Back Close
Full Screen / Esc
Printer-friendly Version Interactive Discussion
Discussion
P
a
per
|
Dis
cussion
P
a
per
|
Discussion
P
a
per
|
Discussio
n
P
a
per
|
The maximum YCOOA is observed when COA is low enough to allow an efficient gas phase production of oxygenated species but high enough to allow condensation and avoid significant fragmentation of the carbon skeleton. This maximum yield shifts to lowerCOA values as the carbon chain length of the precursor increases (see Fig. 8).
Two subtypes of OOA can usually be distinguished based on factor analysis of
5
AMS data, the first being attributed to highly oxidized low-volatile species (LV-OOA) the second being attributed to less oxidized semi-volatile species (SV-OOA) (Jimenez et al., 2009). Atmospheric observations suggest that SV-OOA is rather fresh OA which evolves to LV-OOA during photochemical processing (Jimenez et al., 2009). The dotted contours in Fig. 7 delineate the LV-OOA and SV-OOA envelopes depicted by Jimenez
10
et al. (2009) and Donahue et al. (2012). No species in our simulations fall in the LV-OOA domain and the OOA contributors lie in the lower range of SV-OOA oxidation state. The configuration of the model appears clearly unable to explain the production of LV-OOA from n-alkane parent compounds. This statement holds for carbon skeletons of any size and for any aging time relevant in the context of atmospheric oxidation.
15
Figures 6 and 7 show that most SOA contributors are too reduced to be categorized as OOA (i.e. with an OSC greater than −1.25). Simulated OOA represents therefore
only a fraction of the SOA produced during the oxidation ofn-alkanes. The OOA con-tribution to the overall SOA budget decreases when the chain length of the parent compound increases, and appears to be a minor component for C>16 n-alkanes.
Ac-20
cording to this model version, the OOA component may thus greatly underestimate SOA. On the other hand, most simulated SOA contributors are reduced enough to be categorized as HOA (i.e. with an OSC lower than −1.5). Unlike OOA, the simulated
HOA contribution to the SOA budget increases with the chain length of the parent com-pound, and appears as the major component for C>16 n-alkanes. According to this
25
ACPD
12, 14447–14482, 2012Modeling SOA formation
B. Aumont et al.
Title Page
Abstract Introduction
Conclusions References
Tables Figures
◭ ◮
◭ ◮
Back Close
Full Screen / Esc
Printer-friendly Version Interactive Discussion
Discussion
P
a
per
|
Dis
cussion
P
a
per
|
Discussion
P
a
per
|
Discussio
n
P
a
per
|
4 Conclusions
Explicit chemical mechanisms reflect the current knowledge of the transformations oc-curring in the atmosphere. Explicit schemes were generated for C8–C24n-alkanes us-ing the GECKO-A tool. Simulations were conducted to explore SOA formation for var-ious concentrations of preexisting aerosol. In the version of the model examined here,
5
gas-aerosol equilibrium is assumed at each time step for each species and the aerosol phase is assumed to be an inert phase. As expected, simulation results show that (i) SOA yield increases with the carbon chain length of the parent hydrocarbon, (ii) SOA yield decreases with decreasingCOA, (iii) SOA production rates are faster with increas-ingCOA, and (iv) the number of oxidation steps (i.e. generations) needed to describe
10
SOA formation and evolution grows when COA decreases. However, most simulated SOA contributors are found to be not oxidized enough to be categorized as OOA but reduced enough to be categorized as HOA. This trend increases with the carbon chain length of the parentn-alkane. This model version therefore suggests that OOA may underestimate SOA, while HOA may overestimate POA. The model was unable to
15
produce highly oxygenated aerosols (OOA) with large yields. In particular, this model configuration did not lead to the production of species having carbon oxidation states and volatilities matching the LV-OOA subtype usually observed in situ for SOA, even after 10 days of atmospheric processing with lowCOA content. Oxidation ofn-alkanes leads to species having either too low volatility to activate the gas phase chemical
20
pump efficiently (long carbon chain) or too high O/C ratio to avoid fragmentation and CO2production (short carbon chain). Similar behavior has been recently described by Cappa et al. (2012), based on a kinetic and statistical oxidation model.
Atmospheric observations show that the OOA component is ubiquitous and define a target for proposed mechanisms (Donahue et al., 2012). Various hypotheses can be
25
ACPD
12, 14447–14482, 2012Modeling SOA formation
B. Aumont et al.
Title Page
Abstract Introduction
Conclusions References
Tables Figures
◭ ◮
◭ ◮
Back Close
Full Screen / Esc
Printer-friendly Version Interactive Discussion
Discussion
P
a
per
|
Dis
cussion
P
a
per
|
Discussion
P
a
per
|
Discussio
n
P
a
per
|
a complex mixture of linear, branched and cyclic alkanes, alkenes and aromatics (e.g., Fraser et al., 1997; Schauer et al., 1999, 2002; El Haddad et al., 2009). Branched and unsaturated species may behave differently from then-alkanes. For example, branched alkanes are more prone to fragment in the early stage of the oxidation (e.g., Atkinson, 2007; Atkinson et al., 2008), leading to lower SOA yield than their corresponding linear
5
analogue (Lim and Ziemann, 2009) but likely with an enhanced mean carbon oxidation state. Similarly, alkenes yield to higher fragmentation than their corresponding satu-rated analogue (e.g., Atkinson and Arey, 2003) but also lead to the production of more oxidized multifunctional species (e.g. dihydroxycarbonyls) as first first-generation prod-ucts (Matsunaga et al., 2009). It is also possible that the explicit schemes generated
10
by GECKO-A are not representative of the gas phase oxidation processes actually oc-curring in the atmosphere. The protocol included in GECKO-A to design the oxidation mechanism (Aumont et al., 2005) is based on the current understanding of atmospheric organic chemistry. The chemistry of most oxygenated organic molecules investigated so far concerns rather small carbon chains (typically below C8) bearing 1 or 2
func-15
tional groups (e.g., Calvert et al., 2011). Empirical SARs based on this experimental data are extrapolated to infer the chemistry of species bearing many functional groups. This extrapolation may not be appropriate. For example, the functionalization vs. frag-mentation pathways directly depend on (i) which reactive sites of the molecule react with the OH radical, and (ii) the evolution of the alkoxy radicals produced during the
20
oxidation (e.g., Atkinson, 2003; Calvert et al., 2011). The rates of these 2 key reaction steps are strongly modified by neighboring functional groups (e.g., Kwok and Atkin-son, 1995; AtkinAtkin-son, 2007). Branching ratios may thus be erroneously computed with available SARs when applied to the multifunctional species produced beyond the first generation. Finally, the assumption made in this version of the model that the
con-25
ACPD
12, 14447–14482, 2012Modeling SOA formation
B. Aumont et al.
Title Page
Abstract Introduction
Conclusions References
Tables Figures
◭ ◮
◭ ◮
Back Close
Full Screen / Esc
Printer-friendly Version Interactive Discussion
Discussion
P
a
per
|
Dis
cussion
P
a
per
|
Discussion
P
a
per
|
Discussio
n
P
a
per
|
oxidative reactions occurring in the aerosol phase have been observed for squalane, a branched C30 alkane, and may play a key role in the aging of organic aerosols (e.g., Kroll et al., 2009). For example, atmospheric observations show that carboxylic acid is a major functional group found in aerosols (Sempere and Kawamura, 1994; Decesari et al., 2000; Kanakidou et al., 2005) but this group does not contribute significantly
5
to the carbon budget simulated with GECKO-A (Lee-Taylor et al., 2011). It is unlikely that a gas phase chemical source is efficient enough to account for the measured val-ues (Aumont et al., 2000). The conjunction of C-C bond breaking in the aerosol phase and the production of carboxylic acid at the terminal carbon atom of the fragment would lead to production of species falling in the LV-OOA subtype. Oxidation in the condensed
10
phase is likely a key process to shift IVOC oxidative trajectories toward the production of organic aerosol with higher mean carbon oxidation states. Sensitivity studies will be performed to test the likelihood of these assumptions.
Acknowledgements. NCAR is sponsored by the National Science Foundation. JLT was sup-ported and SM was supsup-ported in part by a grant from the US Department of Energy, Office
15
of Science, BER, DE-FG02-ER65323. The support from the French ANR project MEGAPOLI – PARIS (ANR-09-BLAN-0356) is acknowledged. The publication of this article is financed by CNRS-INSU.
20
ACPD
12, 14447–14482, 2012Modeling SOA formation
B. Aumont et al.
Title Page
Abstract Introduction
Conclusions References
Tables Figures
◭ ◮
◭ ◮
Back Close
Full Screen / Esc
Printer-friendly Version Interactive Discussion
Discussion
P
a
per
|
Dis
cussion
P
a
per
|
Discussion
P
a
per
|
Discussio
n
P
a
per
|
References
Atkinson, R.: Rate constants for the atmospheric reactions of alkoxy radicals: an updated estimation method, Atmos. Environ., 41, 8468–8485, doi:10.1016/j.atmosenv.2007.07.002, 2007.
Atkinson, R. and Arey, J.: Atmospheric degradation of volatile organic compounds, Chem. Rev.,
5
103, 4605–4638, doi:10.1021/cr0206420, 2003.
Atkinson, R., Arey, J., and Aschmann, S. M.: Atmospheric chemistry of alkanes: review and re-cent developments, Atmos. Environ., 42, 5859–5871, doi:10.1016/j.atmosenv.2007.08.040, 2008.
Aumont, B., Madronich, S., Bey, I., and Tyndall, G. S.: Contribution of secondary VOC to the
10
composition of aqueous atmospheric particles: a modeling approach, J. Atmos. Chem., 35, 59–75, doi:10.1023/a:1006243509840, 2000.
Aumont, B., Szopa, S., and Madronich, S.: Modelling the evolution of organic carbon during its gas-phase tropospheric oxidation: development of an explicit model based on a self gener-ating approach, Atmos. Chem. Phys., 5, 2497–2517, doi:10.5194/acp-5-2497-2005, 2005.
15
Aumont, B., Camredon, M., Valorso, R., Lee-Taylor, J., and Madronich, S.: Development of systematic reduction techniques to describe the SOA/VOC/NOx/O3system, in: Atmospheric Chemical Mechanisms Conference, Air Quality Research Center, UC Davis, CA, 10–12 De-cember 2008.
Barley, M. H. and McFiggans, G.: The critical assessment of vapour pressure estimation
meth-20
ods for use in modelling the formation of atmospheric organic aerosol, Atmos. Chem. Phys., 10, 749–767, doi:10.5194/acp-10-749-2010, 2010.
Barsanti, K. C., Smith, J. N., and Pankow, J. F.: Application of the np plus mP modeling approach for simulating secondary organic particulate matter formation from alpha-pinene oxidation, Atmos. Environ., 45, 6812–6819, doi:10.1016/j.atmosenv.2011.01.038, 2011.
25
Bethel, H. L., Atkinson, R., and Arey, J.: Kinetics and products of the reactions of selected diols with the OH radical, Int. J. Chem. Kinet., 33, 310–316, 2001.
Calvert, J. G., Derwent, R. G., Orlando, J. J., Tyndall, G., and Wallington T.J.: The mechanisms of atmospheric oxidation of the alkanes, Oxford University Press, New York, NY, 2008. Calvert, J. G., Mellouki, A., Orlando, J. J., Pilling, M. J., and Wallington, T. J.: The mechanisms
30
ACPD
12, 14447–14482, 2012Modeling SOA formation
B. Aumont et al.
Title Page
Abstract Introduction
Conclusions References
Tables Figures
◭ ◮
◭ ◮
Back Close
Full Screen / Esc
Printer-friendly Version Interactive Discussion
Discussion
P
a
per
|
Dis
cussion
P
a
per
|
Discussion
P
a
per
|
Discussio
n
P
a
per
|
Camredon, M., Aumont, B., Lee-Taylor, J., and Madronich, S.: The SOA/VOC/NOx system: an explicit model of secondary organic aerosol formation, Atmos. Chem. Phys., 7, 5599–5610, doi:10.5194/acp-7-5599-2007, 2007.
Cappa, C. D. and Wilson, K. R.: Multi-generation gas-phase oxidation, equilibrium partitioning, and the formation and evolution of secondary organic aerosol, Atmos. Chem. Phys. Discuss.,
5
12, 3295–3356, doi:10.5194/acpd-12-3295-2012, 2012.
Chacon-Madrid, H. J. and Donahue, N. M.: Fragmentation vs. functionalization: chemical aging and organic aerosol formation, Atmos. Chem. Phys., 11, 10553–10563, doi:10.5194/acp-11-10553-2011, 2011.
Chan, A. W. H., Kautzman, K. E., Chhabra, P. S., Surratt, J. D., Chan, M. N., Crounse, J. D.,
10
K ¨urten, A., Wennberg, P. O., Flagan, R. C., and Seinfeld, J. H.: Secondary organic aerosol formation from photooxidation of naphthalene and alkylnaphthalenes: implications for oxida-tion of intermediate volatility organic compounds (IVOCs), Atmos. Chem. Phys., 9, 3049– 3060, doi:10.5194/acp-9-3049-2009, 2009.
Compernolle, S., Ceulemans, K., and M ¨uller, J.-F.: Technical Note: Vapor pressure estimation
15
methods applied to secondary organic aerosol constituents fromα-pinene oxidation: an in-tercomparison study, Atmos. Chem. Phys., 10, 6271–6282, doi:10.5194/acp-10-6271-2010, 2010.
Decesari, S., Facchini, M. C., Fuzzi, S., and Tagliavini, E.: Characterization of water-soluble organic compounds in atmospheric aerosol: a new approach, J. Geophys. Res.-Atmos., 105,
20
1481–1489, doi:10.1029/1999jd900950, 2000.
Donahue, N. M., Robinson, A. L., Stanier, C. O., and Pandis, S. N.: Coupled partitioning, di-lution, and chemical aging of semivolatile organics, Environ. Sci. Technol., 40, 2635–2643, doi:10.1021/esO52297c, 2006.
Donahue, N. M., Epstein, S. A., Pandis, S. N., and Robinson, A. L.: A two-dimensional volatility
25
basis set: 1. organic-aerosol mixing thermodynamics, Atmos. Chem. Phys., 11, 3303–3318, doi:10.5194/acp-11-3303-2011, 2011.
Donahue, N. M., Kroll, J. H., Pandis, S. N., and Robinson, A. L.: A two-dimensional volatility basis set – Part 2: Diagnostics of organic-aerosol evolution, Atmos. Chem. Phys., 12, 615– 634, doi:10.5194/acp-12-615-2012, 2012.
30
ACPD
12, 14447–14482, 2012Modeling SOA formation
B. Aumont et al.
Title Page
Abstract Introduction
Conclusions References
Tables Figures
◭ ◮
◭ ◮
Back Close
Full Screen / Esc
Printer-friendly Version Interactive Discussion
Discussion
P
a
per
|
Dis
cussion
P
a
per
|
Discussion
P
a
per
|
Discussio
n
P
a
per
|
El Haddad, I., Marchand, N., Dron, J., Temime-Roussel, B., Quivet, E., Wortham, H., Jaf-frezo, J. L., Baduel, C., Voisin, D., Besombes, J. L., and Gille, G.: Comprehensive primary particulate organic characterization of vehicular exhaust emissions in France, Atmos. Envi-ron., 43, 6190–6198, doi:10.1016/j.atmosenv.2009.09.001, 2009.
Fraser, M. P., Cass, G. R., Simoneit, B. R. T., and Rasmussen, R. A.: Air quality model
evalu-5
ation data for organics .4. C-2-C-36 non-aromatic hydrocarbons, Environ. Sci. Technol., 31, 2356–2367, doi:10.1021/es960980g, 1997.
Goldstein, A. H. and Galbally, I. E.: Known and unexplored organic constituents in the earth’s atmosphere, Environ. Sci. Technol., 41, 1514–1521, 2007.
Grieshop, A. P., Logue, J. M., Donahue, N. M., and Robinson, A. L.: Laboratory investigation of
10
photochemical oxidation of organic aerosol from wood fires 1: measurement and simulation of organic aerosol evolution, Atmos. Chem. Phys., 9, 1263–1277, doi:10.5194/acp-9-1263-2009, 2009.
Heald, C. L., Kroll, J. H., Jimenez, J. L., Docherty, K. S., DeCarlo, P. F., Aiken, A. C., Chen, Q., Martin, S. T., Farmer, D. K., and Artaxo, P.: A simplified description of the
15
evolution of organic aerosol composition in the atmosphere, Geophys. Res. Lett., 37, 5, doi:L08803,10.1029/2010gl042737, 2010.
Hodzic, A., Jimenez, J. L., Madronich, S., Canagaratna, M. R., DeCarlo, P. F., Kleinman, L., and Fast, J.: Modeling organic aerosols in a megacity: potential contribution of semi-volatile and intermediate volatility primary organic compounds to secondary organic aerosol formation,
20
Atmos. Chem. Phys., 10, 5491–5514, doi:10.5194/acp-10-5491-2010, 2010.
Jathar, S. H., Farina, S. C., Robinson, A. L., and Adams, P. J.: The influence of semi-volatile and reactive primary emissions on the abundance and properties of global organic aerosol, Atmos. Chem. Phys., 11, 7727–7746, doi:10.5194/acp-11-7727-2011, 2011.
Jimenez, J. L., Canagaratna, M. R., Donahue, N. M., Prevot, A. S. H., Zhang, Q., Kroll, J. H.,
25
DeCarlo, P. F., Allan, J. D., Coe, H., Ng, N. L., Aiken, A. C., Docherty, K. S., Ulbrich, I. M., Grieshop, A. P., Robinson, A. L., Duplissy, J., Smith, J. D., Wilson, K. R., Lanz, V. A., Hueglin, C., Sun, Y. L., Tian, J., Laaksonen, A., Raatikainen, T., Rautiainen, J., Vaatto-vaara, P., Ehn, M., Kulmala, M., Tomlinson, J. M., Collins, D. R., Cubison, M. J., Dunlea, E. J., Huffman, J. A., Onasch, T. B., Alfarra, M. R., Williams, P. I., Bower, K., Kondo, Y.,
Schnei-30
ACPD
12, 14447–14482, 2012Modeling SOA formation
B. Aumont et al.
Title Page
Abstract Introduction
Conclusions References
Tables Figures
◭ ◮
◭ ◮
Back Close
Full Screen / Esc
Printer-friendly Version Interactive Discussion
Discussion
P
a
per
|
Dis
cussion
P
a
per
|
Discussion
P
a
per
|
Discussio
n
P
a
per
|
Williams, L. R., Wood, E. C., Middlebrook, A. M., Kolb, C. E., Baltensperger, U., and Worsnop, D. R.: Evolution of organic aerosols in the atmosphere, Science, 326, 1525–1529, doi:10.1126/science.1180353, 2009.
Kanakidou, M., Seinfeld, J. H., Pandis, S. N., Barnes, I., Dentener, F. J., Facchini, M. C., Van Dingenen, R., Ervens, B., Nenes, A., Nielsen, C. J., Swietlicki, E., Putaud, J. P.,
Balkan-5
ski, Y., Fuzzi, S., Horth, J., Moortgat, G. K., Winterhalter, R., Myhre, C. E. L., Tsigaridis, K., Vignati, E., Stephanou, E. G., and Wilson, J.: Organic aerosol and global climate modelling: a review, Atmos. Chem. Phys., 5, 1053–1123, doi:10.5194/acp-5-1053-2005, 2005.
Kroll, J. H. and Seinfeld, J. H.: Chemistry of secondary organic aerosol: formation and evolution of low-volatility organics in the atmosphere, Atmos. Environ., 42, 3593–3624,
10
doi:10.1016/j.atmosenv.2008.01.003, 2008.
Kroll, J. H., Smith, J. D., Che, D. L., Kessler, S. H., Worsnop, D. R., and Wilson, K. R.: Mea-surement of fragmentation and functionalization pathways in the heterogeneous oxidation of oxidized organic aerosol, Phys. Chem. Chem. Phys., 11, 8005–8014, doi:10.1039/b905289e, 2009.
15
Kroll, J. H., Donahue, N. M., Jimenez, J. L., Kessler, S. H., Canagaratna, M. R., Wilson, K. R., Altieri, K. E., Mazzoleni, L.R., Wozniak, A. S., Bluhm, H., Mysak, E. R., Smith, J. D., Kolb, C. E., and Worsnop, D. R.: Carbon oxidation state as a metric for describing the chemistry of atmospheric organic aerosol, Nature Chem., 3, 133–139, doi:10.1038/nchem.948, 2011. Kwok, E. S. C. and Atkinson, R.: Estimation of hydroxyl radical reaction-rate constants for
gas-20
phase organic-compounds using a structure-reactivity relationship – an update, Atmos. En-viron., 29, 1685–1695, doi:10.1016/1352-2310(95)00069-b, 1995.
Lee-Taylor, J., Madronich, S., Aumont, B., Baker, A., Camredon, M., Hodzic, A., Tyndall, G. S., Apel, E., and Zaveri, R. A.: Explicit modeling of organic chemistry and secondary organic aerosol partitioning for Mexico City and its outflow plume, Atmos. Chem. Phys., 11, 13219–
25
13241, doi:10.5194/acp-11-13219-2011, 2011.
Li, G., Zavala, M., Lei, W., Tsimpidi, A. P., Karydis, V. A., Pandis, S. N., Canagaratna, M. R., and Molina, L. T.: Simulations of organic aerosol concentrations in Mexico City using the WRF-CHEM model during the MCMA-2006/MILAGRO campaign, Atmos. Chem. Phys., 11, 3789–3809, doi:10.5194/acp-11-3789-2011, 2011.
30
ACPD
12, 14447–14482, 2012Modeling SOA formation
B. Aumont et al.
Title Page
Abstract Introduction
Conclusions References
Tables Figures
◭ ◮
◭ ◮
Back Close
Full Screen / Esc
Printer-friendly Version Interactive Discussion
Discussion
P
a
per
|
Dis
cussion
P
a
per
|
Discussion
P
a
per
|
Discussio
n
P
a
per
|
Lim, Y. B. and Ziemann, P. J.: Effects of molecular structure on aerosol yields from OH radical-initiated reactions of linear, branched, and cyclic alkanes in the presence of NOx, Environ. Sci. Technol., 43, 2328–2334, doi:10.1021/es803389s, 2009.
Madronich, S. and Flocke, S.: Theoretical estimation of biologically effective UV radiation at the Earth’s surfaceSolar, in: Solar Ultraviolet Radiation – Modeling, Measurements and Effects,
5
edited by: Zerefos, C., Springer-Verlag, Berlin, 23–48, 1997.
Matsunaga, A., Docherty, K. S., Lim, Y. B., and Ziemann, P. J.: Composition and yields of secondary organic aerosol formed from OH radical-initiated reactions of linear alkenes in the presence of NOx: modeling and measurements, Atmos. Environ., 43, 1349–1357, doi:10.1016/j.atmosenv.2008.12.004, 2009.
10
Miracolo, M. A., Presto, A. A., Lambe, A. T., Hennigan, C. J., Donahue, N. M., Kroll, J. H., Worsnop, D. R., and Robinson, A. L.: Photo-oxidation of low-volatility organics found in motor vehicle emissions: production and chemical evolution of organic aerosol mass, Environ. Sci. Technol., 44, 1638–1643, doi:10.1021/es902635c, 2010.
Nannoolal, Y., Rarey, J., Ramjugernath, D., and Cordes, W.: Estimation of pure component
15
properties: Part 1. Estimation of the normal boiling point of non-electrolyte organic com-pounds via group contributions and group interactions, Fluid Phase Equilibr., 226, 45–63, 2004.
Nannoolal, Y., Rarey, J., and Ramjugernath, D.: Estimation of pure component properties: Part 3. Estimation of the vapor pressure of non-electrolyte organic compounds via group
contri-20
butions and group interactions, Fluid Phase Equilibr., 269, 117–133, 2008.
Pankow, J. F.: An absorption-model of the gas aerosol partitioning involved in the formation of secondary organic aerosol, Atmos. Environ., 28, 189–193, 1994.
Pankow, J. F. and Barsanti, K. C.: The carbon number-polarity grid: a means to manage the complexity of the mix of organic compounds when modeling atmospheric organic particulate
25
matter, Atmos. Environ., 43, 2829–2835, doi:10.1016/j.atmosenv.2008.12.050, 2009. Presto, A. A., Miracolo, M. A., Donahue, N. M., and Robinson, A. L.: Secondary organic aerosol
formation from high-NOxphoto-oxidation of low volatility precursors:n-alkanes, Environ. Sci. Technol., 44, 2029–2034, doi:10.1021/es903712r, 2010.
Robinson, A. L., Donahue, N. M., Shrivastava, M. K., Weitkamp, E. A., Sage, A. M.,
30