AMTD
4, 6915–6967, 2011CRISTA-NF measurements with
unprecedented vertical resolution
J. Ungermann et al.
Title Page
Abstract Introduction
Conclusions References
Tables Figures
◭ ◮
◭ ◮
Back Close
Full Screen / Esc
Printer-friendly Version
Interactive Discussion
Discussion
P
a
per
|
Dis
cussion
P
a
per
|
Discussion
P
a
per
|
Discussio
n
P
a
per
|
Atmos. Meas. Tech. Discuss., 4, 6915–6967, 2011 www.atmos-meas-tech-discuss.net/4/6915/2011/ doi:10.5194/amtd-4-6915-2011
© Author(s) 2011. CC Attribution 3.0 License.
Atmospheric Measurement Techniques Discussions
This discussion paper is/has been under review for the journal Atmospheric Measurement Techniques (AMT). Please refer to the corresponding final paper in AMT if available.
CRISTA-NF measurements with
unprecedented vertical resolution during
the RECONCILE aircraft campaign
J. Ungermann1, C. Kalicinsky2, F. Olschewski2, P. Knieling2, L. Hoffmann3, J. Blank1, W. Woiwode4, H. Oelhaf4, E. H ¨osen2, C. M. Volk2, A. Ulanovsky5, F. Ravegnani6, K. Weigel7, F. Stroh1, and M. Riese1
1
Institute of Energy and Climate Research – Stratosphere (IEK-7), Research centre J ¨ulich GmbH, J ¨ulich, Germany
2
Department of Physics, University of Wuppertal, Wuppertal, Germany 3
J ¨ulich Supercomputing Centre, Forschungszentrum J ¨ulich, Research Centre J ¨ulich GmbH, J ¨ulich, Germany
4
Institute for Meteorology and Climate Research, Karlsruhe Institute of Technology, Karlsruhe, Germany
5
Central Aerological Observatory, Dolgoprudny, Russia 6
AMTD
4, 6915–6967, 2011CRISTA-NF measurements with
unprecedented vertical resolution
J. Ungermann et al.
Title Page
Abstract Introduction
Conclusions References
Tables Figures
◭ ◮
◭ ◮
Back Close
Full Screen / Esc
Printer-friendly Version
Interactive Discussion
Discussion
P
a
per
|
Dis
cussion
P
a
per
|
Discussion
P
a
per
|
Discussio
n
P
a
per
|
7
Institute of Environmental Physics (IUP), University of Bremen, Bremen, Germany
Received: 4 November 2011 – Accepted: 11 November 2011 – Published: 21 November 2011 Correspondence to: J. Ungermann (j.ungermann@fz-juelich.de)
AMTD
4, 6915–6967, 2011CRISTA-NF measurements with
unprecedented vertical resolution
J. Ungermann et al.
Title Page
Abstract Introduction
Conclusions References
Tables Figures
◭ ◮
◭ ◮
Back Close
Full Screen / Esc
Printer-friendly Version
Interactive Discussion
Discussion
P
a
per
|
Dis
cussion
P
a
per
|
Discussion
P
a
per
|
Discussio
n
P
a
per
|
Abstract
The Cryogenic Infrared Spectrometers and Telescope for the Atmosphere - New Fron-tiers (CRISTA-NF), an airborne infrared limb-sounder, was operated aboard the high-flying Russian research aircraft M55-Geophysica during the Arctic RECONCILE cam-paign from January to March 2011. This paper describes the calibration process of 5
the instrument and the employed retrieval algorithm and then proceeds to present re-trieved trace gas mixing ratio cross-sections for one specific flight of this campaign. We are able to resolve the uppermost troposphere/lower stratosphere for several trace gas species for several kilometres below the flight altitude (16 to 19 km) with an un-precedented vertical resolution of 400 to 500 m for the limb-sounding technique. The 10
observations are also characterised by a rather high horizontal sampling along the flight track that provides a full vertical profile every ≈15 km. Assembling the vertical trace gas profiles derived from CRISTA-NF measurements to cross-sections depicts filaments of vortex and extra-vortex air masses in the vicinity of the polar vortex.
During this campaign, the M55-Geophysica carried further instruments, which allows 15
for a validation of trace gas mixing ratios derived from CRISTA-NF against measure-ments by the in situ instrumeasure-ments HAGAR and FOZAN and observations by MIPAS-STR. This validation suggests that the retrieved trace gas mixing ratios are both qualitatively and quantitatively reliable.
1 Introduction
20
Passive infrared limb-sounding enables the derivation of trace gas mixing ratios and other atmospheric quantities without being in physical contact with the measured air mass. Thereby, a vertical profile of atmospheric quantities (e.g. temperature and/or trace gas mixing ratios) is reconstructed from a sequence of spectrally resolved radi-ance measurements taken at different elevation angles from a single observer position. 25
AMTD
4, 6915–6967, 2011CRISTA-NF measurements with
unprecedented vertical resolution
J. Ungermann et al.
Title Page
Abstract Introduction
Conclusions References
Tables Figures
◭ ◮
◭ ◮
Back Close
Full Screen / Esc
Printer-friendly Version
Interactive Discussion
Discussion
P
a
per
|
Dis
cussion
P
a
per
|
Discussion
P
a
per
|
Discussio
n
P
a
per
|
2010) measure an increasing amount of such spectra simultaneously instead of se-quentially. Due to the observation geometry of limb sounding, emissions by gases in the thermal infrared are summed up over several hundreds of kilometres of air, which makes this technique ideal to detect (trace) gases with small mixing ratios or weak emission lines. In the past, the technique of infrared limb-sounding was successfully 5
used in several satellite experiments, for example by LIMS (Limb Infrared Monitor of the Stratosphere; Gille and Russel III, 1984), SAMS (Stratospheric and Mesospheric Sounder; Drummond et al., 1980), CRISTA (Cryogenic Infrared Spectrometers and Telescopes for the Atmosphere; Offermann et al., 1999), or MIPAS (Michelson Interfer-ometer for Passive Atmospheric Sounding; Fischer et al., 2008) to provide global trace 10
gas distributions.
This paper deals with the evaluation of measurements made by an airborne passive infrared limb-sounder: the Cryogenic Infrared Spectrometers and Telescope for the At-mosphere - New Frontiers (CRISTA-NF), which was operated aboard the high-flying Russian research aircraft M55-Geophysica. The M55-Geophysica is a well-suited car-15
rier for examining the upper troposphere and lower stratosphere (UTLS) due to its ability to ascend to≈20 km and a comparatively large load capacity for this altitude. The optical system of CRISTA-NF consists of the centre telescope and two grating spectrometers of the Space Shuttle experiment CRISTA that was successfully flown on the Shuttle Pallet Satellite SPAS in November 1994 [STS 66] and August 1997 20
[STS 85] (Offermann et al., 1999; Grossmann et al., 2002). CRISTA provided global limb-observations of a variety of trace gases with unprecedented horizontal resolu-tion (and coverage) during its Space Shuttle missions. Numerous small and medium-scale transport and mixing structures were detected in the observed stratospheric trace gas distributions as a result of pronounced exchange of tropical and extra-tropical air 25
masses in the stratospheric surf zone (e.g. Riese et al., 1999b, 2002).
AMTD
4, 6915–6967, 2011CRISTA-NF measurements with
unprecedented vertical resolution
J. Ungermann et al.
Title Page
Abstract Introduction
Conclusions References
Tables Figures
◭ ◮
◭ ◮
Back Close
Full Screen / Esc
Printer-friendly Version
Interactive Discussion
Discussion
P
a
per
|
Dis
cussion
P
a
per
|
Discussion
P
a
per
|
Discussio
n
P
a
per
|
gases change their mixing ratios by an order of magnitude within a vertical range of a few kilometres when transitioning from tropospheric to stratospheric values (Gettel-man et al., 2011). CRISTA-NF made first successful observations in this region dur-ing the tropical aircraft campaigns SCOUT-O3 (Spang et al., 2008; Hoffmann et al., 2009) and AMMA-SCOUT-O3 (Weigel et al., 2010) and observed trace gases like 5
ozone, water vapour, peroxyacetyl nitrate (PAN), CCl4, and HNO3 with the highest two-dimensional resolution up to date (≈1 km vertical×15 km horizontal along flight track).
This paper describes the evaluation of measurements made by CRISTA-NF dur-ing one specific flight of the RECONCILE campaign (Reconciliation of essential pro-10
cess parameters for an enhanced predictability of arctic stratospheric ozone loss and its climate interactions). The RECONCILE campaign took place from January to March 2011. The M55-Geophysica, fitted with more than 20 distinct remote sens-ing and in situ instruments, performed 12 flights dursens-ing this time frame. Flight No. 11 (the second flight of 2 March 2011) will be discussed in this paper exemplarily. This 15
flight was selected because the atmospheric situation during this flight was quite diver-sified and because the sky was cloud-free down to lower altitudes. In addition, data from the MIPAS-STR (Michelson Interferometer for Passive Atmospheric Sounding-STRatospheric aircraft; e.g. Piesch et al., 1996; H ¨opfner et al., 2000; Keim et al., 2008) instrument is available for this flight, which can be used for improving the retrieval 20
with respect to the pointing of CRISTA-NF (see Sect. 2.1) and for the validation of re-trieval results (see Sect. 6.3). The J ¨ulich Rapid Spectral Simulation Code Version 2 (JURASSIC2) is used as forward model and retrieval processor. The Python/C++
based JURASSIC2 and its predecessor were used in several experiments and studies (e.g. Hoffmann et al., 2008; Eckermann et al., 2009; Hoffmann and Alexander, 2009; 25
Ungermann, 2011).
AMTD
4, 6915–6967, 2011CRISTA-NF measurements with
unprecedented vertical resolution
J. Ungermann et al.
Title Page
Abstract Introduction
Conclusions References
Tables Figures
◭ ◮
◭ ◮
Back Close
Full Screen / Esc
Printer-friendly Version
Interactive Discussion
Discussion
P
a
per
|
Dis
cussion
P
a
per
|
Discussion
P
a
per
|
Discussio
n
P
a
per
|
(e.g. Weigel et al., 2010) is the use of a 250 m retrieval grid (compared to 500 m pre-viously) and the corresponding use of all measured spectra of one profile taken at approximately the same spatial sampling. In combination with the small field-of-view (FOV) of the CRISTA-NF instrument, this allows for deriving trace gas mixing ratios with an unprecedented vertical resolution for infrared limb-sounders. In Sect. 5, retrieved 5
trace gas mixing ratios and corresponding diagnostic information are presented. The results show that the vertical resolution is very good and can also be exploited by re-producing structures of small vertical extent (≈500 m diameter) that are consistent over several consecutive profiles. The M55-Geophysica offers unique opportunities for val-idation of results, as many instruments employing different measurement techniques 10
were mounted. We exploit this in Sect. 6 by comparing our retrieved trace gas mixing ratios with in situ measurements of ozone and CFC-11. We also compare our retrieved profiles with profiles retrieved by MIPAS-STR. Compared to CRISTA-NF, MIPAS-STR has a reduced spatial resolution, but a higher spectral resolution, which suggests that their profiles contain less structure but are probably less affected by interfering narrow 15
spectral features. This allows more reliable retrievals for gases with single spectral lines or narrow features, especially in spectrally dense regions and also allows more minor species to be retrieved (Woiwode et al., 2011).
2 CRISTA-NF instrument
CRISTA-NF measures thermal emissions of atmospheric trace gases in the mid-20
infrared region (4–15 µm) using the limb sounding measurement technique. The instru-ment is operated aboard the Russian high altitude research aircraft M55-Geophysica and has successfully participated in two former tropical campaigns. The CRISTA-NF viewing direction is perpendicular to the flight direction of the aircraft looking towards the right hand side. The Earth’s atmosphere is scanned from flight altitude of the 25
AMTD
4, 6915–6967, 2011CRISTA-NF measurements with
unprecedented vertical resolution
J. Ungermann et al.
Title Page
Abstract Introduction
Conclusions References
Tables Figures
◭ ◮
◭ ◮
Back Close
Full Screen / Esc
Printer-friendly Version
Interactive Discussion
Discussion
P
a
per
|
Dis
cussion
P
a
per
|
Discussion
P
a
per
|
Discussio
n
P
a
per
|
range from 4–15 µm is scanned by two Ebert-Fastie grating spectrometers (e.g. Fastie, 1991) that allow for spectrally resolved measurements of the incoming radiance with different spectral resolution (λ/∆λ∼1000 and 500, respectively). For the detection of the radiance, a number of cryogenic semiconductor detectors are used that are op-erated at very low temperatures of about 13 K. A detailed description of the optical 5
system and the cryostat of CRISTA-NF is given by Kullmann et al. (2004).
Due to the low temperatures of the detectors and the whole optical system of the instrument, a good signal to noise ratio and a high measurement speed (1.2 s per spectrum) can be obtained. According to the speed of the aircraft and the fast mea-surement time of 70 s per profile (60 altitude steps/spectra) the horizontal sampling 10
along the flight direction is about 15 km. The aperture of the optical systems pro-vides a FOV of 3 arcmin×30 arcmin (vertical times horizontal) resulting in a vertical extent of ≈300 m at 10 km tangent height (Spang et al., 2008). The combination of this comparably small vertical FOV and the fine vertical sampling provide the basis for the high vertical resolution discussed in Sect. 5.1. In combination with the dense 15
horizontal sampling along the flight track (resulting from the fast measurement speed), two-dimensional trace gas distributions with high spatial resolution are obtained in the UTLS (hereafter “cross-sections”).
2.1 Calibration and level 0/1 processing
The calibration of CRISTA-NF contains three major procedures: a wavelength cali-20
bration, a radiometric absolute calibration and a line-of-sight (LOS) calibration (see Schroeder et al., 2009). The wavelength calibration is used to convert the output volt-ages of the gratings used in the Ebert-Fastie spectrometers to wavelength values. The calibration is based on laboratory measurements of absorption spectra of infrared ac-tive gases. Since the absorption measurements in the laboratory are not accurate 25
AMTD
4, 6915–6967, 2011CRISTA-NF measurements with
unprecedented vertical resolution
J. Ungermann et al.
Title Page
Abstract Introduction
Conclusions References
Tables Figures
◭ ◮
◭ ◮
Back Close
Full Screen / Esc
Printer-friendly Version
Interactive Discussion
Discussion
P
a
per
|
Dis
cussion
P
a
per
|
Discussion
P
a
per
|
Discussio
n
P
a
per
|
radiance spectra by means of calibration parameters obtained from the radiometric absolute calibration utilising blackbody emission spectra. The tangent height of each spectrum measured during the aircraft flights is calculated based on parameters ob-tained from the LOS calibration.
The post-flight wavelength calibration is based on comparisons between these mea-5
sured spectra and simulated spectra using the Reference Forward Model (RFM; Dud-hia et al., 2002). By this approach, updated calibration parameters are determined for the calculation of the wavelength from the recorded grating voltages. As initial input data for the RFM, we use a combination of CLaMS (Chemical Lagrangian Model of the Stratosphere; e.g. Grooß et al., 2005) model data and the climatology of Remedios 10
et al. (2007) in order to obtain a realistic atmospheric state. After a first retrieval, the obtained atmospheric profiles replace the model data for a further (final) refinement of the calibration parameters.
For calculation of the LOS, an accurate knowledge of the M55-Geophysica roll and pitch angles is required. Since the angle information of the M55-Geophysica deter-15
mined by its inertial navigation system and provided by the UCSE (unit for connection with scientific equipment) is not accurate enough for our purposes, we decided to use the very accurate measurements of these quantities by the MIPAS-STR attitude system instead (Keim, 2002). The MIPAS-STR attitude system AHRS (Attitude and Heading Reference System) is rotated by about 90◦with respect to the M55-Geophysica attitude 20
system. Therefore the MIPAS-STR pitch angle corresponds to the M55-Geophysica roll angle and vice versa (to a very good approximation). Angle offsets between the MIPAS-STR and the CRISTA-NF instrument caused by the integration of the two instruments are taken into account and the angle information is corrected to the reference system of the CRISTA-NF instrument.
25
AMTD
4, 6915–6967, 2011CRISTA-NF measurements with
unprecedented vertical resolution
J. Ungermann et al.
Title Page
Abstract Introduction
Conclusions References
Tables Figures
◭ ◮
◭ ◮
Back Close
Full Screen / Esc
Printer-friendly Version
Interactive Discussion
Discussion
P
a
per
|
Dis
cussion
P
a
per
|
Discussion
P
a
per
|
Discussio
n
P
a
per
|
Comparisons between two retrieval results, the first obtained using M55-Geophysica attitude data only and the other using the combination of MIPAS-STR roll and pitch angle information and other quantities from M55-Geophysica attitude system, show a better agreement of simulated and measured spectra and a less noisy behaviour of retrieved quantities for the second one. This confirms our assumption that the utilisation 5
of MIPAS-STR data for the M55-Geophysica roll and pitch angle improves the retrieval results.
The atmospheric radiance enters the CRISTA-NF optical system through a zinc se-lenide (ZnSe) window, which separates the instrument from the surrounding atmo-sphere. The emissivity and transmissivity of this window were determined during the 10
calibration procedure of the AMMA-SCOUT-O3 campaign (see Schroeder et al., 2009) and were used to account for the influence of the ZnSe window on our radiometric calibration. Calibrated limb radiance values are shown in Fig. 1 for a specific detector channel (Low Resolution Spectrometer channel 6). This channel covers the spectral range from 776.0 to 868.0 cm−1and is used for the retrievals discussed in the following 15
sections.
The CRISTA-NF detectors show a non stationary behaviour after illumination changes, which is called detector relaxation. It depends on the illumination intensity as well as on the illumination history. Detector relaxations are therefore also a function of the spectral scanning direction of the gratings, which is reversed after each altitude 20
(tangent height) step (e.g. Riese et al., 1999a). In order to asses the impact of this ef-fect on the limb radiance spectra measured during RECONCILE altitude profiles of the integrated radiance in three representative integrated micro windows (IMW) are shown in Fig. 2 separately for forward and backward spectra. Fortunately, only negligible sys-tematic differences between the two spectra types are visible in these IMWs for the ob-25
AMTD
4, 6915–6967, 2011CRISTA-NF measurements with
unprecedented vertical resolution
J. Ungermann et al.
Title Page
Abstract Introduction
Conclusions References
Tables Figures
◭ ◮
◭ ◮
Back Close
Full Screen / Esc
Printer-friendly Version
Interactive Discussion
Discussion
P
a
per
|
Dis
cussion
P
a
per
|
Discussion
P
a
per
|
Discussio
n
P
a
per
|
conditions, where small relaxation effects were evident. The RECONCILE observa-tions therefore allow, for the first time, to explore the full potential of the combination of a 250 m vertical sampling and a comparably small vertical FOV in terms of achievable vertical resolution (see Sect. 5.1).
For the retrieval, the measured limb radiance spectra (level-1 data) are filtered with 5
respect to clouds or optically thick conditions. The so called cloud index (CI) is a good quantity to handle this issue. It is defined as the ratio between the integrated radi-ances in two specific IMWs. The first from 791.0 to 793.0 cm−1 is dominated by CO2 emissions whereas the second from 832.0 to 834.0 cm−1is located in an atmospheric window region (see Spang et al., 2008). A low CI value indicates the presence of 10
clouds or optically thick conditions due to aerosol background or the water vapour con-tinuum. The threshold for the filtering is set to a value of 3.5 to exclude all spectra influenced by clouds etc. from the retrieval.
3 Retrieval
Here, retrieval is the process of deriving atmospheric constituents from limb-radiance 15
measurements. This is an ill-posed inverse problem, which can be solved by means of a forward model simulating the radiative transport and the instrument on the one hand and a non-linear minimisation on the other hand. LetF:Rn7→Rm be a forward model that maps an n-dimensional discrete representation of the atmosphere x∈Rn (here: a vertical profile) including temperature, pressure, aerosol (or extinction) and trace gas 20
mixing ratios onto a set of m radiance measurements y∈Rm. The inverse problem consists now of finding anx that is (approximately) mapped byF onto measured ra-diancesy. This is problematic as a straightforward inversion is often very sensitive to small changes of the measured radiances caused by noise (or similar effects).
One way to find a stable solution is minimising a cost functionJ:Rn7→R: 25
AMTD
4, 6915–6967, 2011CRISTA-NF measurements with
unprecedented vertical resolution
J. Ungermann et al.
Title Page
Abstract Introduction
Conclusions References
Tables Figures
◭ ◮
◭ ◮
Back Close
Full Screen / Esc
Printer-friendly Version
Interactive Discussion
Discussion
P
a
per
|
Dis
cussion
P
a
per
|
Discussion
P
a
per
|
Discussio
n
P
a
per
|
The matrixSǫ∈Rm×mis thereby the covariance matrix of the measurement errors. We assume an uncorrelated error budget of 1 % for the retrieval as a simple approximation to the true covariance matrix. The second term inJ(right side of Eq. 1) is a regularisa-tion term, which implies that minimising this cost funcregularisa-tion is a well-posed approximaregularisa-tion to the original ill-posed inverse problem. The regularisation constraint stabilises the 5
solution against measurement errors and allows the introduction of a priori knowledge about the atmosphere. The setup of the a priori vectorxa∈Rnis described in Sect. 3.2,
while the setup of the regularisation matrix is described in Sect. 3.3. The cost func-tion is minimised by a truncated Quasi-Newton iterafunc-tion formula employing an adjoint model to calculate the required Jacobian matrixF′ of the forward model (Ungermann 10
et al., 2010).
3.1 Radiative transport model
A single radiative transfer calculation of our forward model simulates an infinitesimal thin beam of radiation along the LOS, also called a “pencilbeam”, which neglects effects of FOV, etc. Each pencilbeam maps the atmospheric state onto a single radiance value. 15
Each pencilbeam is determined by an observer position, a viewing direction, and a spectral range. First, a ray-tracing step is performed using a 3-D ray-tracing rou-tine (Hase and H ¨opfner, 1999) that determines the LOS. Using this interpolated LOS, the emissivity growth approximation method (EGA; e.g. Weinreb and Neuendorffer, 1973; Gordley and Russell, 1981) and the Curtis-Godson Approximation (CGA; Curtis, 20
1952; Godson, 1953) are used to approximate the emission and absorption processes along the LOS to determine incoming radiances. These are in turn combined using a simple regression scheme to minimise the deviation to a more exact line-by-line model (Weigel et al., 2010). Compared to conventional line-by-line calculations, the EGA and CGA methods are about a factor 1 000 faster, since the radiative transfer 25
AMTD
4, 6915–6967, 2011CRISTA-NF measurements with
unprecedented vertical resolution
J. Ungermann et al.
Title Page
Abstract Introduction
Conclusions References
Tables Figures
◭ ◮
◭ ◮
Back Close
Full Screen / Esc
Printer-friendly Version
Interactive Discussion
Discussion
P
a
per
|
Dis
cussion
P
a
per
|
Discussion
P
a
per
|
Discussio
n
P
a
per
|
HITRAN 2008 (HIgh resolution TRANsmission; Rothman et al., 2009) including all up-dates up to August 2011 for generating the tables used for the following retrievals.
Each measurement is affected by the FOV of the instrument, which can be approxi-mated by a Gaussian with a FWHM of about 3 arcmin for CRISTA-NF. To properly ac-commodate this effect, the convolution of the weighting function with incoming radiation 5
is numerically integrated, which implies the casting of several pencilbeams per obser-vation at different elevation angles. This is illustrated in Fig. 3. Calculated pencilbeams are shown as dotted and straight black lines. The LOS of radiance measurements are shown as straight black lines, with one FOV shown as a dark underlayed cone. In this example, the radiance of the upper measurement would be computed as the weighted 10
average of the radiances computed by the upper three pencilbeams.
The primary retrieval targets of our analysis are CCl4, CFC-11, H2O, HNO3, O3, and ClONO2. Secondary retrieval targets are aerosol, temperature, PAN, CFC-113, and HCFC-22. These latter trace gases are mainly included in the retrieval process to minimise their impact on uncertainties in the primary retrieval targets. In addition, 15
contributions of CO2, HNO4, OCS, and CFC-114 are taken into account when calcu-lating limb-radiance values. However, the mixing ratios of these non-retrieved trace gases are fixed to climatological values. Temperature, aerosol, CCl4, CFC-11, H2O, PAN, CFC-113, and HCFC-22 are retrieved in the altitude range from 0 to 25 km while HNO3, O3, and ClONO2are retrieved between 0 and 65 km.
20
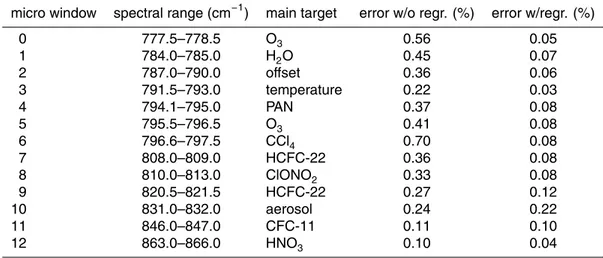
Table 1 summarises the IMWs employed in the following retrievals. They are also depicted as grey boxes in Fig. 1. The selection of these IMWs is largely identical with the setup previously used by Weigel et al. (2010). In addition, we included a frequency range for the retrieval of ClONO2, which was previously successfully used for CRISTA satellite retrievals (Riese et al., 1997, 1999a), and three frequencies to derive the sec-25
ondary retrieval targets CFC-113 and HCFC-22. We do not spectrally resolve radiance within a IMW, but use only one integrated radiance value.
AMTD
4, 6915–6967, 2011CRISTA-NF measurements with
unprecedented vertical resolution
J. Ungermann et al.
Title Page
Abstract Introduction
Conclusions References
Tables Figures
◭ ◮
◭ ◮
Back Close
Full Screen / Esc
Printer-friendly Version
Interactive Discussion
Discussion
P
a
per
|
Dis
cussion
P
a
per
|
Discussion
P
a
per
|
Discussio
n
P
a
per
|
limb-radiances as calculated by the CGA and EGA method. From the retrieved pro-files, a subset of 30 well-converged profiles is selected in roughly regular temporal intervals. Using these profiles, the regression scheme is trained using the method of Weigel et al. (2010). The flight is then re-evaluated using the regression parameters derived in this way. Table 1 shows the standard deviation per IMW between our forward 5
model and the RFM with and without regression correction for all retrieved profiles. The regression reduces the standard deviation of model difference from up to 1 % down to at most 0.22 %. In addition, the mean bias (not listed) is reduced from up to 1.2 % down to comparatively negligible 0.02 %.
In contrast to previous CRISTA-NF studies, we employ the full vertical sampling 10
(≈250 m) in our retrieval by combining measurements for both scanning directions of the spectrometer grating (see also Sect. 2.1).
The retrieval grid has been chosen to follow the typical tangent point altitude distance of 250 m below 20 km altitude. Even though upwards looking spectra are taken and used, it is not expected to attain this fine resolution between aircraft altitude and 20 km. 15
Above 20 km, the retrieval grid distance is increased to 1 km, followed by a second increase to 2 km above 30 km. The highest retrieval grid point is located at 66 km. All altitudes mentioned are geometric altitudes.
3.2 A priori and model data
The regularisation requires an atmospheric state vectorxa and also standard
devia-20
tions for all involved quantities. We use three sources for these parameters.
The first important source of a priori data is the ECMWF ERA-Interim (Dee et al., 2011) data, which supplies temperature, pressure, and water vapour on a 3-D grid with horizontal resolution of 1.125◦ and a temporal sampling of 6 h. As ECMWF does not supply standard deviations for the model data, these need to be taken from a diff er-25
AMTD
4, 6915–6967, 2011CRISTA-NF measurements with
unprecedented vertical resolution
J. Ungermann et al.
Title Page
Abstract Introduction
Conclusions References
Tables Figures
◭ ◮
◭ ◮
Back Close
Full Screen / Esc
Printer-friendly Version
Interactive Discussion
Discussion
P
a
per
|
Dis
cussion
P
a
per
|
Discussion
P
a
per
|
Discussio
n
P
a
per
|
For the secondary retrieval target PAN, we use a zero-profile as a priori value and an a priori standard deviations as estimated by Glatthor et al. (2007).
For the other trace gases, we use the climatology of Remedios et al. (2007), which is currently the most comprehensive climatology with respect to number of contained trace gas species used in the evaluation of infrared limb-sounding. It contains both 5
mean values and associated standard deviations for all our retrieval targets and back-ground gases. The mean values for CO2 have been adjusted for the typical annual increase. Since this climatology has several short-comings, e.g. too small mean val-ues for HCFC-22 and CFC-113 (Dufour et al., 2005; Weigel et al., 2010), we decided to make these gases secondary retrieval targets, whereas previous CRISTA-NF studies 10
did not retrieve them.
3.3 Regularisation matrix
We use a Tikhonov regularisation (Tikhonov and Arsenin, 1977) to assembleS−a1. The simplest choice for the Tikhonov regularisation matrix is an identity matrix. In com-bination with an a priori vector xa, this selects the solution x with the smallest norm
15
||x−xa||2from all possible solutions. Also higher order derivatives may be constrained
(Twomey, 1977). Here, a weighted combination of the two approaches is used that is more flexible than either alone.
Two matricesL0andL1∈Rn×ncorresponding to regularisation of the absolute value and the first order derivative are defined. ThenS−a1is set to
20
S−a1=(α0)2L0TL0+(α1)2L1TL1 (2)
with the tuning parametersα0and α1∈R. LetM∈Rn×n be a diagonal matrix with the reciprocal values of the retrieval quantity standard deviations σi on its diagonal. We then defineL0=M.
TheL1matrix is a simple Tikhonov regularisation matrix of first order, adjusted for the
25
AMTD
4, 6915–6967, 2011CRISTA-NF measurements with
unprecedented vertical resolution
J. Ungermann et al.
Title Page
Abstract Introduction
Conclusions References
Tables Figures
◭ ◮
◭ ◮
Back Close
Full Screen / Esc
Printer-friendly Version
Interactive Discussion
Discussion
P
a
per
|
Dis
cussion
P
a
per
|
Discussion
P
a
per
|
Discussio
n
P
a
per
|
i andi+1 of the atmospheric statex. Then, let the scaling matrixN∈Rn×nbe defined as a diagonal matrix with qcq/hi on its diagonal, where cq∈R defines a quantity
specific correlation length. With these diagonal helper matrices, theL1 matrix would
be defined as
L1=M√·N
2
−1 1 0 ... 0 0 −1 1 . .. ...
..
. . .. ... ... 0 0 ... 0 −1 1 0 ... 0 0 0
. (3)
5
For cq=1 and without the scaling of M, ||L1x|| approximates the Euclidean norm of the first order derivative of the continuous function sampled by the state vectorx. The scaling byMgives a simple altitude-dependent regularisation that weakens the regu-larisation, if a quantity is more variable at that specific altitude than at other heights. For
α0=α1=1, this Tikhonov regularisation is very similar to the auto-regressive approach 10
in optimal estimation (e.g. Steck and von Clarmann, 2001). Indeed, we found that usingcq=α0=α1=1 delivers already very useful results. For multi-target retrievals,
L1 is assembled as a block diagonal matrix with one block for each target, each
de-fined as described above. The correlation lengths chosen for the presented results are collected in Table 2.
15
As a bias of the absolute values of the solutionxf towards a priori vectorxais quite
often seen as a problem, we reducedα0 to√0.1. This corresponds to a ten-fold in-crease of the variances for the regularisation with respect to absolute value. Reducing
α0 further was detrimental to the convergence of some profiles. However, with the strength of√0.1, the bias in the results apparent by evaluating the measurement con-20
AMTD
4, 6915–6967, 2011CRISTA-NF measurements with
unprecedented vertical resolution
J. Ungermann et al.
Title Page
Abstract Introduction
Conclusions References
Tables Figures
◭ ◮
◭ ◮
Back Close
Full Screen / Esc
Printer-friendly Version
Interactive Discussion
Discussion
P
a
per
|
Dis
cussion
P
a
per
|
Discussion
P
a
per
|
Discussio
n
P
a
per
|
4 Diagnostics
An important diagnostic tool is the averaging kernel matrixA∈Rn×nthat maps the true atmospheric statext∈Rn onto the retrieval result (neglecting the influence of a priori
information and noise):
A=S−a1+F′(xf)TS−ǫ1F′(xf)
−1
F′(xf)TSǫ−1F′(xf). (4)
5
It consists of the matrix product between the gain matrixG∈Rn×m and the Jacobian matrixF′(xf) evaluated at the solutionxfwithGdefined as
G=S−a1+F′(xf)TS−ǫ1F′(xf)
−1
F′(xf)TS−ǫ1. (5)
The averaging kernel matrix can be analysed to derive useful quantities like measure-ment contribution or resolution. The measuremeasure-ment contribution is calculated by sum-10
ming up all elements of a row of the averaging kernel matrix, which typically gives a value between zero and one. This value indicates the influence of a priori information of zeroth order on the retrieval result (a value of “1” indicates a high measurement con-tribution and a value of “0” indicates a high a priori concon-tribution). The simplest measure of vertical resolution is the inverse of the diagonal entries ofA. The measure employed 15
in this paper is the FWHM of the matrix rows.
To deduce the horizontal resolution along the LOS, the usual averaging kernel matrix does not contain enough information. Instead of the map between the 1-D true state and the 1-D retrieval result, one requires a map between the 2-D true state and the 1-D result to capture the spatial dimension along the LOS. This can be straightforwardly 20
generated by extending the 1-D retrieval solutionxf horizontally into a 2-D planex˜f in
along-sight direction and calculating the Jacobian matrix ˜F′(x˜f)∈Rd·n×d·n of a 2-D
for-ward modelF˜ with respect to this 2-D representation. The diagnostic formula
AMTD
4, 6915–6967, 2011CRISTA-NF measurements with
unprecedented vertical resolution
J. Ungermann et al.
Title Page
Abstract Introduction
Conclusions References
Tables Figures
◭ ◮
◭ ◮
Back Close
Full Screen / Esc
Printer-friendly Version
Interactive Discussion
Discussion
P
a
per
|
Dis
cussion
P
a
per
|
Discussion
P
a
per
|
Discussio
n
P
a
per
|
then allows to deduce the horizontal resolution along the LOS or to better compare against model data by evaluating the matrixG ˜F′(x˜f) (Ungermann et al., 2011).
To derive error estimates for the result, the gain matrix G is the most important tool, as it can be used to convert an uncertainty in the measurement domain into an uncertainty in the retrieval result. In this way, the effect of instrument errors can be 5
easily calculated as
Sinstrument=GSǫGT. (7) In a similar manner, the effect of the uncertainty in background gases can be esti-mated by first assembling a covariance matrix describing (an estimate of) the known distribution of the gas in question. This matrix is then converted into a covariance 10
matrix describing the following uncertainty in the measurements by multiplications with the Jacobian matrix of the forward model with respect to this trace gas. For example, letSHNO4 be the covariance matrix of the HNO4 distribution, which is one of our not-retrieved background gases. LetxHNO
4 be our best estimate of the HNO4mixing ratios
present during the time of our measurement. LetF′(xHNO
4) be the Jacobian matrix of
15
the forward model with respect to HNO4. The effect of the uncertainty of HNO4mixing ratio on the retrieval result can then be estimated as
Serror by HNO4=GF′(xHNO
4)SHNO4F
′(x
HNO4)
TGT. (8)
The effect of elevation angle errors of individual spectra is covered by the error budget of 1 % per measurement. However, a potential systematic elevation angle offset error 20
consistent over all spectra of one profile is treated separately: the absolute error in-duced by such an elevation angle offset in the presence of strong vertical gradients is very large, but not very meaningful, as a different angle places a very similar structure at a slightly different altitude. A slight shift of a peak in mixing ratio results thus in a very large absolute error in the vicinity of this structure.
25
AMTD
4, 6915–6967, 2011CRISTA-NF measurements with
unprecedented vertical resolution
J. Ungermann et al.
Title Page
Abstract Introduction
Conclusions References
Tables Figures
◭ ◮
◭ ◮
Back Close
Full Screen / Esc
Printer-friendly Version
Interactive Discussion
Discussion
P
a
per
|
Dis
cussion
P
a
per
|
Discussion
P
a
per
|
Discussio
n
P
a
per
|
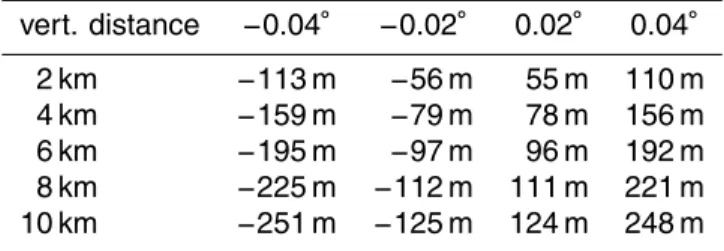
profiles are then stretched and shrinked below the observer altitude to compensate for the altitude distortion induced by the different elevation angle offset. The maximal difference for each grid point between the original profile and the two corrected ones is used as error estimate. One should keep in mind that in addition to this elevation angle offset induced error, the whole profile might be slightly shifted in height as shown in 5
Table 3.
The forward model error is estimated by comparing the radiances produced by our forward model for the retrieved atmospheres to calculations employing the RFM. The error varies over tangent altitude and spectral band and its standard deviation lies between 0.1 % and 0.2 % for different IMWs (see Table 1).
10
Our diagnostic system would also allow the creation and use of an accurate mea-surement error covariance matrix for the retrieval itself. However, we found that us-ing such a matrix containus-ing many systematic, correlated errors causes our retrieval algorithm to accept solutions, with systematic discrepancies of more than 30 % be-tween simulated and measured radiances. Thus, we assume an uncorrelated error 15
covariance matrix with an assumed error of 1 %, as was already used by Weigel et al. (2010).
We calculate the error with respect to all non-retrieved gases, instrument errors (gain, offset, elevation angle offset), forward model error, and spectroscopic line data uncer-tainties. These errors are summed up quadratically and the square root of the result is 20
referred to as “total” error. Even though, we do not employ a real covariance matrix for the a priori state, we find it useful to include the smoothing errorSs=(A−I)Sa(A−I)
T
, as this grows only to significant proportions in regions where insufficient measurement information is present and thereby highlights this defect. The error term including both the total and the smoothing error is referred to as “total+smooth” and is used below for 25
AMTD
4, 6915–6967, 2011CRISTA-NF measurements with
unprecedented vertical resolution
J. Ungermann et al.
Title Page
Abstract Introduction
Conclusions References
Tables Figures
◭ ◮
◭ ◮
Back Close
Full Screen / Esc
Printer-friendly Version
Interactive Discussion
Discussion
P
a
per
|
Dis
cussion
P
a
per
|
Discussion
P
a
per
|
Discussio
n
P
a
per
|
4.1 Registration of profiles
The elevation angle of measured spectra is an important quantity when evaluating limb sounder measurements. The relative elevation angle between adjacent lines-of-sights (corresponding to two limb-radiance spectra) of one profile is rather well known from the CRISTA-NF attitude system. However, external absolute attitude information (such 5
as provided by the MIPAS-STR attitude system) is needed to transfer these values into absolute elevation angles. Due to drifts of the CRISTA-NF attitude system, the external absolute attitude information has to be continuously updated during the whole flight.
In the attitude correction step, one elevation angle offset per flight (arising from the slightly different orientations of the attitude systems of MIPAS-STR and CRISTA-NF) 10
is derived from roll and pitch angle measurements taken during a quiet time (before take-offor after landing). For some flights, this is difficult, as the time-span, where both instruments recorded valid attitude measurements, is very short. For other flights, no such measurements are available. To validate the elevation angle offset derived in this manner and to evaluate flights, for which no quiet time period can be evaluated, the 15
reference elevation angle offset must also be retrieved from the observed spectra. Estimating this basic elevation angle offset during the retrieval is not trivial, as it is a very non-linear parameter and the retrieval often accommodated other retrieved quantities (especially temperature) to the initial guess used for the elevation angle off -set. Instead, we perform a series of flight retrievals with different, fixed elevation angle 20
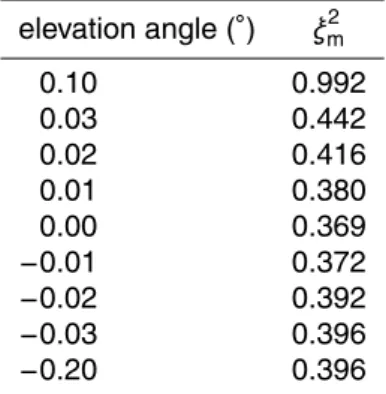
offsets and compare the average of the fit of measurements to the simulated mea-surements for the retrieval result over all profiles of one flight. To focus on the CO2 emissions, we fix temperature to the values supplied by ECMWF. Even though any bias in ECMWF temperatures might affect the derived elevation angle, this bias is ex-pected to be small as we take into account all profiles of one flight representing a large 25
AMTD
4, 6915–6967, 2011CRISTA-NF measurements with
unprecedented vertical resolution
J. Ungermann et al.
Title Page
Abstract Introduction
Conclusions References
Tables Figures
◭ ◮
◭ ◮
Back Close
Full Screen / Esc
Printer-friendly Version
Interactive Discussion
Discussion
P
a
per
|
Dis
cussion
P
a
per
|
Discussion
P
a
per
|
Discussio
n
P
a
per
|
angles derived by the calibration process were correct. As the minimum is not very sharp, we assume an ad hoc standard deviation for the elevation angle offset of 0.02◦.
5 Results for flight 11
This section presents the results for the 11th RECONCILE flight that took place on 2 March 2011 between 09:34 and 13:35 (UTC), hereafter called flight 11. Only part of 5
the derived quantities are shown in plots below. Only the six primary retrieval targets CCl4and CFC-11, ClONO2, H2O, HNO3 and O3 will be discussed in detail. The sec-ondary retrieval targets are only retrieved to reduce the error for the primary retrieval targets. They behave similar to the primary retrieval targets, but typically with a de-creased resolution and/or measurement content. We just like to note that the resulting 10
profiles for CFC-113 and HCFC-22 deliver mixing ratios that are roughly consistent with polar winter profiles derived by Atmospheric Chemistry Experiment Fourier Transform Spectrometer (ACE-FTS; Bernath et al., 2005).
The flight path of the M55-Geophysica during RECONCILE flight 11 is depicted in Fig. 4. The plane started from Spitsbergen and flew first towards north. It then turned 15
south and flew straight towards the airport of Kiruna. Flight locations, from which pro-files were measured by CRISTA-NF, are marked by crosses. The tangent point loca-tions of such profiles are shown as circles with colour-coding indicating the geometric altitude of the tangent point. Two profiles have been highlighted, which will be refer-enced below. The profile taken at 11:07 (UTC) coincides roughly with the air mass 20
traversed by the aircraft during its ascent. It is also representative for the first part of the flight inside the remnant of the polar vortex with the CRISTA-NF measurements covering air inside and below the polar vortex. The other highlighted profile has been selected to be representative for the second part of the flight outside this region. Only a subset of the measured profiles is presented. To filter out profiles with obvious de-25
AMTD
4, 6915–6967, 2011CRISTA-NF measurements with
unprecedented vertical resolution
J. Ungermann et al.
Title Page
Abstract Introduction
Conclusions References
Tables Figures
◭ ◮
◭ ◮
Back Close
Full Screen / Esc
Printer-friendly Version
Interactive Discussion
Discussion
P
a
per
|
Dis
cussion
P
a
per
|
Discussion
P
a
per
|
Discussio
n
P
a
per
|
5.1 Derived trace gas mixing ratios
In this section, derived trace gas mixing ratios and associated diagnostic quantities are presented and discussed.
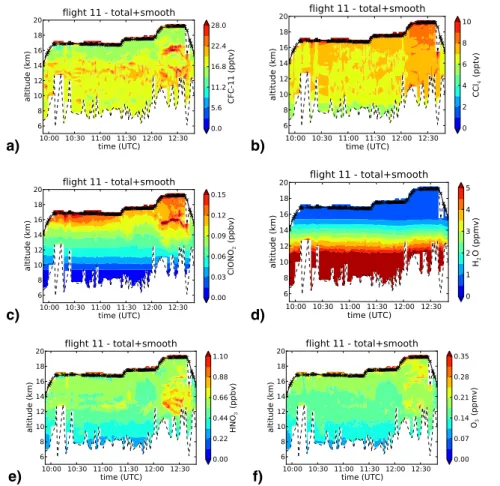
Figure 5 shows six cross-sections with derived trace gas mixing ratios. The plots are assembled from a series of retrieved profiles. The time, at which the profile was taken is 5
shown on the horizontal axis, while the altitude of retrieved atmospheric quantities de-termines the vertical axis. The thick black line represents the geometric altitude of the instrument at the given time. Crosses on this line indicate points in time, where a pro-file could be successfully measured and retrieved. The black dashed lines represent the altitudes of the tangent points of the lowest and highest valid measurement. Only 10
atmospheric quantities located between the dashed lines are plotted, as only these are sufficiently determined by measurements in contrast to being more determined by a priori information.
Panel (a) shows CFC-11 mixing ratios. One can see the remnant of the polar vortex on the upper left and remnants of vortex air to the upper right. Please note the thin 15
filament of increased CFC-11 mixing ratio at≈16 km on the right, probably originating from mid-latitudes, within air masses containing a high fraction of high-latitude air. This thin filament has a vertical extent of 0.5 to 1 km and its signature can be found in all primary target species except water vapour. The distribution of CCl4 in panel (b) is very similar to the distribution of CFC-11, but less filaments are visible due to the de-20
creased vertical resolution compared to CFC-11. The ClONO2 mixing ratios depicted in panel (c) are anti-correlated with CFC-11 mixing ratios as expected from their typical distributions. Panel (d) shows that the water vapour content in this polar atmosphere is very low, as expected. The colour scale for this graph has been chosen to be consis-tent with our error bar, implying that we cannot significantly resolve more details than 25
AMTD
4, 6915–6967, 2011CRISTA-NF measurements with
unprecedented vertical resolution
J. Ungermann et al.
Title Page
Abstract Introduction
Conclusions References
Tables Figures
◭ ◮
◭ ◮
Back Close
Full Screen / Esc
Printer-friendly Version
Interactive Discussion
Discussion
P
a
per
|
Dis
cussion
P
a
per
|
Discussion
P
a
per
|
Discussio
n
P
a
per
|
part of the figure as well as the structure at 12 km to the right, where air with increased HNO3mixing ratio seemingly surrounds a filament with decreased mixing ratio.
The associated errors are shown in Fig. 6. Due to the uncertainty in elevation angle, the error becomes especially large in the vicinity of large vertical gradients, as can be seen most easily in panel (a) around 12:30. Due to the uncertainty in position of the 5
thin CFC-11 filament, the relative error is increased to more than 10 %.
The measurement contribution for the two profiles highlighted in Fig. 4 is shown in Fig. 7. Again, only data points in between the highest and lowest tangent point are depicted. These two profiles have been selected to be typical for the first part of the flight inside the polar vortex (11:07 (UTC) in panel a) and for the second part of the 10
flight above the large remnant of vortex air (12:30 in panel b). The unit-less mea-surement contribution is close to 1 within the height range covered by meamea-surements. Towards lower altitudes, the measurement contribution becomes smaller as denser air and increasing cross-talks reduce the signal strength. The measurement contribution for water vapour increases first and then drops towards the observer altitude as the 15
signal of these low mixing ratios is below the detection limit in the spectral range used for the retrieval. Similarly, the measurement contribution of ClONO2first increases and then drops towards the surface due to a lack of signal. The increase above 1 is an artefact of the low trace gas mixing ratio, which are below the detection limit of the em-ployed ISWs. It can be removed, e.g. by not retrieving ClONO2in the lowest 10 km of 20
the profile but assuming the a priori values instead. This delivers similar results above 10 km with a measurement contribution behaving very much like that of O3. However, the step in ClONO2 mixing ratios between the a priori values in the lower part of the profile and the retrieved mixing ratios causes other undesirable artefacts in retrieved mixing ratios and diagnostics, so it was not applied to the presented results. A similar 25
AMTD
4, 6915–6967, 2011CRISTA-NF measurements with
unprecedented vertical resolution
J. Ungermann et al.
Title Page
Abstract Introduction
Conclusions References
Tables Figures
◭ ◮
◭ ◮
Back Close
Full Screen / Esc
Printer-friendly Version
Interactive Discussion
Discussion
P
a
per
|
Dis
cussion
P
a
per
|
Discussion
P
a
per
|
Discussio
n
P
a
per
|
vertical gradients on the other hand. Except for water vapour, the vertical resolution starts generally below 500 m at the observer altitude and worsens with decreasing al-titude. Especially CFC-11 is well resolved, with a vertical resolution of ≈400 m for ≈2 km below the aircraft. Such a high vertical resolution is exceptional for a limb sounder instrument. These results show that increasing the vertical sampling density 5
of a limb-sounder to this granularity still improves the quality of the retrieval results. The feasibility of limb-observations with such a high vertical resolution is also a valu-able finding for the proposed satellite-based limb-imaging technique (Riese et al., 2005; ESA, 2008) that will also be characterised by a combination of high vertical sampling (order of 500 m) and a comparably small vertical FOV. Simulations for the air-borne 10
GLORIA instrument by Ungermann et al. (2010) indicate that imager instruments with an even higher vertical sampling (order of 125 m) than offered by CRISTA-NF can attain vertical resolutions down to 250 to 300 m. For CFC-11, ozone, and HNO3, the vertical resolution stays well below 1 km over the whole relevant altitude range, while CCl4and ClONO2 become worse. No IMW without strongly interfering species is available for 15
the latter gases, so they are more affected by loss of signal at lower altitudes. There, the transmissivity of most of the employed IMWs drops down to 0.2–0.5 from about 0.9 at observer altitude, which together with the increasing FOV explains the decrease in resolution.
The horizontal resolution along the LOS in Fig. 9 gives insight into the potential 20
effect of horizontal gradients along the LOS on derived trace gas mixing ratios. For the same profiles, the diameter of the sphere containing all elements of the averaging kernel matrix equal or larger than half of the maximum element of each row is depicted. The horizontal resolution along the LOS starts out with about 100 km at the observer altitude and increases quickly in both cases to 300–400 km. Towards lower altitudes, 25
AMTD
4, 6915–6967, 2011CRISTA-NF measurements with
unprecedented vertical resolution
J. Ungermann et al.
Title Page
Abstract Introduction
Conclusions References
Tables Figures
◭ ◮
◭ ◮
Back Close
Full Screen / Esc
Printer-friendly Version
Interactive Discussion
Discussion
P
a
per
|
Dis
cussion
P
a
per
|
Discussion
P
a
per
|
Discussio
n
P
a
per
|
6 Validation
This section compares retrieved trace gas mixing ratios against the corresponding val-ues measured by other instruments. The M55-Geophysica is capable of carrying many different scientific instruments. During the RECONCILE campaign, more than 20 dif-ferent remote sensing and in situ instruments were mounted on the aircraft. This offers 5
the unique opportunity to compare the results of our CRISTA-NF study towards the measurements of different instruments. On the one hand, there are in situ instruments, two of which also measure primary retrieval targets of ours (CFC-11 and ozone, see below). On the other hand, there is the passive infrared limb-sounder MIPAS-STR, which has been extensively validated in the past and can therefore also be seen as 10
a reference, taking into account the different capabilities with respect to spatial and spectral resolution.
While we cannot validate all our primary retrieval targets, showing the consistency of CFC-11 and especially ozone to in situ measurements provides confidence in the results for other targets.
15
6.1 Comparison with HAGAR
The first comparison shows CFC-11 mixing ratios measured by the in situ High Alti-tude Gas AnalyzeR (HAGAR; Riediger et al., 2000; Werner et al., 2010) against the retrieved CFC-11 quantities at the observer altitude. Figure 10 shows mixing ratios retrieved from CRISTA-NF measurements as a blue line with error bars indicating the 20
“total+smooth” error and HAGAR mixing ratios as a green line with crosses indicating the time of measurements. Errors of the HAGAR measurements are smaller than the green symbols. The observer altitude is shown as a dotted black line with a second axis to the right. The CFC-11 mixing ratios overall agree with one another, mostly even within the one sigma indicated by the error bar. Remaining discrepancies can 25
AMTD
4, 6915–6967, 2011CRISTA-NF measurements with
unprecedented vertical resolution
J. Ungermann et al.
Title Page
Abstract Introduction
Conclusions References
Tables Figures
◭ ◮
◭ ◮
Back Close
Full Screen / Esc
Printer-friendly Version
Interactive Discussion
Discussion
P
a
per
|
Dis
cussion
P
a
per
|
Discussion
P
a
per
|
Discussio
n
P
a
per
|
CRISTA-NF CFC-11 mixing ratio from 10:40 towards 11:15 (UTC) precedes the corre-sponding increase of HAGAR CFC-11 mixing ratio. While the in situ instrument sam-ples air from the remnant of the polar vortex, the CRISTA-NF instrument already sees also air from outside the vortex, which contains larger CFC-11 mixing ratios. A sec-ond comparison is shown in Fig. 11. The M55-Geophysica ascended from the airport 5
to flight altitude between 09:34 and 10:04 (UTC). During this time frame, the in situ instruments including HAGAR already collected data. We assembled the ascent mea-surements by HAGAR in Fig. 11 with green crosses indicating data points. CRISTA-NF measured roughly the same air mass between 10:55 and 11:20 (UTC). We interpolate our retrieved profiles to approximately match the air masses measured by the in situ in-10
strument. The CFC-11 profile derived from this interpolation is plotted in blue including error bars. While the more sparsely sampled HAGAR profile does not show the same structures as the CRISTA-NF profile, they agree well with respect to average absolute values.
6.2 Comparison with FOZAN
15
The second comparison proceeds similar to the first, but for ozone mixing ratios as measured by the Chemiluminescent Fast Ozone Analyzer (FOZAN; Ulanovsky et al., 2001). Figure 12 shows again the mixing ratios at observer altitude, which largely agree within error bars. Especially during the first half of the flight, where the ozone mixing ratios are very stable, the values of the instruments are very close, with typically 20
slightly lower values for CRISTA-NF. The underestimation in ozone at observer altitude seems correlated to overestimation in CFC-11, which indicates that this might be the effect of horizontal gradients along the LOS. Peaks and troughs in ozone mixing ratio as measured by FOZAN between 11:15 and 12:15 (UTC) are also measured by CRISTA-NF but with a time-delay. This might indicate that these structures stem from filaments 25
that are not completely orthogonal to the flight path.
AMTD
4, 6915–6967, 2011CRISTA-NF measurements with
unprecedented vertical resolution
J. Ungermann et al.
Title Page
Abstract Introduction
Conclusions References
Tables Figures
◭ ◮
◭ ◮
Back Close
Full Screen / Esc
Printer-friendly Version
Interactive Discussion
Discussion
P
a
per
|
Dis
cussion
P
a
per
|
Discussion
P
a
per
|
Discussio
n
P
a
per
|
very well with one another, mostly within much less than one sigma of the CRISTA-NF error. Even though the CRISTA-NF instrument has a much worse vertical resolution and also in the presence of a time-shift of more than one hour, there is a remarkable agreement even in the fine structure. For example, the decrease in ozone at 13.5 km is captured just as the increase at 14.0 km.
5
The agreement between FOZAN and CRISTA-NF is much better for the ascent pro-file than for the comparison along the flight track. The air measured by FOZAN during the ascent of the M55-Geophysica lies well within the region, from which the most ra-diation is received by CRISTA-NF, so that a better fit is actually expected. This strongly indicates that the discrepancy in ozone mixing ratios at the observer position evident 10
in Fig. 12 is an artefact of the spatial averaging characteristics of the remote sensing measurement method.
6.3 Comparison with MIPAS-STR
This section compares one exemplary profile measured by CRISTA-NF against one profile as measured by the MIPAS-STR instrument (Piesch et al., 1996). Comparisons 15
for other profiles show qualitatively the similar agreement, depending somewhat on how structured the atmosphere is. A detailed description of the MIPAS-STR retrieval for this campaign is given by Woiwode et al. (2011); this paper also presents 2-D cross-sections of HNO3 mixing ratios from both instruments, which underline the generally amazing level of agreement. For the profile-based comparisons shown here, a profile 20
taken at 12:30 in the latter part of the flight has been selected, as it contains the most vertical variability and the most complex structure. The mixing ratios of most primary species derived by CRISTA-NF (except for CCl4) are also derived by MIPAS-STR al-beit at a decreased spatial resolution due to the different measurement geometry and FOV of MIPAS-STR. The measurement grid distance of MIPAS-STR is mainly 1 km 25
AMTD
4, 6915–6967, 2011CRISTA-NF measurements with
unprecedented vertical resolution
J. Ungermann et al.
Title Page
Abstract Introduction
Conclusions References
Tables Figures
◭ ◮
◭ ◮
Back Close
Full Screen / Esc
Printer-friendly Version
Interactive Discussion
Discussion
P
a
per
|
Dis
cussion
P
a
per
|
Discussion
P
a
per
|
Discussio
n
P
a
per
|
on temperature and atmospheric constituents above the flight path. Depending on the sampling program, the horizontal sampling density is between 25 and 40 km. The FOV is 0.44◦(full cone). The MIPAS-STR retrieval grid is mainly finer with a grid distance of 500 m in the relevant altitude range except for the uppermost observation geometries. We mention, that the error-budget for the MIPAS-STR retrieval results is generated dif-5
ferently compared to the CRISTA-NF error budget (e.g. conservative spectroscopic line data error, no smoothing error; compare Woiwode et al., 2011). For the MIPAS-STR re-trievals, spectral line data was taken from the MIPAS database (see Flaud et al. (2006) and the references cited therein), while for the CRISTA-NF retrievals HITRAN 2008 was applied, probably resulting in slightly different results.
10
Panel (a) of Fig. 14 shows side by side the ozone profiles retrieved by the two instru-ments including error bars and the a priori values used for the CRISTA-NF retrieval. A very good agreement of absolute values is found above 13 km, even though some of the dips in ozone mixing ratio seem to be not fully resolved by MIPAS-STR. Taking into account the coarser resolution of MIPAS-STR, the profiles agree largely within the 15
corresponding error bars.
The same is largely true for the CFC-11 profile shown in panel (b). The fine filament of increased CFC-11 mixing ratios around 16 km altitude is also not fully resolved by MIPAS-STR; instead a lower peak is seen at a slightly increased altitude. However, the overall structure of the profiles agree qualitatively and aside the fine details related to 20
filaments, the absolute values are also in agreement.
The HNO3 retrieval results are compared in panel (c). Both instruments resolve three distinct peaks at 17 km, 14 km, and 12 km. CRISTA-NF generally sees slightly increased HNO3 mixing ratios compared to MIPAS-STR and suggests also a larger vertical extent of the HNO3structures. This might indicate a systematic overestimation 25
of this trace gas by CRISTA-NF.