www.nat-hazards-earth-syst-sci.net/17/1/2017/ doi:10.5194/nhess-17-1-2017
© Author(s) 2017. CC Attribution 3.0 License.
City-scale accessibility of emergency responders operating
during flood events
Daniel Green1, Dapeng Yu1, Ian Pattison2, Robert Wilby1, Lee Bosher2, Ramila Patel3, Philip Thompson3, Keith Trowell4, Julia Draycon5, Martin Halse3, Lili Yang6, and Tim Ryley7
1Department of Geography, Loughborough University, Loughborough, LE11 3TU, UK
2School of Civil & Building Engineering, Loughborough University, Loughborough, LE11 3TU, UK 3Leicester City Council, City Hall, Leicester, LE1 1FZ, UK
4Leicestershire Fire and Rescue Service Headquarters, 12 Geoff Monk Way, Leicester, LE4 3BU, UK 5Resilience Partnership, Meridian Business Park, Leicester, LE19 1YG, UK
6School of Business & Economics, Loughborough University, Loughborough, LE11 3TU, UK 7School of Natural Sciences, Nathan Campus, Griffith University, QLD 4111, Australia
Correspondence to:Daniel Green ([email protected])
Received: 23 September 2016 – Published in Nat. Hazards Earth Syst. Sci. Discuss.: 28 September 2016 Revised: 28 November 2016 – Accepted: 28 November 2016 – Published: 3 January 2017
Abstract. Emergency responders often have to operate and respond to emergency situations during dynamic weather conditions, including floods. This paper demonstrates a novel method using existing tools and datasets to evaluate emer-gency responder accessibility during flood events within the city of Leicester, UK. Accessibility was quantified using the 8 and 10 min legislative targets for emergency provision for the ambulance and fire and rescue services respectively un-der “normal” no-flood conditions, as well as flood scenar-ios of various magnitudes (1 in 20-year, 1 in 100-year and 1 in 1000-year recurrence intervals), with both surface wa-ter and fluvial flood conditions considered. Flood restrictions were processed based on previous hydrodynamic inundation modelling undertaken and inputted into a Network Analysis framework as restrictions for surface water and fluvial flood events. Surface water flooding was shown to cause more dis-ruption to emergency responders operating within the city due to its widespread and spatially distributed footprint when compared to fluvial flood events of comparable magnitude. Fire and rescue 10 min accessibility was shown to decrease from 100, 66.5, 39.8 and 26.2 % under the no-flood, 1 in 20-year, 1 in 100-year and 1 in 1000-year surface water flood scenarios respectively. Furthermore, total inaccessibility was shown to increase with flood magnitude from 6.0 % under the 1 in 20-year scenario to 31.0 % under the 1 in 100-year flood scenario. Additionally, the evolution of emergency service
accessibility throughout a surface water flood event is out-lined, demonstrating the rapid impact on emergency service accessibility within the first 15 min of the surface water flood event, with a reduction in service coverage and overlap being observed for the ambulance service during a 1 in 100-year flood event. The study provides evidence to guide strategic planning for decision makers prior to and during emergency response to flood events at the city scale. It also provides a readily transferable method for exploring the impacts of nat-ural hazards or disruptions in other cities or regions based on historic, scenario-based events or real-time forecasting, if such data are available.
1 Introduction
considerable work has focused on understanding the UK’s direct flood risk, flooding often has associated indirect or cas-cading impacts that extend beyond the area experiencing in-undation. Indirect impacts relate to a series of interconnected or related infrastructural failures that are initiated by a nat-ural hazard or disturbance such as a flood event (Pescaroli and Alexander, 2015). Critical infrastructure, such as util-ity services, hospitals, emergency service locations (police, ambulance, and fire and rescue stations), and the transporta-tion networks that connect these services are also susceptible to flooding (Douglas et al., 2010; Stålhult and Andersson, 2014). Therefore, inundation may result in spatially diffuse consequences that are often difficult to measure and are per-ceived as less important when compared to direct flood im-pacts (Penning-Rowsell and Parker, 1987; Arkell and Darch, 2006). For example, a flooded electricity substation may re-sult in thousands of properties outside of the flooded area losing power. Also, flooded transport infrastructure may af-fect the transit of vehicles across the network (Gil and Stein-bach, 2008; Lhomme et al., 2013; Yin et al., 2016), which is of particular importance to the emergency services (e.g. fire and rescue, ambulance, police) that may be required to respond to emergency calls during flood events.
According to the UK Government’s Civil Contingencies Act (2004), responders operating within a Multi-Agency Flood Plan (MAFP) are divided into two categories with separate duties during emergency scenarios. Category 1 re-sponders, including emergency services, lead local authori-ties (LLAs) and the Environment Agency are at the core of a response, while Category 2 organisations, such as utility and transport services, act as co-operating responders to as-sist and share information during flood emergencies. In Eng-land and Wales, Category 1 and 2 responders act individually or collectively through 42 local resilience forums to respond to major emergency situations, including those related to se-vere flooding (Defra, 2014).
Working in a common framework, local responders are required to make their own decisions about what planning arrangements are appropriate considering the local circum-stances and priorities. For flood-related incidents, a MAFP is required by the Civil Contingencies Act (2004) to out-line a framework for planning, response and recovery. The successful implementation of a MAFP requires the key op-erational and stakeholder organisations (e.g. fire and rescue service, ambulance service, city council and police) to pro-vide efficient and functional services during flood conditions collectively. To a large extent, this depends on the contin-ued functioning of critical infrastructure nodes and networks pertinent to flood emergency planning and response, includ-ing vital services such as fire and rescue stations, hospitals, telecommunication networks and the transit network (Lum-broso et al., 2008; Dawson et al., 2011; Lum(Lum-broso and Vinet, 2012; Wilby and Keenan, 2012; Bosher, 2014). Currently, de-cision making during flood events and knowledge of flood-prone areas is informed by planning exercises coordinated
by emergency responder organisations, local understanding and past experience of areas prone to flooding, as well as identification of flood hotspot areas based on flood modelling studies (see Sect. 2.1). However, these approaches only show the locations of direct flood risk and cannot be used to un-derstand the indirect impacts of flooding on emergency re-sponder operation and accessibility. An applied understand-ing of the spatio-temporal impacts of flood events on emer-gency responder accessibility may enhance existing contin-gency planning frameworks by providing foresight into the potential bottleneck locations across the city, which may ul-timately increase emergency responder resilience and pre-paredness during flood events.
Emergency responders in the UK are required by legisla-tion to conform to strict time frames in which they must re-spond to incidents. For example, ambulance and fire and res-cue services are required to reach 75 % of “Red 1” incidents in less than 8 and 10 min respectively from when the initial report was logged. These include incidents that may elicit high-priority blue-light responses such as cardiac arrest, life-threatening and/or traumatic injury, road traffic collisions, and individuals trapped in floodwaters. However, these re-sponse targets might be unachievable under certain flood sit-uations that limit the ability of emergency responders to nav-igate a disrupted road network (Albano et al., 2014).
Gil and Steinbach (2008) evaluated the indirect impact of flooding on an urban street network, demonstrating the consequences of localised and larger-scale spatial accessi-bility during disruptive events. Findings suggested that, al-though the effects of a specific flood event may be concen-trated or isolated in one location, other areas may still be affected. An urban transport network may be able to cope with small changes of state (i.e. minor flood events where depths are low and spatial extent is limited). However, more severe flooding may result in the transport network reaching a “tipping point” where network routing is considerably im-pacted (Sakakibaral et al., 2004; Dawson et al., 2011; Albano et al., 2014). According to Gil and Steinbach (2008), loca-tions during floods may become (i) “islands”, completely cut off with no access; (ii) “peninsulas”, with a single critical access route; (iii) “peripheral areas” that are more difficult to access or (iv) “refugial areas”, which are still accessible and play an important role for coordinating and managing response efforts. These indirect, cascading impacts may be more detrimental to the functioning of a city than the imme-diate, directly apparent impacts and may result in substantial difficulties for road users, including Category 1 emergency responders, to navigate during flood events.
respon-ders, namely the Leicestershire Fire and Rescue Service and the East Midlands Ambulance Service.
2 Methodology 2.1 Case study area
Leicestershire, including the city of Leicester, UK, has expe-rienced a history of localised flooding (Shackley et al., 2001) with council records indicating that annual fluvial flood dam-ages amounted to ∼GBP 90 000 between 2000 and 2010 (Climate East Midlands, 2012). In addition, surface water flooding also poses serious problems to the city of Leices-ter, with Leicester being ranked 16th out of 4215 settlements assessed within England in terms of surface water flood risk (Defra, 2009). The Environment Agency also estimates that approximately 36 900 properties in Leicester’s principle ur-ban area occupy flood-prone areas (Leicester City Council, 2012).
Anecdotal information is available on historic flood events within Leicester although details on specific flood mecha-nisms, severity and areal extent are largely absent. Based on the total number of historic incidents collated by Leicester City Council, the flood events that occurred in July 1968 and June 1993 appear to be the most severe historical events, with reports indicating that the July 1968 flood event affected up to 1800 properties and 28 factories within the city (Leicester City Council, 2011). More recently (June 2012), Leicester experienced severe surface water flooding following a short, intense period of precipitation where∼30 mm of rainfall fell in 20 min, overwhelming the city’s drainage and resulting in widespread flooding across the city.
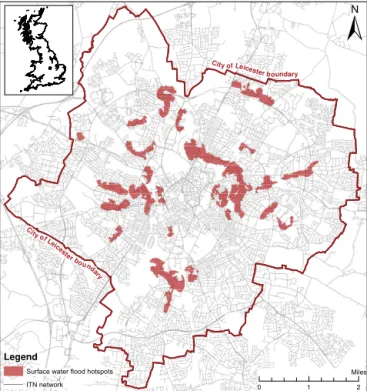
Since the Flood & Water Management Act (2010), Leices-ter City Council has completed a number of flood risk stud-ies, including a Preliminary Flood Risk Assessment (2011), Flood Risk & Hazard Mapping Report (2013) and Local Flood Risk Management Plan (2015). These studies iden-tified 26 surface water flood hotspots, including the main hospital, Leicester Royal Infirmary, as well as a number of densely populated, low-income areas of the city (Fig. 1) and have been important in informing flood planning and insti-gating flood management efforts within the city. However, research has focused largely on the direct impacts of flood-ing in the city and has not studied the indirect impacts of flooding, for example, on emergency response and accessi-bility.
2.2 Data collation
2.2.1 Road network and critical infrastructure
Leicester’s transport network was represented using Ord-nance Survey Integrated Transport Network (ITN) data, which, in addition to including detailed road network ge-ometry and routing information, include metadata that
out-C ity
of Leic
este
r b o unda
ry
City of Leic ester boundary
±
Legend
ITN network 0 1 2
Miles Surface water flood hotspots
o
Figure 1.Distribution of the 26 locations identified as surface water hotspots in Leicester, UK.
lines standard road restrictions that may inhibit or delay the traversing of a vehicle across a specific section of road. The same ITN data are also used in emergency responder con-trol centres and within emergency vehicles to aid navigation to incidents (Ordnance Survey, 2008). Restrictions contained within the ITN included height and weight limits, speed strictions based on national speed limits, mandatory turn re-strictions (i.e. no right turns) and one-way roads. Although it is likely that congestion and human behavioural changes may affect the routing of emergency vehicles during flood events, the network analysis undertaken did not consider congestion or the impact of traffic. Although congestion data could be implemented into the modelling framework based on historic traffic data (Winn, 2014; Cho and Yoon, 2015), which were available for the city of Leicester from Leicestershire County Council, congestion data were not used due to uncertainties associated with how human behaviour and patterns of con-gestion may differ under flood conditions when compared to normal conditions on which the traffic data were based. Fur-thermore, emergency vehicles are able to bypass the majority of congestion when responding to incidents that elicit a blue-light response. Still, because congestion data were not im-plemented in the modelling conducted, the results presented demonstrate a “best-case” scenario, ignoring potential delays associated with other road users.
ambulance stations, and fire and rescue stations. Six fire and rescue stations (Birstall, Western, Southern, Central, East-ern and Wigston) and five ambulance and hospital locations (Goodwood Ambulance Station, Leicester Royal Infirmary, Gorse Hill Ambulance Station, Narborough Ambulance Sta-tion and Leicester General Hospital) were identified as points of origin for modelling emergency response zones.
2.2.2 Flooding scenarios
The impact of surface water and fluvial flooding on Leices-ter’s emergency response times for ambulance and fire and rescue were both considered. Existing surface water and flu-vial inundation datasets associated with flooding of various magnitudes were obtained directly from the Leicester City Council and Environment Agency respectively. Fluvial and surface water flood events with return periods of 1 in 20, 100 and 1000 years were assessed.
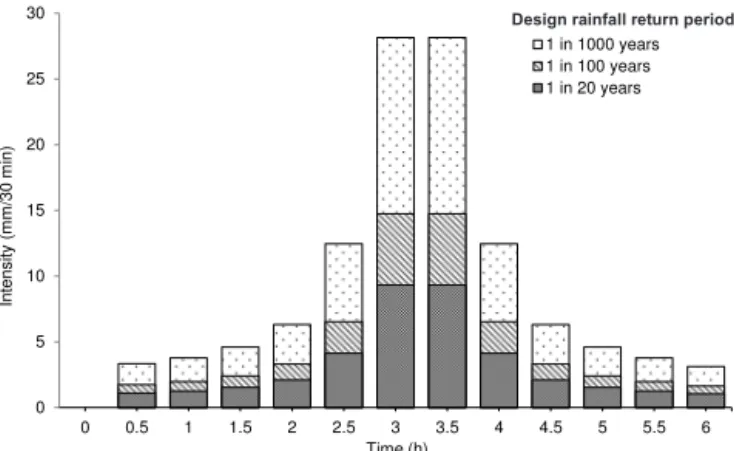
High-resolution (1 m horizontal, ±0.25 m vertical), city-wide surface water inundation depth data derived from a hydrodynamic inundation model (TUFLOW), conducted as part of Leicester’s Surface Water Management Plan (2012), were obtained from the Leicester City Council. This resource allowed the extraction of spatially referenced flood depth data at multiple points in time throughout the flood event. The modelling involved applying spatially uniform precipi-tation associated with specified return periods, namely 1 in 20, 1 in 100 and 1 in 1000 years, calculated for design storm hyetographs of 6 h duration (Fig. 2). Distributed roughness values classified according to Ordnance Survey MasterMap© land uses (e.g. 0.02 for roads, 0.03 for buildings, 0.04 for gardens and/or vegetation) were applied in the modelling process. The modelling included a uniform drainage rate of 12 mm h−1 to account for drainage and/or infiltration to natural, permeable surfaces and artificial drainage systems such as sewers and manholes, as recommended by the En-vironment Agency (2012). Further information on the sur-face water inundation modelling used in this study can be found in Leicester City Council’s Surface Water Manage-ment Plan (2012).
Fluvial inundation data for the River Soar and associated tributaries within Leicester were obtained from the Environ-ment Agency. As flood depths were not available for fluvial flooding, flood hazard data were used to derive flood restric-tions. Flood hazard is a function of flood depth (m), velocity (m s−1) and potential for entrainment of debris within
flood-waters (HR Wallingford, 2006), all factors that could inhibit vehicle passage. The spatially distributed flood hazard data were classified into four categories based on the flood hazard rating calculated using the FD23211 guidance document pro-posed by HR Wallingford (2006): (i) low – shallow flowing water or deep, standing water, (ii) moderate – dangerous for some with deep, fast-flowing water, (iii) significant – danger-ous for most with deep, fast-flowing water and (iv) extreme – deep, fast-flowing water that is dangerous to all.
0 5 10 15 20 25 30
0 0.5 1 1.5 2 2.5 3 3.5 4 4.5 5 5.5 6
Int
en
s
ity
(
m
m
/30
m
in)
Time (h)
1 in 1000 years 1 in 100 years 1 in 20 years Design rainfall return period
Figure 2.Design rainfall scenarios for the 1 in 20-, 1 in 100- and 1 in 1000-year surface water flood modelling conducted by the Le-icester City Council.
2.3 Methods
2.3.1 Network restrictions
First, flood restrictions were defined using the data detailed in the previous section. A study by the Automobile Associ-ation (2014) recommended that regular motorists (i.e. small or medium cars) should avoid driving through floodwaters
≥15 cm depth as this may be sufficient to stall a car or result in loss of control, while water depths exceeding 30 cm may be sufficient to move vehicles. Additionally, depths≥15 cm may conceal submerged hazards (e.g. overflowing drains or large debris), which could prevent vehicles from success-fully traversing floodwaters. Despite this, emergency vehi-cles have a greater tolerance for travelling through floodwa-ters than standard vehicles.
Semi-structured interviews conducted with Leicestershire Fire and Rescue Service revealed that water depths of ap-proximately 25 cm (lower than the wheel arch of the vehicle) may be traversed during an emergency situation due to the size, weight and power of emergency vehicles – a fire ap-pliance weighs approximately 12 T and drivers are trained to traverse through floodwaters. This threshold depth value is also consistent with previous research (HR Wallingford, 2006; Dawson et al., 2011; Pregnolato et al., 2016). Although high velocities may hinder emergency responders from suc-cessfully traversing floodwaters, modelled flow velocities were typically < 1 m s−1due to ponding in topographic
hol-lows. Therefore, depth was selected as the principal factor when evaluating the sites of network restrictions. Hence, a threshold water depth of 25 cm was set for the surface water flood scenarios, with water depths≥25 cm being treated as restrictions to emergency vehicle flow along a specific road section.
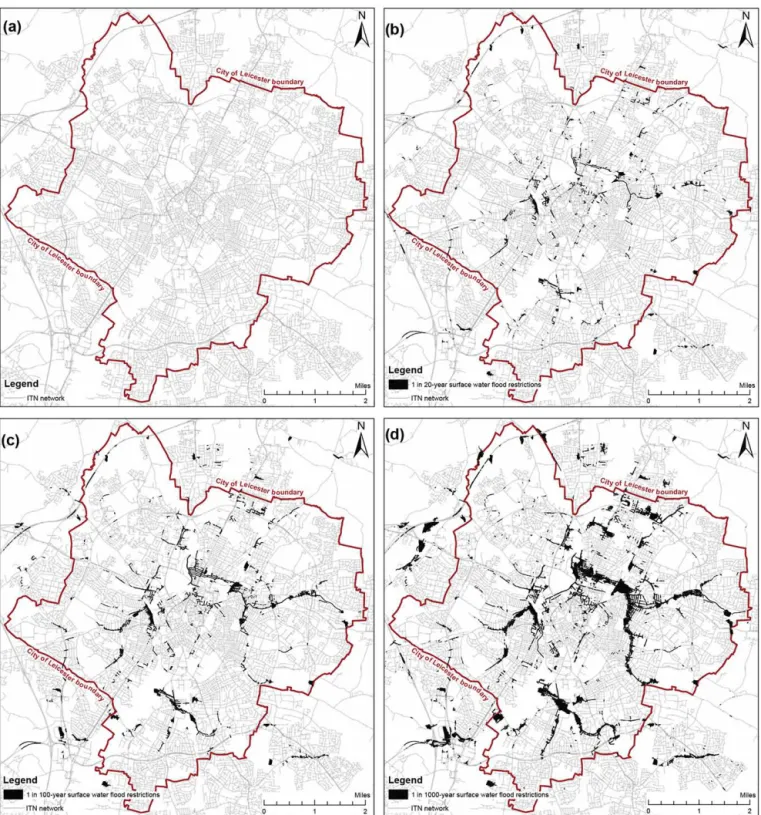
Figure 3.ITN network under(a)normal no-flood conditions and overlain with restrictions under(b)1 in 20-year,(c)1 in 100-year and(d)1 in 1000-year surface water flood scenarios showing the extent of flooding above a 25 cm threshold that intersects the ITN network.
areas that would not affect network routing since their extent did not extend to the road network). Additionally, network restrictions were manually inspected to ensure realistic emer-gency response zone calculation. Processing included the re-moval of obstructions due to (i) isolated pixels of inunda-tion less than 10 m2in area that would likely be traversable
to treat as restrictions prior to inspection but only 10 557 af-terwards. Figure 3 illustrates the no-flood restriction trans-port network as well as the transtrans-port network with overlain surface water flood depths greater than 25 cm under the three flood magnitude scenarios: 1 in 20 years, 1 in 100 years and 1 in 1000 years.
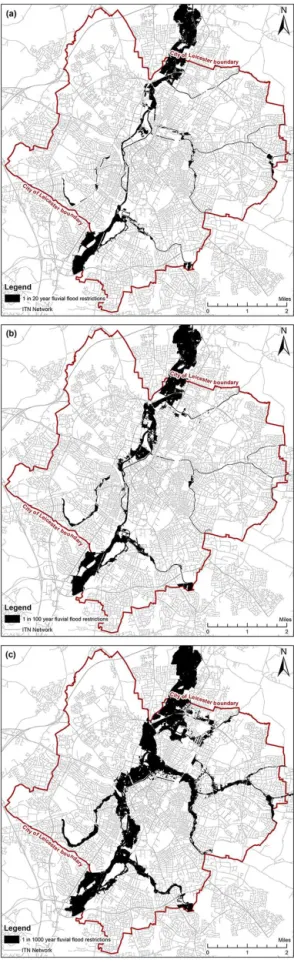
To create fluvial inundation restrictions, all fluvial flood hazard categories with the exception of the “low” flood haz-ard category were treated as barriers and restrictions in all return period scenarios. Low flood hazard polygons were re-moved as restrictions because it was reasonable to assume that emergency vehicles would be able to traverse floodwa-ters in this category (Sect. 2.2.2). Category 1 responders sug-gested that emergency vehicles could have some issues pass-ing through floodwaters in the “moderate” flood hazard cat-egories and above, especially due to the possibility of sub-merged obstacles. Therefore, flood hazard ratings of moder-ate and above were tremoder-ated as restrictions within the mod-elling. Figure 4 highlights the flood hazard data used to cre-ate restrictions for fluvial inundation under the 1 in 20-, 1 in 100- and 1 in 1000-year flood scenarios.
2.3.2 Network routing
To quantify accessibility and evaluate service coverage, quickest routing (based on time taken to travel between two points when traversing the Integrated Transport Network), as opposed to shortest-path routing (based on the distance be-tween two points), was selected since this algorithm consid-ers road restrictions and impedances. Quickest routing be-tween facility and destination was based on Dijkstra’s (1959) shortest-path algorithm with network routing weighted by travel time rather than distance, allowing the inclusion of travel impedances and restrictions. Quickest routing was ap-plied because the shortest route by distance may not nec-essarily be the quickest traversable route because a shorter path may be more weighted due to a restriction. For ex-ample, a length of arterial road with a lower UK standard speed restriction of 20 mph (32.2 km h−1) may be traversed
more quickly than a longer route such as a motorway with a UK standard speed restriction of 70 mph (112.7 km h−1).
Routing based on Dijkstra’s algorithm was chosen due to the algorithm being a computationally efficient and widely accepted method of solving vehicle routing problems and conducting network analyses (Sniedovich, 2010). Further-more, the method was easily interfaced with the GIS frame-work, allowing the implementation of weighted restrictions and impedance data contained within the ITN metadata the network analyses conducted.
All network analyses took into account ITN road restric-tion and impedances specifically for emergency vehicles, as defined by the UK government’s Traffic Signs Regulations and General Directions Act (2002). Vehicle qualifier infor-mation, metadata imbedded within the ITN dataset, which indicates whether a restriction or impedance applied to a
specific vehicle depending on its use, load and type (e.g. taxi, bus, wide-load heavy goods vehicle, emergency vehi-cles, hazardous or dangerous loads), was set to “emergency vehicles” to reflect the motoring regulations that emergency vehicles are exempt from during blue-light response.
Basic origin of destination “A-to-B” routing between two points and response zone calculation was undertaken for key fire and rescue and ambulance nodes identified using the Na-tional Receptors Database. To calculate A-to-B routing, an origin node (A) was identified (i.e. fire and rescue station) and a destination node (B) was highlighted where an emer-gency vehicle may have to attend, i.e. an evacuation centre where affected persons would be gathered in the event of an emergency. Quickest routing between both points was then calculated to give a journey duration under normal no-flood conditions. Flood restrictions were then overlain over these routes and routing was recalculated to understand the specific impact of flooding on an origin-to-destination routing.
Next, to calculate polygon response zones of emergency responders, relevant nodes (i.e. fire and rescue stations, am-bulance stations and hospitals) identified from the National Receptors Dataset were treated as “facilities” within an Ar-cGIS Network Analyst framework. Using these facilities as starting points for vehicle routing, polygon response zones highlighting all road network locations lying within a 10 min (fire and rescue) or 8 min (ambulance) radius were calculated for each individual station, based on legislated response time frames for “Red 1” high-priority incidents. Individual sta-tion service polygon areas were then combined and overlain to visualise and evaluate the zonal emergency service cover-age for the whole city under unimpeded no-flood conditions. Flood restriction data for surface water and fluvial flood sce-narios could then be input into Network Analyst and the re-sponse polygons could be recalculated for different magni-tude surface water and fluvial flood scenarios to understand the impact of flooding on emergency response.
3 Results and discussion 3.1 Origin–destination routing
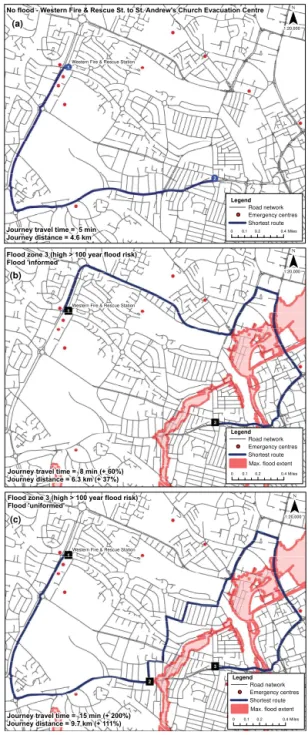
Using a simple origin-to-destination routing, a route be-tween the Western Fire and Rescue Station and St. Andrew’s Methodist Church, an evacuation centre within a close prox-imity to the Western Fire and Rescue Station, was calcu-lated. Figure 5a highlights the modelled quickest route under normal conditions when no flood restrictions were present, demonstrating that fire and rescue services responding from the Western station would be able to reach the destination within a 5 min time frame, travelling a distance of 4.6 km (2.86 miles). However, when flood restrictions derived from a 1 in 100-year fluvial flood event were integrated into the model, journey travel times were shown to increase to 8 min (+60 %; Fig. 5b) under a “flood-informed” scenario, where
Western Fire & Rescue Station
Flood zone 3 (high > 100 year flood risk)
Flood 'uniformed'
¯
1:20,000
Journey travel time = 15 min (+ 200%) Journey distance = 9.7 km (+ 111%)
Legend
0 0.1 0.2 0.4Miles Emergency centres Road network
Max. flood extent Shortest route Western Fire & Rescue Station
No flood - Western Fire & Rescue St. to St. Andrew's Church Evacuation Centre
¯
1:20,000
Legend
0 0.1 0.2 0.4Miles Emergency centres Road network
Shortest route
Western Fire & Rescue Station
Legend
0 0.1 0.2 0.4Miles Emergency centres Road network
Max. flood extent Shortest route Flood zone 3 (high > 100 year flood risk)
Flood 'informed'
Journey travel time = 8 min (+ 60%) Journey distance = 6.3 km (+ 37%) Journey travel time = 5 min Journey distance = 4.6 km
(a)
(b)
(c)
¯
1:20,000
Figure 5. Quickest routing between the Western Fire and Res-cue Station and St. Andrew’s Methodist Church (evacuation cen-tre, 300-person capacity) under (a) normal conditions and high (> 100 year) fluvial flood risk scenarios.(b) A prepared and “in-formed” scenario where first responders are aware of network re-strictions before responding, whereas(c)shows a “uniformed” sce-nario where impassable floodwaters are encountered by responders en route.
demon-Glenfield Hospital Gorse Hill Hospital
Nuffield Private Hospital
Leicester Royal Infirmary
Leicester General Hospital Fire & Rescue HQ
Wigston Fire & Rescue Station Western Fire & Rescue Station
Eastern Fire & Rescue Station
Central Fire & Rescue Station
Southern Fire & Rescue Station
Birstall Fire & Rescue Station 1 1 2 2 3 3 4 4 5 5 6 6 7 7 I I H H G G F F E E D D C C B B A A
±
0 0.5 1 2MilesPLQUHVSRQVH]RQHVILUHDQGUHVFXHVWDWLRQV
(no-flood scenario)
Emergency Fentres Emergency Vervices &
Yulnerable Oocations
Type 1
Type 2 "
) Ambulance
¬ Fire Vtations
G
) Hospitals
Police Vtations
× Nursing Komes
Type 3
Type 4
1 in 100 Pluvial Restrictions†
City ofLe
ice ster
boundary
City ofLeices ter bo undary
C
ityo f L
e
ices
terb
oun
d
a
ry
C ity
of Leice
ste r boun
dary
City of Leicester b
o
u
n
d
ary
Cityof
L eicest
erbo
u n d a ry ) L o ca ti o n o f s tat io n us ed t o ca lc ul a te r e sp on se t im e s
8 min response zones for all
fire and rescue stations
operating within Leicester
Birstall Fire & Rescue Station Western Fire & Rescue Station Southern Fire & Rescue Station Central Fire & Rescue Station Eastern Fire & Rescue Station Wigston Fire & Rescue Station Road Qetwork
Watercourses
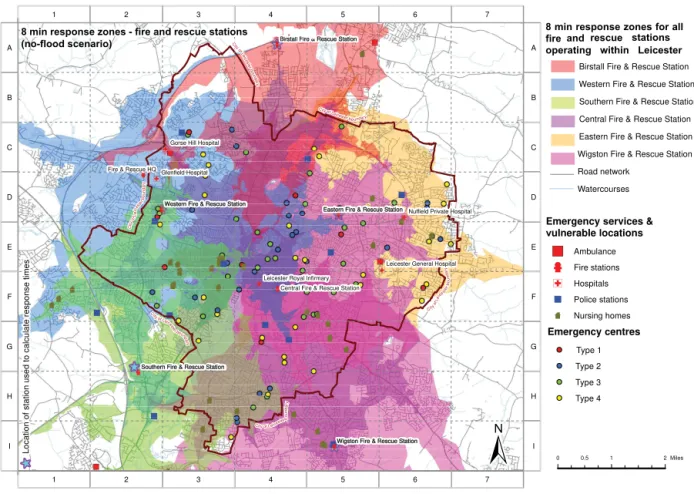
Figure 6.City accessibility (within 10 min) for fire and rescue service stations under normal no-flood conditions.
strates the impact that flood events may have upon origin-to-destination routing for emergency responders, as legislated response times may be unachievable under potential flood situations, which may limit the efficiency of emergency re-sponders traversing a disrupted road network, resulting in af-fected individuals being at greater risk (Arkell and Darch, 2006). Furthermore, the importance of preparedness is crit-ical because emergency responders may be able to respond more rapidly if up-to-date information on the extent of flood-related network restrictions is available.
3.1.1 Zonal response: no-flood conditions
The network analysis undertaken suggests that Leicestershire Fire and Rescue Service (LFRS) would be able to reach 100 % of the city road network within 10 min when operat-ing under normal conditions (i.e. no floodoperat-ing or disruptions present), meeting the 10 min legislative time frame (Fig. 6). Furthermore, significant areas of the city are shown to be within a 10 min response zone from one or more fire and rescue stations as there are numerous areas across the city where overlap in station coverage exists. This indicates that the fire and rescue stations are strategically placed to max-imise station coverage, and some contingency overlap exists
when operating under optimal conditions to ensure resilient operation.
) ) ) ) ) Glenfield Hospital
Gorse Hill Hospital
Nuffield Private Hospital
Leicester Royal Infirmary
Leicester General Hospital
Wigston Fire & Rescue Station Western Fire & Rescue Station
Eastern Fire & Rescue Station
Central Fire & Rescue Station
Southern Fire & Rescue Station
Birstall Fire & Rescue Station 1 1 2 2 3 3 4 4 5 5 6 6 7 7 I I H H G G F F E E D D C C B B A A
±
0 0.5 1 2MilesCombined ambulance response zones (no-flood scenario)
Emergency centres
Emergency services &
vulnerable locations
Type 1
Type 2 "
) Ambulance
¬ Fire stations
G
) Hospitals
Police stations
× Nursing homes
Type 3
Type 4
1 in 1,000 Pluvial Restrictions(
City ofLe
ice sterboundary
City o f Leicester
bo undary
C
ityo
f L
e
ices
terb
oun
d
a
ry
C ityof Le
ice
ste r boun
dary
City of Leicester b
o
u
n
d
ary
Cityof Le
ice ste
rb o u n d a ry ) L o c a ti o n o f s ta ti o n u s e d t o c a lc u la te r e s p o n s e t im e s In a c ti v e , fl o o d e d s ta ti o n s
8 min response zones for all ambulance stations operating within Leicester
Goodwood Ambulance Station
Leicester Royal Infirmary
Gorse Hill Ambulance Station
Narborough Ambulance Station
Leicester General Hospital Road network Watercourses
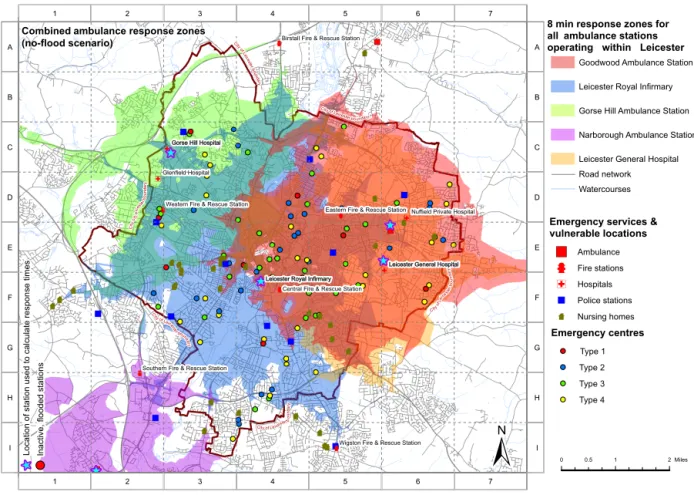
Figure 7.Accessibility of the city (8 min) for ambulance service stations operating under normal no-flood conditions.
Table 1.Percentage of area accessible to fire and rescue and ambulance service stations under normal and flood scenarios.
Flood scenarios Fire and rescue service Ambulance service
Accessible in 10 min Inaccessible Accessible in 8 min Inaccessible
No flood 100 % 0 % 88.9 % 0 %
1 in 20-year SW 66.5 % 6.0 % 50.7 % 2.6 %
1 in 100-year SW 39.8 % 12.7 % 39.8 % 12.5 %
1 in 1000-year SW 26.2 % 31.0 % 26.8 % 30.9 %
1 in 20-year Flv 97.6 % 1.9 % 84.1 % 3.5 %
1 in 100-year Flv 96.2 % 1.9 % 82.9 % 3.5 %
1 in 1000-year Flv 74.3 % 13.8 % 56.0 % 13.1 %
NB “SW” is surface water flooding scenarios; “Flv” is fluvial flooding scenarios.
3.1.2 Impact of surface water flooding Fire and rescue service
When restrictions derived from the 20-year surface water flood scenario were incorporated into the model, the fire and rescue service was shown to experience a 34 % reduction in service coverage, resulting in 66 % of the road network being accessible in 10 min or less (Table 1; Fig. 8a). This reduction in service coverage appears to be due to difficulties in
re-Figure 8.City-scale accessibility (within a 10 min time frame) for fire and rescue service stations:(a)1 in 20-year,(b)1 in 100-year and(c)1 in 1000-year surface water flooding scenarios. New Parks Lane, referred to in the text, is highlighted in the rectangle in Fig. 8a. See Fig. 6 for key.
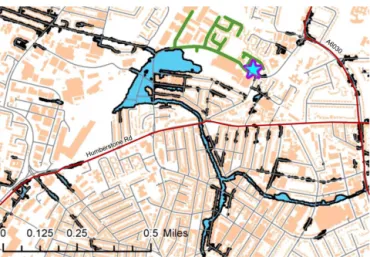
Figure 9.The Eastern Fire and Rescue Station during a 1 in 100-year flood event shows the surrounding roads experiencing inunda-tion, predominantly surrounding Willow Brook (centre). The green line indicates the accessible road network without mitigation mea-sures. Floodwaters surrounding Willow Brook were removed at the Humberstone Road intercept because a large bridge passed over the brook. Floodwaters blocking access to the A6030 were also re-moved since these would likely be pumped.
sulting in a reduction in service coverage (Fig. 10a). Addi-tionally, ITN blockages along primary access roads, includ-ing New Parks Way (A563) by Hinkley Road roundabout and the A47, result in the Western and Central Fire and Rescue stations becoming unable to access areas located within the south-west of the city. Moreover, 6 % of the city area was predicted to be completely inaccessible or “islanded”, either due to floodwater occupying the road network directly or due to zones of the city being isolated and surrounded entirely by floodwaters.
Under a 1 in 100-year surface water flood scenario, the modelling suggested that 40 % of the city would be accessi-ble within 10 min and 13 % of the city would be completely
Figure 10.The Southern Fire and Rescue Station during a 1 in 100-year flood event shows that the station is directly at risk of flooding and if sufficient mitigation measures are not taken during a flood of similar or greater magnitude, functioning of the station could be compromised.
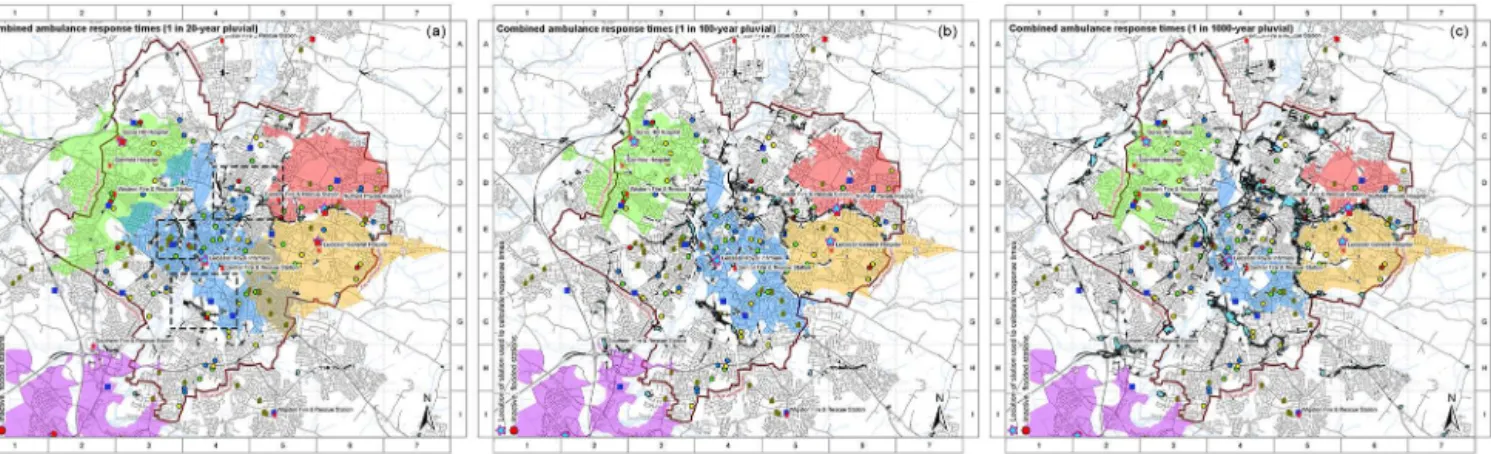
sta-Figure 11.City-scale accessibility (within an 8 min time frame) for ambulance service stations under(a)1 in 20-year,(b)1 in 100-year and (c)1 in 1000-year surface water flooding scenarios. The key access roads referred to in the text are highlighted in the rectangles in Fig. 11a. Refer to Fig. 7 for key.
tions could be rendered inoperable under a 1 in 100-year sur-face water flood event if sufficient mitigation measures were not conducted.
Under the most extreme 1000-year surface water flood scenario, the model predicted that almost three-quarters of the city would be inaccessible to the fire and rescue service within a 10 min time frame, with 26 % of the city being ac-cessible by the fire and rescue station in under 10 min (Ta-ble 1; Fig. 8c). Additionally, 31 % of the city was predicted to be completely inaccessible to the fire and rescue service us-ing the city’s road network. Therefore, other means of trans-port (e.g. foot, boat or helicopter) would be required to access large areas of the city. Moreover, under this extreme flood scenario, the Eastern and Southern Fire and Rescue stations would be fully compromised by floodwaters and would be re-quired to divert their operations and resources to alternative stations across the city.
The model also predicts that there would be no overlap in fire and rescue station coverage during a 1 in 1000-year surface water flood event and that many vulnerable parts of the city, including the main hospital (Leicester Royal Infir-mary), would be either directly inundated by floodwaters or inaccessible due to key access routes throughout the city ex-periencing network restrictions.
Ambulance service
When flood restrictions were introduced into the ambulance service response model, high-priority response coverage in 8 min or less was shown to decrease in relation to an increase in flood magnitude, similar to the fire and rescue service re-sponse. Over half of the city (51 %) was projected to be ac-cessible in 8 min or less under a 1 in 20-year surface water flood scenario, 40 % under a 1 in 100-year scenario and 27 % under a 1 in 1000-year scenario (Table 1; Fig. 11). Although the east of the city surrounding Leicester General Hospi-tal and Goodwood Ambulance Station appears to maintain
much of its accessibility, areas to the north and south of the city become inaccessible during a 1 in 20-year flood event due to flood restrictions causing a bottleneck and restricting transit on a number of primary access roads throughout the city, including Melton Road (A607), Aylestone Road (A426), Welford Road (A5199) and Hinkley Road (A47).
Furthermore, areas of absolute inaccessibility were also shown to correlate with flood magnitude. Under a no-flood scenario, the entire city was accessible by road, while 2.6, 12.5 and 30.9 % of the city was shown to be inaccessible by the ambulance service under 1 in 20-, 1 in 100- and 1 in 1000-year surface water flood scenarios respectively (Table 1).
3.2 Impact of fluvial flooding
D E F
10 min response zones - Fire & rescue service (1 in 20-year fluvial) 10 min response zones - Fire & rescue service (1 in 100-year fluvial) 10 min response zones - Fire & rescue service (1 in 1000-year fluvial)
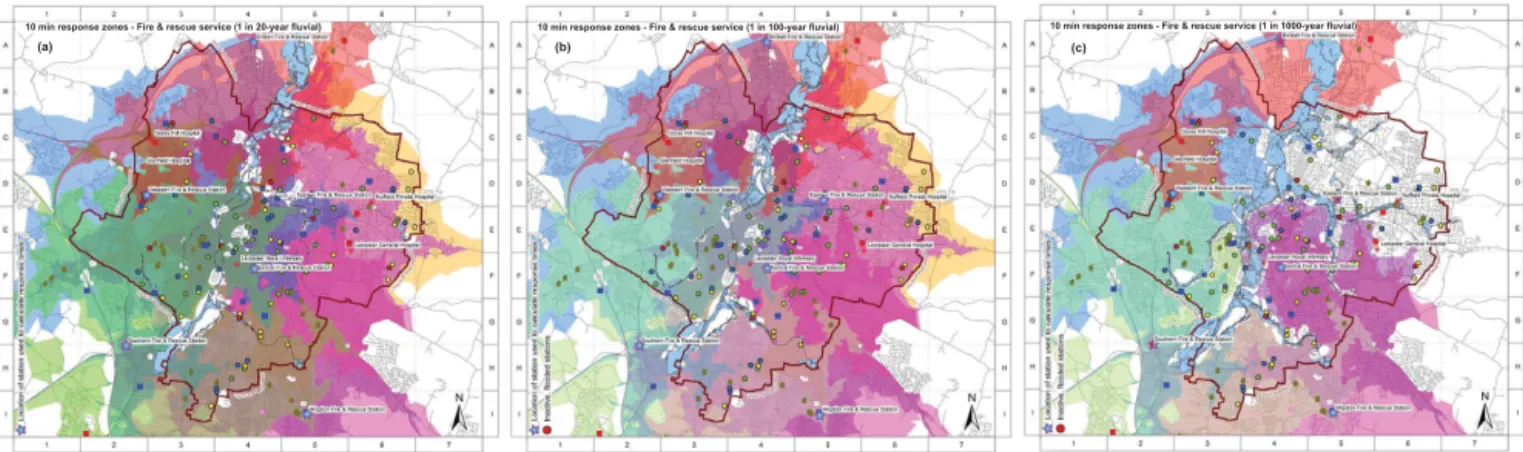
Figure 12.City-scale accessibility (within a 10 min time frame) for fire and rescue service stations under(a)1 in 20-year,(b)1 in 100-year and(c)1 in 1000-year fluvial flooding scenarios. Refer to the key in Fig. 6.
(a) (b) (c)
Figure 13.City-scale accessibility (within an 8 min time frame) for ambulance service stations under(a)1 in 20-year,(b)1 in 100-year and(c)1 in 1000-year fluvial flooding scenarios. Key access roads referred to in the text are within grid reference E4 in(c).
across the city. However, the 1 in 1000-year (Fig. 12c) flu-vial flood scenario was shown to significantly impact emer-gency response and accessibility, with some stations becom-ing compromised by floodwaters. The fire and rescue service scenario suggested that the Eastern Fire and Rescue Station would be severely impacted by fluvial flooding from Willow Brook, resulting in the station only being able to respond to localised incidents, similar to the situation depicted in Fig. 9. Additionally, the ambulance service scenario suggested that Leicester Royal Infirmary would be inundated by floodwa-ters, rendering the hospital’s ambulance station inoperable, and large areas in the north, north-east, south and south-east of the city would become inaccessible within an 8 min re-sponse time (Fig. 13). Furthermore, the 1 in 1000-year fluvial flood scenarios show a partitioning of the city into two sep-arately functioning entities divided into east and west along the River Soar, where emergency resources would be unable
to be exchanged by road because of key access roads cross-ing the River Soar (e.g. the A-roads surroundcross-ing Frog Island are the A47, A50, A6) becoming blocked with floodwaters. 3.3 Temporal evolution of accessibility through a
surface water flood event
(a) (b) (c)
(d) (e) (f)
(g) (h) (i)
Combined ambulance respon
Figure 14.Combined ambulance service response zones during a 1 in 100-year surface water flood event.(a)No-flood conditions prior to the flood event,(b)0.25 h,(c)1.0 h,(d)2.0 h,(e)3.0 h,(f)4.0 h,(g)5.0 h,(h)6.0 h, at the end of the rainfall event and(i)static maximum flood depths recorded during the event. Refer to key in Fig. 7. Please see the Supplement for an animated version of Fig. 14.
To further understand the temporal evolution of accessibil-ity during a surface water flood event, the ambulance service 8 min response during a 1 in 100-year flood event was exam-ined. Surface water flood depths were extracted at multiple points in time throughout the flood event (namely 0, 0.25, 1, 2, 3, 4, 5, 6 h and the maximum flood depths that were recorded during the design rainfall event; Fig. 2). Next, sur-face water flood depths were processed into flood restrictions and inputted into the ambulance service response model. Fig-ure 14 shows the temporal evolution of ambulance 8 min
re-sponse zones throughout a 1 in 100-year surface water flood event.
on during the flood event. Notably, the model predicts that inundation extent over the depth threshold value increases (>25 cm) dramatically between 1 and 2 h, affecting many of
the primary access routes around the city and causing ambu-lance accessibility and service coverage overlap to decrease considerably. Because surface water flood events are often unpredictable and have short lead times, this highlights the requirement for emergency responders to be aware and pre-pared for rapid-onset flood events.
4 Conclusion
Under normal operating conditions, both emergency services considered were shown to reach the majority of the city (100 and 89 % for fire and rescue services and ambulance ser-vices respectively) within the legislated response times for Red 1 incidents (8 or 10 min), suggesting that the stations are strategically situated to provide efficient response dur-ing an emergency. In addition, there is sufficient overlap in the polygonal response zones of each emergency responder station, indicating a degree of resilience if one station was unable to respond due to being occupied with another emer-gency situation. However, when surface water and fluvial flood situations of different magnitudes are introduced into the model, wider ramifications of localised flooding on city-scale emergency response times become apparent. Specif-ically, surface water flood mechanisms are shown to exert significant disruption to emergency response due to floodwa-ters (i) being spatially distributed and widespread across the city; (ii) having areal extents and depths that are sufficient to cause restrictions to road users, even at lower magnitudes, and (iii) occupying many of the key access routes (i.e. pri-mary A-roads) and critical areas needed to traverse the city road network.
In contrast, the impacts of fluvial flooding on emergency response are limited, especially for lower-magnitude events. This is principally due to the spatially concentrated nature of the fluvial inundation footprint in the city, and the large channel capacity of the River Soar and its associated tribu-taries. The River Soar running through the city centre was en-gineered into a linear compound channel with a large channel capacity, meaning that high flood flows are conveyed rapidly and efficiently downstream and beyond the city boundaries. Bridges and overpasses built over watercourses in the city are generally higher than the bank full channel capacity, thus allowing the transport network surrounding the River Soar to continue to be operational under small to medium flood events. Under fluvial flood conditions, the key risk to emer-gency responders is the direct flooding of emeremer-gency respon-der locations, resulting in the stations becoming inoperable. This is apparent in the 1 in 1000-year flood scenario when the Goodwood Ambulance Station and the Eastern Fire and Res-cue Station become compromised by floodwaters (Figs. 12c and 13c).
Findings suggest that it is important to ensure that pri-mary access locations within the city road network, predom-inantly the higher-hierarchy roads (e.g. A-roads identified in the analyses above) are kept restriction free, and specific ef-fort should be focused on ensuring that these locations do not become blocked. Furthermore, the ambulance service should ensure that they are situated at strategic stand-by points dur-ing flood conditions to minimise the impact of a blocked road network on delaying emergency response to vulnerable loca-tions.
5 Data availability
The Ordnance Survey ITN dataset used to represent the trans-port network in the modelling framework and the base map-ping layers used in this study were downloaded through the Edina Digimap (2016) data repository (https://digimap. edina.ac.uk/os).
Flood restriction data inputted into the Network Analyst model can be obtained from the UK Government (2016) data repository (https://flood-warning-information.service. gov.uk/long-term-flood-risk/map?map=Reservoirs). High-resolution surface water flood outputs and associated files (e.g. input precipitation, distributed roughness data, national receptors database) can be requested for the city of Leices-ter (LeicesLeices-ter City Council, 2012) (http://www.leicesLeices-ter. gov.uk/media/178251/swmp-main-report.pdf), but similar UK-wide surface water maps are freely available from the the UK Government (2016) data repository.
The Supplement related to this article is available online at doi:10.5194/nhess-17-1-2017-supplement.
Competing interests. The authors declare that they have no conflict of interest.
Acknowledgements. This project was funded by the UK Natural Environment Research Council (NE/M008770/1) under its En-vironmental Risks to Infrastructure Innovation Programme. The authors would like to thank the strong support received from the project partners, Leicester, Leicestershire & Rutland Local Resilience Forum, the Leicester City Council, the Leicester Fire and Rescue Service, Environment Agency and the East Midlands Ambulance Service prior to and during the project, without which this project would not have been possible. In particular, we gratefully acknowledge the support from Martin Fletcher, Nira Sumaria and Chryse Tinsley from the Leicester City Council and Garry Mawby from the East Midlands Ambulance Service for their contribution to the research undertaken and to AECOM and the Environment Agency for producing the flood data used as inputs for the analyses conducted. We also thank the two reviewers for their constructive comments on the submitted manuscript.
Edited by: S. Fuchs
Reviewed by: S. Lhomme and one anonymous referee
References
Albano, R., Sole, A., Adamowski, J., and Mancusi, L.: A GIS-based model to estimate flood consequences and the degree of accessi-bility and operaaccessi-bility of strategic emergency response structures in urban areas, Nat. Hazards Earth Syst. Sci., 14, 2847–2865, doi:10.5194/nhess-14-2847-2014, 2014.
Arkell, B. and Darch, G.: Impact of Climate Change on London’s Transport Network, in: Proceedings of the Institute of Civil En-gineers, Municipal Engineer, 159, 231–237, 2006.
Automobile Association: Floods and Heavy Rain: Advice from the AA’s Flood Rescue Team, available at: http://www.theaa.com/ motoring_advice/seasonal/floods-and-wet-weather.html (last ac-cess: 13 December 2016), 2014.
Bosher, L. S.: Built-in Resilience’ through Disaster Risk Reduction: Operational Issues, Build. Res. Inf., 42, 240–254, 2014. Cho, J. and Yoon, Y.: A GIS-based Analysis on Vulnerability of
Ambulance Response Coverage to Traffic Condition: A Case Study of Seoul, 2015 IEEE 18th International Conference on Intelligent Transportation Systems, 1402–1407, 15–18 Septem-ber 2015.
Climate East Midlands: Adapting to Climate Change: Leicestershire County Council – case study, avail-able at: http://www.climate-em.org.uk/images/uploads/ CEM-Leicestershire-5-A4.pdf (last access: 13 December 2016), 2012.
Dawson, R. J., Peppe, R., and Wang, M.: An agent-based model for risk-based flood incident management, Nat. Hazards, 59, 167– 189, 2011.
Defra: National Rank Order of Settlements Susceptible to Sur-face Water Flooding, available at: http://archive.defra.gov. uk/environment/flooding/documents/manage/surfacewater/ sw-settlement-order.pdf (last access: 13 December 2016), 2009. Defra: The National Flood Emergency Framework for England, available at: https://www.gov.uk/government/uploads/system/ uploads/attachment_data/file/388997/pb14238-nfef-201412.pdf (last access: 13 December 2016), 2014.
Department of Transport: Guidance on Road Classifi-cation and the Primary Route Network, available at: https://www.gov.uk/government/uploads/system/uploads/ attachment_data/file/315783/road-classification-guidance.pdf (last access: 13 December 2016), 2012.
Dijkstra, E. W.: A Note on Two Problems in Connection with Graphs, Numer. Math., 1, 269–271, 1959.
Douglas, I., Garvin, S., Lawson, N., Richards, J., Tippett, J., and White, I.: Urban Pluvial Flooding: A Qualitative Case Study of Cause, Effect and Non-structural Mitigation, Journal of Flood Risk Management, 3, 112–125, 2010.
Edina Digimap: Ordnance Survey Datasets, available at: https:// digimap.edina.ac.uk/os, last access: 13 December 2016. Environment Agency: Flooding in England: A National
As-sessment of Flood Risk, available at: https://www.gov.uk/ government/uploads/system/uploads/attachment_data/file/ 292928/geho0609bqds-e-e.pdf (last access: 13 December 2016), 2009.
Environment Agency: Guidance on surface water flood map-ping for Lead Local Flood Authorities, available at: https://www.gov.uk/government/uploads/system/uploads/ attachment_data/file/297404/LIT_7030_91c653.pdf (last access: 13 December 2016), 2012.
Flood & Water Management Act: available at: http://www. legislation.gov.uk/ukpga/2010/29/pdfs/ukpga_20100029_en.pdf (last access: 13 December 2016), 2010.
Inno-vation and Response, edited by: Proverbs, D., Brebbia, C., and Penning-Rowsell, E., Wessex Institute of Technology Press, UK, 335–345, 2008.
HR Wallingford: Defra & Environment Agency – R&D Outputs: Flood Risks to People Phase 2, FD2321/TR2 Guidance Docu-ment, 2006.
Kendon, E., Roberts, N., Fowler, H., Roberts, M., Chan, S., and Se-nior, C.: Heavier Summer Downpours with Climate Change Re-vealed by Weather Forecast Resolution Model, Nature Climate Change, 4, 507–576, 2014.
Leicester City Council: Preliminary Flood Risk Assessment, available at: https://www.leicester.gov.uk/media/178227/ leicester-city-pfra-september-2011.pdf (last access: 13 Decem-ber 2016), 2011.
Leicester City Council: Surface Water Management Plan – part 1: report, available at: http://www.leicester.gov.uk/media/178251/ swmp-main-report.pdf (last access: 13 December 2016), 2012. Lhomme, S., Serre, D., Diab, Y., and Laganier, R.: Analyzing
re-silience of urban networks: a preliminary step towards more flood resilient cities, Nat. Hazards Earth Syst. Sci., 13, 221–230, doi:10.5194/nhess-13-221-2013, 2013.
Liu, J., Shi, Z., and Wang, D.: Measuring and Mapping the Flood Vulnerability Based on Land-use Patterns: a Case Study of Bei-jing, China, Nat. Hazards, 83, 1545–1565, 2016.
Lumbroso, D. and Vinet, F.: Tools to Improve the Production of Emergency Plans for Floods: Are They Being Used by the Peo-ple that Need Them?, Journal of Contingencies and Crisis Man-agement, 20, 149–165, 2012.
Lumbroso, D., Gaume, E., Logtmeijer, C., Mens, M., and Van der Vat, M.: Evacuation and Traffic Management, Integrated Flood Risk Analysis and Management Methodologies, Floodsite Con-sortium, 2008.
Ordnance Survey: Reducing Response Times, available at: http://webarchive.nationalarchives.gov.uk/20100402134053/ ordnancesurvey.co.uk/oswebsite/products/osmastermap/layers/ itn/casestudies/terrafixcasestudy.pdf (last access: 13 Decem-ber 2016), 2008.
Penning-Rowsell, E. C. and Parker, D. J.: The indirect effects of floods and benefits of flood alleviation: evaluating the Chesil Sea Defence Scheme, Appl. Geogr., 7, 263–288, 1987.
Pescaroli, G. and Alexander, D.: A definition of cascading disas-ters and cascading effects: Going beyond the “toppling dominos’ metaphor”, Planet-at-Risk, 3, 58–67, 2015.
Pitt, M.: The Pitt Review: Learning Lessons from the 2007 floods, available at: http://archive.cabinetoffice.gov.uk/pittreview/ thepittreview/final_report.html (last access: 13 December 2016), 2008.
Pregnolato, M., Ford, A., Robson, C., Glenis, V., Barr, S., and Daw-son, R.: Assessing Urban Strategies for Reducing the Impacts of Extreme Weather on Infrastructure Networks, The Royal Society Open Science, 3, 160023, doi:10.1098/rsos.160023, 2016. Sakakibaral, H., Kajitani, Y., and Okada, N.: Road Network
Robust-ness for Avoiding Functional Isolation in Disasters, J. Transp. Eng.-ASCE, 130, 580–587, 2004.
Shackley, S., Kersey, J., Wilby, R. L., and Fleming, P.: Changing by Degrees: The Potential Impacts of Climate Change in the East Midlands, Ashgate, Aldershot, 285, 2001.
Sniedovich, M.: Dynamic programming: foundations and princi-ples, CRC Press, 624 pp., 2010.
Stålhult, S. and Andersson, S.: Hospitals Exposed to Flood-ing in Manila City, Philippines: GIS Analyses of Alternative Emergency Routes and Allocation of Emergency Service and Temporary Medical Centre, Thesis, available at: https://www. diva-portal.org/smash/get/diva2:730984/FULLTEXT01.pdf (last access: 13 December 2016), 2014.
UK Government: Traffic Signs Regulations and General Directions Act, available at: http://www.legislation.gov.uk/uksi/2002/3113/ contents/made (last access: 13 December 2016), 2002.
UK Government: Civil Contingencies Act, available at: http://www. legislation.gov.uk/ukpga/2004/36/section/1 (last access: 13 De-cember 2016), 2004.
UK Government: Long term flood risk information, avail-able at: https://flood-warning-information.service.gov.uk/ long-term-flood-risk/map?map=Reservoirs, last access: 13 De-cember 2016.
UNESCO: World Disasters Report, Focus on Urban Risk, Interna-tional Federation of Red Cross and Red Crescent Societies, avail-able at: http://www.ifrc.org/Global/Publications/disasters/WDR/ wdr2010/WDR2010-full.pdf (last access: 13 December 2016), 214, 2010.
Watts, G., Battarbee, R., Bloomfield, J. P., Crossman, J., Daccache, A., Durance, I., Elliot, J., Garner, G., Hannaford, J., Hannah, D. M., Hess, T., Jackson, C. R., Kay, A. L., Kernan, M., Knox, J., Mackay, J., Monteith, D. T., Ormerod, S., Rance, J., Stuart, M. E., Wade, A. J., Wade, S. D., Weatherhead, K., Whitehead, P. G., and Wilby, R. L.: Climate Change and Water in the UK – Past Changes and Future prospects, Prog. Phys. Geog., 39, 6–28, 2015.
Whitfield, P. H.: Floods in Future Climates: A Review, Journal of Flood Risk Management, 5, 336–365, 2012.
Wilby, R. L. and Keenan, R.: Adapting to Flood Risk Under Cli-mate Change, Prog. Phys. Geog., 36, 349–379, 2012.
Wilby, R. L., Beven, K. J., and Reynard, N. S.: Climate Change and Fluvial Flood Risk in the UK: More of the Same?, Hydrol. Process., 22, 2511–2523, 2008.
Winn, M. T.: A Road Network Shortest Path Analysis: Applying Time-Varying Travel-Time Costs for Emergency Response Vehicle Routing, Davis County, Utah, Thesis, available at: http: //www.nwmissouri.edu/library/theses/2014/WinnMichael.pdf (last access: 13 December 2016), 2014.