AR
TIGO ORIGINAL / ORIGINAL AR
TICLE
INSULIN RESISTANCE INDEX (HOMA-IR) IN
THE DIFFERENTIATION OF PATIENTS WITH
NON-ALCOHOLIC FATTY LIVER DISEASE
AND HEALTHY INDIVIDUALS
Ana Lúcia Farias de Azevedo
SALGADO
1, Luciana de
CARVALHO
1, Ana Claudia
OLIVEIRA
1,
Virgínia Nascimento dos
SANTOS
1, Jose Gilberto
VIEIRA
2and
Edison Roberto
PARISE
1,
ABSTRACT – Context - Due to its good correlation to glycemic clamp, HOMA-IR has been widely utilized as insulin resistance index in
clinical and epidemiological studies involving non-alcoholic fatty liver disease carriers. However, values used for this parameter have shown large variability. Objective – To identify the HOMA-IR cut value that best distinguishes non-diabetic non-alcoholic fatty liver disease patients from a control group. Methods - One hundred sixteen non-alcoholic fatty liver disease patients were studied, diagnosed by
clinical, biochemical, and liver image or biopsy criteria, and 88 healthy individuals, without any liver disease and testing for oral glucose tolerance within normality. These groups did not differ in age and gender. All were submitted to oral glucose tolerance test and blood samples were collected for glucose and insulin measurements by immunoluorometric method. HOMA-IR was calculated according to the formula: fasting insulin (mU/L) x fasting glucose (nmol/L)/22.5. Results - NAFLD patients showed higher insulin, glycemia, and
HOMA-IR values than control group, even when excluding glucose intolerant and diabetes mellitus patients by their glycemic curves. HOMA-IR 75th percentile for control group was 1.78 and the best area under the curve index was obtained for HOMA-IR values of 2.0 [AUC= 0.840 (0.781–0.899 CI 95%), sensitivity (Se): 85%, speciicity (Sp): 83%] while value 2.5 showed best speciicity without important loss in sensitivity [AUC=0,831 (0.773-0.888) Se = 72%, Sp = 94%]. Conclusion: HOMA-IR values above or equal to 2.0 or
2.5 show enhanced diagnostic value in distinguishing non-alcoholic fatty liver disease carriers from control group individuals. HEADINGS - Insulin resistance. Fatty liver.
INTRODUCTION
Non-alcoholic fatty liver disease (NAFLD) has been pointed out as the most prevalent hepatic disease throughout the world. In the liver biopsy of these patients, pure steatosis, either associated to inlammation or not, and even steatohepatitis with or without ibrosis or cirrhosis, can be found(21). Insulin resistance has a central role in both steatosis installation and in its progression to more advanced forms of the disease as non-alcoholic steatohepatitis (NASH), what makes it the main pathogenic mechanism of NAFLD(9, 24).
Several methods have been used for diagnosing insulin resistance in humans. Glycemic clamp continues to be the gold standard procedure; however, its complexity limits its application in daily medical practice(16). Several methods using glycemia and insulinemia measurements, both during fasting or after oral or endovenous glucose overload, have been proposed(26, 28). Due to the simplicity of its determination and calculation, insulin resistance assessment by the homeostatic
assay (HOMA-IR) has been the most frequently employed technique both in clinical practice and in epidemiological studies. HOMA-IR, as proposed by Matthews et al.(19), shows signiicant correlation to glycemic clamp in non-diabetic patients and has been widely utilized in NAFLD clinical studies(2, 13, 14). In these studies, however, cut values of HOMA-IR to identify IR have been arbitrarily set and show great variety among authors. Moreover, these values were obtained in case-control studies or in trials performed with a small number of control subjects(11, 12, 25, 27).
The purpose of this study was to identify the best HOMA-IR cut value to differentiate non-diabetic NAFLD patients from a control group of non-obese subjects, without any known liver disease and with oral glucose overload within the normal range.
METHODS
For this study, 116 NAFLD patients were selected, diagnosed by liver biopsy or ultrasound detection of
Departamento de Medicina, 1 Disciplina de Gastroenterologia and 2 Endocrinologia, Universidade Federal de São Paulo, SP, Brazil
steatosis and increased liver enzymes, excluding patients with fasting glucose level above 125 mg/dL, positive hepatitis virus B or C serology (third generation ELISA detection method), alcohol consumption >20 g/day, other associated liver diseases, or use of medication with hepatotoxic potential. Control group constituted of 88 subjects without any detectable liver disease, body mass index <25, normal GTT, and of comparable age and gender with the group of evaluated patients.
Histological criteria: in patients submitted to percutaneous liver biopsy, histological analysis was conducted according to the criteria established by Mateonni et al.(18) and Brunt et al.(7).
A 2-hour oral glucose tolerance test (GTT) was performed after a 12-hour fasting period, following glucose overload with 75 g of dextrosol, diluted in 300 mL of water. Blood samples were collected in order to measure glycemia and insulinemia at fasting and 30, 60, 90, and 120 minutes after glucose overload.
AST, ALT, GGT, alkaline phosphatase, and glucose values were assessed by automatic kinetic methods. Insulinemia values were obtained by immunoluorometric assay (Perkin Elmer BR-CS).
HOMA-IR was calculated using the formula: HOMA-IR = [glucose (nmol/L) * insulin (mU/mL)/22.5], using fasting values(19).
According to the criteria adopted by the American Diabetes Association for fasting and post-oral overload glycemic values(4), patients were classiied as intolerant or pre-diabetic when fasting glycemia was between 100 and 125 mg/dL, or when the 120-minute glycemia reached between 140 and 199 mg/dL. Patients with 120-minute GTT glucose >200 mg/dL were considered diabetic.
The study protocol was approved by the Human Ethics Committee of Hospital de São Paulo, Universidade Federal de São Paulo SP, Brazil. Written informed consent was obtained from all participant subjects.
Statistical analysis: values were expressed as mean ±
standard error of the mean (M ± SEM). Student t test and c2 test were employed for comparisons among the studied groups and the ROC curve was used to evaluate diagnostic sensitivity. Values of P<0.05 were considered statistically signiicant.
RESULTS
One hundred sixteen NAFLD carriers were included in this study, amounting to 86 (74%) males with mean age of 41 years. Control group constituted of 88 subjects, 54 (68%) males with mean age of 42 years (Table 1).
Mean values of analyzed parameters (insulin, glycemia, HOMA-IR) for the studied groups are shown in Table 1.
Among NAFLD patients, 49% were biopsied, of which 32% were classiied as carriers of NAFLD types 1 and 2 (steatosis with or without inlammation) and 68% as types 3 and 4 (non-alcoholic steatohepatitis with or without ibrosis). Liver cirrhosis was diagnosed in 4.5% of the cases.
Control group presented HOMA-IR mean value of 1.27
± 0.63 (median = 1.10; 75th percentile = 1.78). All control
group subjects presented glycemic curves within normal range. Among the studied patients, 33.6% (39/116) were classiied as intolerant, while 10.4% (12/116) showed a diabetic curve. In 28.4% (33/116) of the patients, fasting glycemia was found above 99 mg%.
Signiicant differences between patients and control group subjects were observed in all studied points of glycemia and insulinemia concentrations (Figures 1A and 1B).
TABLE 1. Characteristics of the studied groups
Characteristics Control group NAFLD group P
n 88 116
Age (years) 42.3 ± 11.7 41.2 ± 11.0 0.488
Male gender (%) 54 (61%) 86 (74%) 0.075
BMI (kg/height2) 20.41 ± 0.31 30.05 ± 0.51 <0.001
Glucose (mg/dL) 84.7 ± 6.8 94.5 ± 9.9 <0.001
Insulin (µUi/mL) 6.04 ± 2.8 15.7 ± 7.6 <0.001
HOMA-IR 1.2 ± 0.6 3.9 ± 2.8 <0.001
FIGURE 1A. Comparative values for glucose levels during oral tolerance
test in control and NAFLD groups
NAFLD Control 250
200
150
100
50
0 30 60 90 120
TIME
glucose mg/dL
FIGURE 1B. Comparative values for insulin levels during oral tolerance
test in control and NAFLD groups 200
150
100
50
0
0 30 60 90 120
NAFLD
Control
Tim
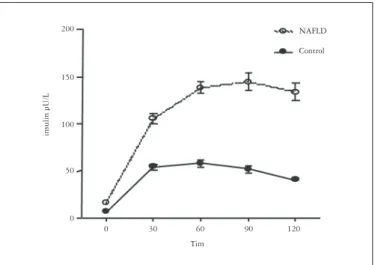
Insulinemia and HOMA values were found higher in patients when compared to control group, even after exclusion of patients with altered glycemic curve (intolerants and diabetics) from the analysis (Table 2).
remains the most utilized index in both daily practice and epidemiological studies.
IR is frequently found in NAFLD, related both to steatosis emergence and to disease progression to its more advanced forms, nominally steatohepatitis, cirrhosis and hepatocarcinoma(12, 29).
Studies with NAFLD patients have shown an almost universal concurrence of IR, making it a suggestive parameter for NAFLD diagnosis, which, up to this moment, does not present any speciic markers despite its high prevalence in the general population(3, 6, 22, 24).
In these studies, HOMA-IR values used to identify IR have been arbitrarily determined, showing wide variation among authors. These values were obtained in case-control studies, with a small number of individuals as control group, assessing IR by HOMA using the percentile value distribution of this reference population, not considering value distribution in NAFLD carriers(1, 5, 8).
In this work, we took great care in amplifying the concept of control population, stipulating that individuals should also present a normal glycemic curve, in addition to being free of any known systemic or liver diseases. Moreover, we sought to study a proportional number of control cases, in the control group, to the number of studied patients, selecting individuals with similar demographic characteristics as those for the NAFLD patients.
We proceeded comparing the diagnostic accuracy of several cut points of HOMA-IR, which best distinguished NAFLD patients from control group subjects.
The corresponding HOMA-IR value to the 75th percentile of the reference population was 1.78, similar to that of other studies, such as from Chitturi et al.(10), but much lower than the 3.04 observed by Lee et al.(15) in the Korean population. Considering that we used variations of whole numbers to evaluate the diagnostic capacity of HOMA-IR values, the cut value of 2, which is the closest to the 75th percentile, showed the best discriminatory capability between the studied groups as shown in Table 3. On the other hand, values of 2.5 and 3.0 presented better speciicity, although accompanied by progressive loss in sensitivity, which made us conclude that 2.5 would the best value to exclude control group with the smallest loss of NAFLD patients.
Finally, even excluding glucose intolerant patients or those with GTT diabetic curve, insulinemia and HOMA-IR values for these patients are still signiicantly increased when compared to those of subjects from the control group. Even though it can be argued that this is a mere relection of the subjects greater body mass, it is worthy of notice that even among morbidly obese patients, values similar to those for the control group can be observed. Perugini et al.(22), for example, found that only 34% of 138 candidates for gastric bypass presented HOMA-IR higher than 2.3, observing no correlation between HOMA-IR and BMI(22). In this way, it is more likely that increased insulinemia and HOMA-IR values translate the initial IR phase, when compensatory hyperinsulinemia is able to normalize
TABLE 2. Insulinemic curve and HOMA-IR in the studied groups,
excluding diabetic and glucose intolerant patients Control group
(n = 88)
NAFLD group
(n = 65) P
HOMA-IR 1.2 ± 0.06 3.3 ± 0.22 <0.001
Insulin 0’ 6.0 ± 0.3 14.8 ± 0.9 <0.001
Insulin 30’ 54.4 ± 3.0 112 ± 7.4 <0.001
Insulin 60’ 58.3 ± 3.7 133.2 ±8.3 <0.001
Insulin 90’ 51.6 ± 3.2 117.0 ± 8.7 <0.001
Insulin 120’ 89.1 ± 0.06 58.0 ± 7.2 <0.001
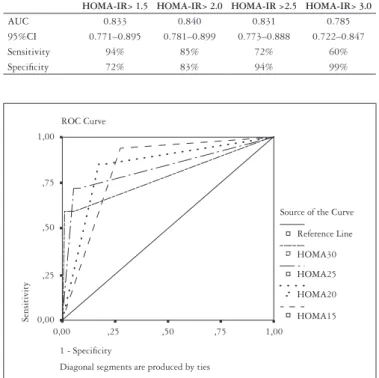
In order to identify the best HOMA-IR value to distinguish NAFLD subjects from the control group, data was analyzed by means of the ROC curve, as shown in Figure 2 and Table 3. As it can be seen, the best area under the curve was obtained for HOMA-IR values of 2.0.
TABLE 3. Sensitivity and speciicity of HOMA-IR values in NAFLD patients
HOMA-IR> 1.5 HOMA-IR> 2.0 HOMA-IR >2.5 HOMA-IR> 3.0
AUC 0.833 0.840 0.831 0.785
95%CI 0.771–0.895 0.781–0.899 0.773–0.888 0.722–0.847
Sensitivity 94% 85% 72% 60%
Speciicity 72% 83% 94% 99%
FIGURE 2. ROC curve: sensitivity and speciicity for several
HOMA-IR values
Source of the Curve
Reference Line
HOMA30
HOMA25
HOMA20
HOMA15 ROC Curve
1,00
1,00 ,75
,75 ,50
,50 ,25
,25 0,00
0,00
1 - Speciicity
Diagonal segments are produced by ties
Sensitivity
DISCUSSION
Salgado ALFA, Carvalho L, Oliveira AC, Santos VN, Vieira JG, Parise ER. Índice de resistência insulínica (HOMA-IR) na diferenciação entre pacientes com doença hepática gordurosa não-alcoólica e indivíduos saudáveis. Arq Gastroenterol. 2010;47(2):165-9.
RESUMO – Contexto - Pela sua boa correlação com o “clamp” glicêmico, o HOMA-IR tem sido largamente utilizado como índice de resistência insulínica
em estudos clínicos e epidemiológicos em pacientes com doença hepática gordurosa não-alcoólica. Porém os valores utilizados para esse parâmetro
têm sido muito variáveis. Objetivo - Identiicar o valor de corte do HOMA-IR que melhor diferencie pacientes com doença hepática gordurosa
não-alcoólica não-diabéticos, de um grupo controle. Métodos - Foram estudados 116 pacientes com doença hepática gordurosa não-alcoólica,
diagnosticados por critérios clínicos, bioquímicos e de imagem ou biopsia hepática e 88 indivíduos saudáveis, sem doença hepática e com teste de tolerância oral à glicose dentro da normalidade. Esses grupos não diferiam quanto à idade e gênero. Todos foram submetidos ao teste de tolerância oral à glicose e coletadas amostras de sangue para dosagem de glicemia e de insulina através de método imunoluorimétrico. Foi feito o cálculo do HOMA-IR de acordo com fórmula = insulina de jejum (mU/L) x glicemia de jejum (nmol/L)/22.5. Resultados - Os pacientes com doença hepática
gordurosa não-alcoólica apresentaram valores mais elevados de insulina, glicemia e HOMA-IR que o grupo controle, mesmo quando excluídos os pacientes com diagnóstico de intolerância à glicose ou de diabetes mellitus pela curva glicêmica. O percentil 75 para HOMA-IR no grupo controle foi de 1.78 e o melhor índice de área sob a curva foi obtido para os valores de HOMA-IR de 2,0 [ASC = 0,840 (0,781–0,899 IC95%), sensibilidade: 85%, especiicidade: 83%] enquanto o valor de 2,5 foi o que apresentou melhor especiicidade, sem perda importante de sensibilidade [ASC = 0,831
(0.773-0.888) sensibilidade: 72%, especiicidade: 94%] . Conclusão - Valores de HOMA-IR acima ou iguais a 2.0 ou 2.5 mostram elevado valor
diagnóstico na distinção entre os doentes com doença hepática gordurosa não-alcoólica e indivíduos do grupo controle. DESCRITORES - Resistência à insulina. Fígado gorduroso.
glucose circulating values, unfortunately leading to altered liver lipid metabolism, which results in liver steatosis(12). Indeed, it was demonstrated that even though almost 90% of NAFLD patients present more than one characteristic of metabolic syndrome, only one third of them have the ultimate MS diagnostic(17, 20, 23).
REFERENCES
1. Adams LA, Lymp JF, St. Sauver J, Sanderson SO, Lindor KD, Feldstein A. The natural history of nonalcoholic fatty liver disease: a population-based cohort study. Gastroenterology. 2005;129:113-21.
2. Aguilera E, Recasens M, Flores L, Ricart MJ, Casamitjana R, Fernadéz-Cruz L, Esmatjes E. HOMA Test in diabetic patients with simultaneous pancreas and kidney transplantation. Transplant Proc. 2002,34:206-8.
3. Aller R, Luis DA, Fernandez L, Calle F, Velayos B, Olcoz JL, Izaola O, Sagrado MG, Conde R, Gonzalez JM. Inluence of insulin resistance and adipokines in the grade of steatosis of nonalcoholic fatty liver disease. Dig Dis Sci. 2007,53:1088-92.
4. American Diabetes Association. Diagnosis and classiication of diabetes mellitus. Diabetes Care. 2007;30:542–7.
5. Angulo P, Alba LM, Petrovic LM, Adams LA, Lindor, KD, Jensen D, Leptin insulin resistance, and liver ibrosis in human nonalcoholic fatty liver disease. J Hepatol. 2004;41:943-9.
6. Angulo P, Hui JM, Marchesini G, Bugianesi E, George J, Farrell GC, Enders F, Saksena S, Burt AD, Bida JP, Lindor K, Sanderson SO, Lenzi M, Adams LA, Kench J, Therneau TM, Day CP. The NAFLD ibrosis score: a noninvasive system that identiies liver ibrosis in patients with NAFLD. Hepatology. 2007;45:846-54. 7. Brunt EM, Janney CG, Bisceglie AM, Neuschwander-Terti BA, Bacon BR.
Nonalcoholic steatohepatitis: a proposal for grading and staging the histological lesions. Am J Gastroenterol. 1999;94:2467-74.
8. Chalasani N, Deeg MA, Persohn S, Crabb DW. Metabolic and anthropometric evaluation of insulin resistance in nondiabetic patients with nonalcoholic steatohepatitis. Am J Gastroenterol. 2003;98:1849-55.
9. Chitturi S, Farrel GC. Etiopathogenesis of nonalcoholic steatohepatitis. Semin Liver Dis. 2001;21:27-41.
10. Chitturi S, Abeygunasekera S, Farrell GC, Holmes-Walker J, Hui JM, Fung C, Karim R, Lin R, Samarasinghe D, Liddle C, Weltman M, George J. NASH and insulin resistance: insulin hypersecretion and speciic association with the insulin resistance syndrome. Hepatology. 2002;35:373-9.
11. Duseja A, Thumburu KK, Das A, Dhiman RK, Chawla YK, Bhadada S, Bhansali A. Insulin tolerance test is comparable to homeostasis model assessment for insulin resistance in patients with nonalcoholic fatty liver disease. Indian J Gastroenterol. 2007;26:170-3.
In this way, HOMA-IR values greater than or equal to 2.0 or 2.5 show enhanced diagnostic value in the distinction of NAFLD carriers and control group individuals. This differentiation is due to increased insulinemia levels observed among NAFLD patients, even when glucose intolerant carriers or diabetic patients are excluded from the analysis.
12. Duvnjak M, Lerotic I, Barsic N, Tomasic V, Jukic LV, Velagic V. Pathogenesis and management issues for non-alcoholic fatty liver disease. World J Gastroenterol. 2007,13:4539–50.
13. Katz A, Nambi SS, Mather NK, Baron AD, Follmann DA, Sullivan G, Quon MJ. Quantitative insulin sensitivity check index: a simple, accurate method from assessing insulin sensitivity in humans. J Clin Endocrinol Metabol. 2000;85:2402–10. 14. Lansang MC, Williams GH, Carroll JS. Correlation between the glucose clamp
technique and the homeostasis model assessment in hypertension. Am J Hypertens. 2001;14:51-3.
15. Lee S, Choi S, Kim HJ, Chung Y-S, Lee KW, Lee HC, Huh KB, Kim DJ. Cutoff values of surrogate measures of insulin resistance for metabolic syndrome in Korean non diabetic adults. J Korean Med Sci. 2006;21:695-700.
16. Leonetti F, Iacobellis G, Zappaterreno MC, Ribaudo C, Tiberti E, Vecci E, Di Mario U. Insulin sensitivity assessment in uncomplicated obese women: comparison of indices from fasting and oral glucose load with euglycemic hyperinsulinemic clamp. Nutr Metabol Cardiovasc Dis. 2004;14:336-72.
17. Marchesini, G. Bugianesi, E. Forlani, G. Cerrelli, F. Lenzi, M. Manini, R. Natale, S. Vanni, E. Villanova, N. Melchionda, N. Rizzetto, M. Nonalcoholic fatty liver, steatohepatitis, and the metabolic syndrome. Hepatology. 2003;37:917-23. 18. Matteoni C A, Younossi ZM, Gramlich T, Boparai N, Lui YC, McCullough AJ.
Nonalcoholic fatty liver disease: a spectrum of clinical and pathological severity. Gastroenterology. 1999;116:1413-19
19. Matthews DR, Hosker JP, Rudenski AS, Naylor BA, Treacher DF, Turner RC. Homeostasis model assessment: insulin resistance and beta-cell function from fasting plasma glucose and insulin concentrations in man. Diabetologia. 1985;28:412-19.
20. Musso G, Gambino R, Bo S, Uberti B, Biroli G, Pagano G, Cassader M. Should nonalcoholic fatty liver disease be included in the deinition of metabolic syndrome? A cross-sectional comparison with adult treatment panel III criteria in nonobese nondiabetic subjects. Diabetes Care. 2008;31:562- 8.
21. Patrick L. Nonalcoholic fatty liver disease: relationship to insulin sensitivity and oxidative stress. treatment approaches using vitamin E, magnesium and betaine. Altern Med Rev. 2002;7:276-91.
23. Rector RS, Thyfault JP, Wei Y, Ibdah JA. Non-alcoholic fatty liver disease and metabolic syndrome: an update. World J Gastroenterol. 2008;14:185-92. 24. Shimada M, Kawahara H, Ozaki K, Fukura M, Yano H, Tsuchishima M.
Usefulness of a combined evaluation of the serum adiponectin level, HOMA-IR, and serum type IV collagen 7S level to predict the early stage of nonalcoholic steatohepatitis, Am J Gastroenterol. 2007;102:1931-8.
25. Song Y, Manson JE, Tinker L, Howard BV, Kuller LH, Nathan L, Rifai N, Liu S. Insulin sensitivity and insulin secretion determined by homeostasis model assessment and risk of diabetes in a multiethnic cohort of women. Diabetes Care. 2007;30:1747-52.
26. Vaccaro O, Masulli M, Cuomo V, Rivellese AA, Ussitupa M, Vessby B, Hermansen K, Tapsell L, Riccardi G. Comparative evaluation of simple indices of insulin resistance. Metabolism. 2004;53:1526-52.
27. Ybarra J, Sanchez-Hernandez J, Pérez A. Non-HDL-cholesterol, waist circumference and the HOMA index: correlations in the healthy. Preven Control. 2005;1: 183-4.
28. Yeckel CW, Weiss R, Dziura J, Taksali SE, Dufour S, Burgert TS, Tamborlane WV, Caprio S. Validation of insulin sensitivity indices from oral glucose tolerance test parameters in obese children and adolescents. J Clin Endocrinol Metab. 2004;89:1096-101.
29. Yeh MM, Brunt EM. Pathology of nonalcoholic fatty liver disease. Am J Clin Pathol. 2007;128:837-47.