www.the-cryosphere.net/9/1535/2015/ doi:10.5194/tc-9-1535-2015
© Author(s) 2015. CC Attribution 3.0 License.
Area, elevation and mass changes of the two southernmost ice caps
of the Canadian Arctic Archipelago between 1952 and 2014
C. Papasodoro1,2, E. Berthier3, A. Royer1,2, C. Zdanowicz4, and A. Langlois1,2
1Centre d’Applications et de Recherches en Télédétection, Université de Sherbrooke, Sherbrooke, Québec, Canada 2Centre d’Études Nordiques, Québec City, Québec, Canada
3Laboratoire d’Etudes en Géophysique et Océanographie Spatiales, Centre National de la Recherche Scientifique (LEGOS – CNRS, UMR5566), Université de Toulouse, 31400 Toulouse, France
4Department of Earth Sciences, Uppsala University, 75236 Uppsala, Sweden Correspondence to:C. Papasodoro ([email protected])
Received: 16 February 2015 – Published in The Cryosphere Discuss.: 16 March 2015 Revised: 22 July 2015 – Accepted: 25 July 2015 – Published: 7 August 2015
Abstract.Grinnell and Terra Nivea Ice Caps are located on the southern Baffin Island, Nunavut, in the Canadian Arctic Archipelago. These relatively small ice caps have received little attention compared to the much larger ice masses fur-ther north. Their evolution can, however, give valuable in-formation about the impact of the recent Arctic warming at lower latitudes (i.e. ∼62.5◦N). In this paper, we mea-sure or estimate historical and recent changes of area, el-evation and mass of both ice caps using in situ, airborne and spaceborne data sets, including imagery from the Pléi-ades satellites. The area of Terra Nivea Ice Cap has de-creased by 34 % since the late 1950s, while that of Grin-nell Ice Cap has decreased by 20 % since 1952. For both ice caps, the areal reduction accelerated at the beginning of the 21st century. The estimated glacier-wide mass balance was −0.37±0.21 m a−1water equivalent (w.e.) over Grinnell Ice Cap for the 1952–2014 period, and−0.47±0.16 m a−1w.e. over Terra Nivea Ice Cap for the 1958/59–2014 period. Terra Nivea Ice Cap has experienced an accelerated rate of mass loss of −1.77±0.36 m a−1w.e. between 2007 and 2014. This rate is 5.9 times as negative when compared to the 1958/59–2007 period (−0.30±0.19 m a−1w.e.) and 2 times as negative when compared to the mass balance of other glaciers in the southern parts of Baffin Island over the 2003– 2009 period. A similar acceleration in mass loss is sus-pected for the Grinnell Ice Cap, given the calculated ele-vation changes and the proximity to Terra Nivea Ice Cap. The recent increase in mass loss rates for these two ice caps is linked to a strong near-surface regional warming and a
lengthening of the melt season into the autumn that may be indirectly strengthened by a later freezing of sea ice in the Hudson Strait sector. On a methodological level, our study illustrates the strong potential of Pléiades satellite data to un-lock the under-exploited archive of old aerial photographs.
1 Introduction
With a glacierized area of∼150 000 km2, the Canadian Arc-tic Archipelago (CAA) is one of the major glacier regions in the world (Pfeffer et al., 2014). In response to recent Arctic warming (Tingley and Huybers, 2013; Vaughan et al., 2013; Comiso and Hall, 2014), glaciers in the CAA have experi-enced an acceleration in their mass loss. For the southern parts of the CAA, annual thinning of glaciers has doubled between the historical (1963–2006) and recent (2003–2011) periods (Gardner et al., 2012). Over the entire CAA, the rate of mass change has tripled between 2004 and 2009, reach-ing−92±12 Gt a−1during the period 2007–2009 (Gardner et al., 2011), making this region one of the main contribu-tors to eustatic sea-level rise for this period, after Greenland and Antarctica (Gardner et al., 2013; Vaughan et al., 2013). Continued monitoring of CAA glaciers is thus critical.
num-ber of isolated icefields and small ice caps, including Grin-nell Ice Cap (GRIC) and Terra Nivea Ice Cap (TNIC) on Meta Incognita Peninsula, at the southernmost tip of the is-land (Fig. 1). Compared to Barnes and Penny Ice Caps, GRIC and TNIC have received little scientific attention so far (An-drews et al., 2002). Different in situ geophysical measure-ments were carried out in the 1950s (Blake, 1953; Mercer, 1956), and in the 1980s by teams from the University of Cambridge and the University of Colorado (Dowdeswell, 1982, 1984). Under the supervision of veteran Norwegian glaciologist Dr. Gunnar Østrem, other measurements were conducted on GRIC in the early 1990s by a scientific team from Bates College (Maine, USA) and Nunavut Arctic Col-lege. Later in 2003–2004, glaciologists from the Geological Survey of Canada carried out in situ measurements on GRIC (Global Navigation Satellite System (GNSS) elevation mea-surements, automatic weather observations, snow depth and surface mass balance measurements) with the objective of establishing a long-term observing site. However, consistent prohibitive weather conditions coupled with difficult access to the ice cap led to the cancellation of the project (Zdanow-icz, 2007). A recent study (Way, 2015) analyzed changing rates of glacier recession for GRIC and TNIC since the 1950s using historical aerial photographs, satellite (Landsat) im-agery and digital elevation models (DEMs). In the present study, we supplement these results by presenting a com-prehensive analysis of historical and recent fluctuations of area, surface elevation and mass for GRIC and TNIC over the period 1952–2014. This is done by combining data from spaceborne instruments (laser altimetry and optical stereo imagery), DEMs, airborne imagery (air photos) and in situ GPS surveys. Our analysis differs from that of Way (2015) in the choice of photos, DEMs, and spaceborne, remotely sensed data used to determine glacier change. In particular, we explored the use of sub-meter resolution stereo pairs ob-tained from the Pléiades satellites to derive DEMs and to collect accurate, numerous and homogeneously distributed ground control points (GCPs) for the photogrammetric pro-cessing of aerial photos. We place our findings in the context of the observed pattern of regional glacier changes across the CAA, and discuss climatic forcing factors of particular rele-vance for the southernmost Baffin Island region.
2 Study area
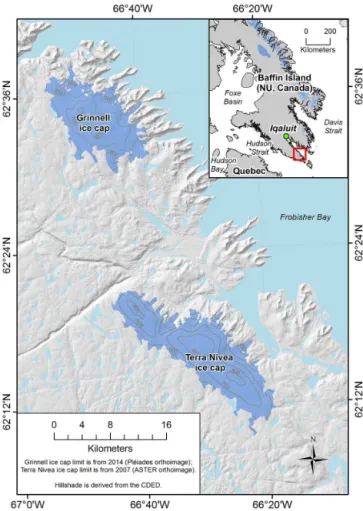
GRIC and TNIC (Fig. 1) are located on Meta Incog-nita Peninsula, 200 km south of Iqaluit, Nunavut. GRIC (62.56◦N, 66.79◦W) covers an area of 107 km2 (Au-gust 2014; this study) with the highest elevations reaching 800 m a.s.l. (above sea level). On the northeast side, some outlet glaciers extend to Frobisher Bay, which opens into the Labrador Sea. TNIC (62.27◦N, 66.51◦W) is located ∼17 km south of the GRIC. It covers an area of approxi-mately 150 km2(August 2014; this study) with a similar
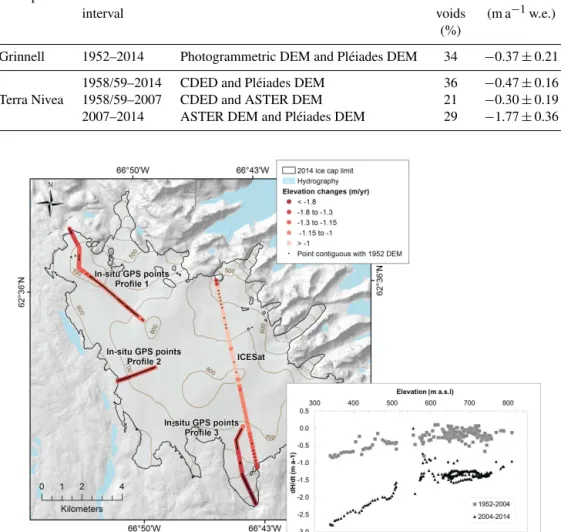
el-Figure 1.Study area.
evation range as GRIC. Mercer (1954) suggested three fac-tors supporting the continued presence of plateau ice caps on Meta Incognita Peninsula: (1) cool summers, (2) frequent low-level cloud and (3) heavy snowfall. Data from the perma-nent weather station in Iqaluit (34 m a.s.l.) indicate that win-ter temperatures (DJF) in this region averaged−24◦C over the past 60 years, while mean summer temperatures (JJA) av-eraged 6.5◦C. Total annual precipitation is∼500 mm (snow: ∼300 mm; rain: ∼200 mm). Field observations in winter 2003–04 found no firn at the summit of GRIC, and the es-timated winter snow accumulation there (∼2–3 m snow; or ∼0.65–0.75 m water equivalent) was approximately equal to the amount of melt in summer (Zdanowicz, 2007). Hence the summit of the GRIC is probably close, or slightly below, the present-day equilibrium line altitude (ELA), making it highly susceptible to experience net mass losses (Pelto, 2010).
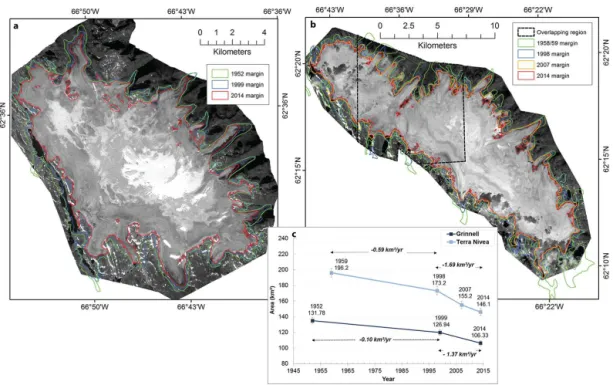
Figure 2. (a)Pléiades orthoimage of Grinnell Ice Cap (3 August 2014) superimposed with areal extents from 1952, 1999 and 2014.(b)
Pléi-ades orthoimages of Terra Nivea Ice Cap (14 August 2014 on the east side and 26 August 2014 on the west side) superimposed with areal extents from 1958/59, 1998, 2007 and 2014. The overlapping area between the two orthoimages is represented by the black dashed polygon.
(c)Historical and recent area changes for both ice caps. Error margins were estimated at 5 % for historical areas and at 3 % for 1998 and later outlines (Sect. 4.4.3.).
probably reached their largest areal extent during the Little Ice Age cold climate interval (Muller, 1980; Dowdeswell, 1982, 1984; Andrews, 2002). Dowdeswell (1982) estimated that the outlet glacier of GRIC that calves into Watts Bay extended much further out a few centuries earlier, but also reported that another outlet glacier to the south of the ice cap was advancing.
3 Data
3.1 Pléiades stereoscopic images
Launched on 17 December 2011 and 2 December 2012 re-spectively, the Pléiades 1A and 1B satellites have recently shown their high potential for glacier DEM extraction and thus, for mass balance estimations (Wagnon et al., 2013; Berthier et al., 2014; Marti et al., 2015). The two satellites follow the same near-polar sun-synchronous orbit and pro-vide panchromatic and multispectral imagery at a very high ground spatial resolution, 0.7 m for panchromatic and 2.8 m for multispectral images, respectively (Astrium, 2012). Both satellites have independent stereoscopic capabilities. The fact that the panchromatic band images derived from Pléiades satellites are coded in 12 bits represents a clear advantage on a glacier surface (especially over the low contrast accu-mulation area), given the fact that a large radiometric range
provides better contrast and reduces the risk of image satura-tion (Berthier et al., 2014).
Three stereoscopic pairs were acquired over our study area (Table 1): one for GRIC (3 August 2014) and two for TNIC (14 August 2014 for the eastern part and 26 Au-gust 2014 for the western part, with an overlapping area of 84 km2). The stereoscopic pair covering GRIC is cloud-free, while a few clouds (<10 % of the scene) were present over TNIC during scene acquisitions (Fig. 2). Acquisitions were made at the end of the ablation season to ensure a maxi-mum degree of surface texture (Berthier and Toutin, 2008). Each image was provided with Rational Polynomial Coef-ficients (RPCs), which allows geometric modeling without GCP. Stereoscopic pairs were used (1) for DEM generation on both ice caps and (2) for GCP extraction for the pho-togrammetric processing of the historical aerial photos on GRIC (see Sect. 4.2).
3.2 Historic Canadian Digital Elevation Data
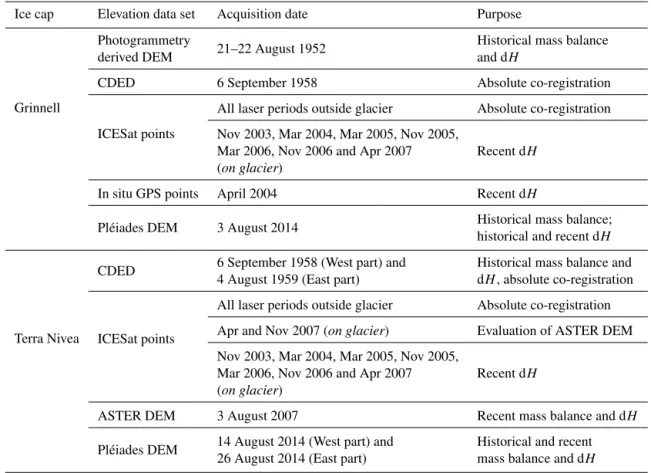
differ-Table 1.Elevation data sets used in this study with the acquisition date and the purpose of their use for each ice cap.
Ice cap Elevation data set Acquisition date Purpose
Grinnell
Photogrammetry 21–22 August 1952 Historical mass balance
derived DEM and dH
CDED 6 September 1958 Absolute co-registration
ICESat points
All laser periods outside glacier Absolute co-registration
Nov 2003, Mar 2004, Mar 2005, Nov 2005,
Recent dH
Mar 2006, Nov 2006 and Apr 2007 (on glacier)
In situ GPS points April 2004 Recent dH
Pléiades DEM 3 August 2014 Historical mass balance;historical and recent d
H
Terra Nivea
CDED 6 September 1958 (West part) and4 August 1959 (East part) Historical mass balance andd
H, absolute co-registration
ICESat points
All laser periods outside glacier Absolute co-registration
Apr and Nov 2007 (on glacier) Evaluation of ASTER DEM
Nov 2003, Mar 2004, Mar 2005, Nov 2005,
Recent dH
Mar 2006, Nov 2006 and Apr 2007 (on glacier)
ASTER DEM 3 August 2007 Recent mass balance and dH
Pléiades DEM 14 August 2014 (West part) and26 August 2014 (East part) Historical and recentmass balance and d
H
ences and their standard deviation (SD) between CDED and ICESat laser altimetry were previously calculated off-glacier for 340 CDED maps tiles covering Baffin Island and were reported to be 1.1 and 5.1 m, respectively (Gardner et al., 2012). Here, CDED were used (1) as historical elevations for TNIC and (2) elevations of the surrounding ice-free ter-rain were used for absolute co-registration for both ice caps (see Sect. 4.3). Artefacts (unrealistic elevations) located in the accumulation area of TNIC were manually identified and deleted using a shaded relief image derived from the DEM. These artefacts were likely due to the poor contrast and low texture of the 1958/59 aerial photos used to generate the CDED.
3.3 Historical aerial photos
Historic aerial photos covering GRIC were obtained through the Canadian National Air Photo Library (Natural Resources Canada). We used 24 photos acquired at the end of the ab-lation season, on 21 and 22 August 1952. A Williamson Eagle IX Cone 524 camera type with a focal length of 152.15 mm was used and the flight altitude was 16 000 ft (∼4877 m). The photos are distributed in 3 parallel flight lines with an overlapping coverage of∼30 % between each line and∼60 % between two photos of a same line. These photos, exceptional in their quality of detail and texture, were
used for the extraction of historical elevations on GRIC and were preferred to the CDED for this ice cap. In fact, the CDED covering GRIC contained major artefacts (i.e. much larger than for TNIC) in the large snow-covered accumula-tion zone where the texture was particularly weak on the 1958 photos and thus, was not suitable for historical eleva-tions of this ice cap.
3.4 ICESat altimetric points
3.5 ASTER DEM
Products derived from the ASTER satellite mission have been widely used for glaciological studies (e.g. Kääb, 2008; Nuth and Kääb, 2011; Das et al., 2014). To estimate the recent mass balance for TNIC, we used a DEM (product AST14DMO) generated from an ASTER stereo pair ac-quired on 3 August 2007. The DEM was automatically de-rived from bands 3N (nadir-viewing) and 3B (backward-viewing) that have an intersection angle of 27.6◦, which cor-responds to a base-to-height ratio of 0.6 (Fujisada et al., 2005). The raw DEM was provided with a grid spacing of 30 m, and elevations are orthometric to the EGM96 geoid. Using 57 ICESat points from two different time periods, namely a few months before (April 2007) and after (Novem-ber 2007) the ASTER acquisition, we assessed a vertical pre-cision of 2.5 m (SD) on TNIC for this ASTER DEM. Due to cloud coverage, no suitable ASTER DEM was available for GRIC at the end of the ablation season.
3.6 In situ GPS measurements
In April 2004, a team from the Geological Survey of Canada measured three surface elevation profiles at 50 m horizontal intervals using a Trimble®high-precision Real-Time Kine-matic GPS system on the southeast, west and northwest sides of GRIC, and at the front of one of its outlet glaciers (Zdanowicz, 2007). Data acquisition was made using a fixed base station on a geodetic benchmark monument, and GPS positions were subsequently processed with the Canadian Center for Remote Sensing’s Precise Point Positioning (PPP) System to obtain an accuracy of a few centimeters. For this paper, those transects were used for recent elevation change calculations. Elevations derived from those GPS measure-ments are referenced to the GRS80 ellipsoid which can be as-sumed equal to the WGS84 ellipsoid (sub-mm differences). 3.7 Glacier outlines
Various data sets have been used to extract the areal extent of the two ice caps at the end of the ablation season (Au-gust/September). For GRIC, three data sets from different dates were used. The 1952 outline was derived manually from the orthorectified historical aerial photos. For 1999, we used the ice cap contour from the Randolph Glacier Inven-tory (RGI 3.2; Pfeffer et al., 2014), which originates from the Canadian CanVec data set for this region, itself derived from a September 1999 Landsat 7 image. We manually dig-itized the 2014 margin from the orthorectified panchromatic Pléiades image. For TNIC, outlines were derived for four different dates. We used the raw vectors from the 1 : 250 k Canadian National Topographic Data Base as the 1958/59 boundary. Anomalies were found in the delineation of the 1999 margin from the RGI 3.2 (i.e. off-glacier snow patches erroneously included). As an alternative, we manually
digi-tized the ice cap margin using a 30 m resolution Landsat 5 image acquired on August 1998. The August 2007 limit was manually traced from an ASTER orthoimage (15 m reso-lution) provided with the on-demand AST14DMO product, while the 2014 margin was extracted from the orthorectified panchromatic Pléiades images (East and West). To overcome the cloudiness on the Pléiades orthoimages (∼20 % of the ice cap outline obscured by clouds), we used a Landsat 8 panchromatic (15 m of resolution) image also acquired in August 2014. The uncertainty assessment of the outlines is presented in Sect. 4.4.3.
3.8 Meteorological and sea ice records
To quantify changes in the regional climate of the southern Baffin Island region over the period covered in our study, air temperature records were retrieved from the Adjusted and Homogenized Canadian Historical Climate Data of the Iqaluit weather station for the period 1950–2014 (Vincent et al., 2002). This is the permanent weather station in the eastern Canadian Arctic with the most continuous records, extending back to 1946. In addition, time series of sea ice cover area for Hudson Strait and Davis Strait were obtained from the Canadian Ice Service archives over the 1968–2014 period.
4 Methods
4.1 Pléiades DEM generation
The Pléiades DEMs were generated using the OrthoEngine module of Geomatica 2013. No GCP were available for the geometric correction so we relied on the RPCs provided with the images. Adding GCP does not improve the vertical pre-cision of the Pléiades DEM, but can reduce the vertical bias (Berthier et al., 2014). The latter bias can be corrected over ice-free terrain when a good reference data set, such as ICE-Sat, is available (Nuth and Kääb, 2011).
The following steps of DEM extraction were repeated for the three Pléiades stereoscopic pairs. First, we collected 20 tie points (TPs) outside and six on the ice cap. Collect-ing well-distributed TPs was found to improve the relative orientation between the two images providing increased cov-erage (Berthier et al., 2014). The following processing pa-rameters were used for DEM extraction: the relief type was set toMountainousand the DEM detail toLow. No
interpola-tion was performed to fill data gaps. Finally, the DEMs were geocoded with a pixel size of 4 m.
1 m (SD), highlighting the consistent precision over glacier surfaces. This precision was shown to be mostly correlated with slope. For the small Ossoue Glacier (French Pyrénées), the precision was slightly lower at 1.8 m (Marti et al., 2015). A similar vertical precision is expected here.
4.2 Aerial photos DEM generation
Photogrammetry is widely used in glaciological studies for reconstructing glacier surface prior to the modern satellite era (Fox et Nuttall, 1997; Barrand et al., 2009). In this study, a 1952 DEM of GRIC was created from historical air pho-tos using OrthoEngine. This software uses a mathematical model compensating for both terrain variations and inherent camera distortions (PCI Geomatics, 2013). A typical pho-togrammetric procedure was then followed to compute the model, solving the least-square bundle adjustment.
Collecting effective GCPs for photogrammetry in moun-tainous or polar regions remains one of the main difficulties, especially for archive photos (Barrand et al., 2009). To over-come this difficulty, Pléiades-derived products (DEM and or-thoimage) were used to collect GCPs. For each aerial stereo-scopic model partially covering the surrounding ice-free ter-rain, 3 to 7 GCPs were collected outside the ice cap on to-pographic or geomorphologic structures visible on both the Pléiades orthoimage and the aerial photographs. In order to strengthen the mathematical model, every GCP was collected as stereo GCP (i.e. was identified in all possible aerial pho-tographs). A total of 39 stereo GCPs were collected result-ing in 106 GCPs. Also, 6 to 10 widely-dispersed TPs were collected for each aerial stereoscopic model. For the mod-els situated in the middle of the photogrammetric block and covering only the ice cap (no ice-free terrain), only TPs were collected in order to connect them to the photogrammetric block. After the final bundle adjustment, the resulting resid-ual averages of all the GCPs were 2.85 m inX, 2.74 m inY and 2.68 m inZ. TPs residuals were 1.84 m inXand 2.15 m inY. The generated global DEM was geocoded with a grid resolution of 10 m and no interpolation of data gaps was per-formed.
Validation of the resulting DEM (before co-registration) against 76 ICESat points on ice-free terrain showed a mean offset of−3.29 m (DEM above ICESat in elevations) and a SD of 4.96 m. Between the Pléiades DEM and the 1952 DEM (co-registered together, see Sect. 4.3), the SD of the elevation difference on ice-free terrain was 13.8 m. In total, 66 % of GRIC area was extracted, with data gaps concentrated at the highest elevations in the texture-less accumulation area. 4.3 DEM adjustments and co-registrations
DEM co-registration is of primary importance before per-forming any DEM-based volume change calculations (Nuth and Kääb, 2011). This 3-D co-registration method uses the relationship between aspect, slope and elevation differences
over ice-free terrain (Nuth and Kääb, 2011). The Pléiades images only included a small corridor (∼20 km2) of ice-free terrain near the ice caps (Fig. 2). This corridor coin-cides with a limited number of cloud-free ICESat points (less than 100 points sparsely distributed around each ice cap) so that a direct co-registration between the Pléiades DEMs and the ICESat points was not optimal. Instead, the CDED tile encompassing the two ice caps was first co-registered with ∼1000 ICESat points over ice-free zones. All other DEMs were then 3-D co-registered to the corrected CDED, inde-pendently for each ice cap. Thus, the corrected data sets were all referenced to the WGS84 ellipsoid. To evaluate the consistency of the corrections, the offsets over ice-free ter-rain between each corrected DEM and the corresponding ICESat points were examined. The offset was below 1.5 m in each case, suggesting that the absolute co-registration was well conducted and that the effect of geoid variations (CGVD1928 and EGM96 vs. WGS84) was negligible. How-ever, one must interpret these results with caution given the sparsely distributed and limited number of ICESat points (less than 100) over moderate to hilly terrain.
The two independently co-registered Pléiades DEMs of TNIC (14 and 26 August) were compared in their overlap-ping zone of 84 km2(Fig. 2). The offset measured over the ice-free terrain was−0.1±2.1 (SD) m, while an average el-evation difference of 0.64±2.2 (SD) m was measured over the ice cap, probably due to the thinning between 14 and 26 August. These results confirm the robustness of the 3-D co-registration using the corrected CDED.
4.4 Elevation changes and mass balance calculations 4.4.1 Elevation changes along ICESat and GPS tracks For both Grinnell and Terra Nivea Ice Caps, recent elevation changes were measured between 6 ICESat tracks from differ-ent laser overpass periods (autumn 2003 to winter 2007) and the 2014 Pléiades DEMs. For GRIC only, elevation changes were also calculated between the April 2004 in situ GPS tran-sects and the 2014 Pléiades DEM. We did not attempt to compute glacier-wide volume or mass changes from those recent elevation changes measurements since (1) they are sparse and only cover a small fraction of the two ice caps and (2) the GPS and some of the ICESat data were acquired at the end of winter, and limited data were available to ap-ply a seasonal correction. Nevertheless, those recent eleva-tion changes along selected tracks were used to complement the differential DEM analysis described below.
4.4.2 DEM-derived elevation changes and mass balances
First, the co-registered DEMs were subtracted to obtain maps of elevation changes (dH) and change rates (dH/dt) after dividing by the interval time (dt). The dH values were binned into 50 m elevation bands and averaged after applying a three sigma filter to exclude outliers (Gardner et al., 2012; Gardelle et al., 2013). Pixels with missing data were replaced with the mean dHof the corresponding elevation band. Total volume change for each ice cap (dV) was then determined by summing volume changes from all elevation bands (n) as follows:
dV = n X
i
(1Hi·Ai) , (1)
whereicorresponds to an elevation band of 50 m,1His the mean elevation change measured at elevation bandiandAi is the area of the elevation band. In this calculation, the ice cap hypsometry is based on the 1 : 250 k CDED (1958/59), while the ice cap limit conforms to the year of the oldest DEM used in the calculation. Our own sensitivity tests have shown that the choice of the DEM used has a very low impact on the mass balance calculation (<0.01 m a−1w.e.), as was also demonstrated in Gardner et al. (2011).
The area-averaged change in elevation over the entire ice cap (glacier-wide), dH/dtavg, was then calculated as follows: dH /dtavg= dV
(A·1t ), (2)
where Ais the mean of the initial and final ice cap areas, and1tis the time interval between the two DEMs. Note that dH/dt (elevation change rate from co-registered DEM sub-traction) must be distinguished from dH/dtavg.
Finally, the area-averaged specific geodetic mass balance rate (m a−1w.e.), dM/dt, was calculated as follows:
dM/dt=dH /dtavg·ρ, (3)
whereρis the firn and/or ice density. For the historical mass balance of both ice caps, we used ρ=850 kg m−3 (Huss, 2013), while we used ρ=900 kg m−3 for the recent period on TNIC (2007–2014). The former value ofρ was chosen assuming that there was a firn zone on the ice cap during the last 6 decades, while a visual interpretation of our images (not shown here) suggests the absence of a significant firn zone after 2007. For the sake of readability, the area-averaged specific geodetic mass balance rate (Cogley et al., 2011) is hereafter simply referred to as mass balance or glacier-wide mass balance.
4.4.3 Accuracy assessment
The main sources of uncertainty in our mass balance es-timates are related to uncertainties in the elevation change measurements, the ice cap limits and the density used to con-vert volume to mass changes. For historical measurements,
elevation change uncertainty was assumed equal to the stan-dard deviation over stable terrain between the two coregis-tered DEMs (GRIC 1952–2014: 13.8 m; TNIC 1958–2007: 9.6 m; TNIC 1958–2014: 9 m), assuming that elevation er-rors were 100 % correlated. This is a conservative approach that takes into account both the highly correlated CDED el-evation errors (Gardner et al., 2012) and the possible errors associated to the aerial photos-derived DEM (i.e. artefacts and low coverage at higher altitudes).
Spatial autocorrelation between the ASTER 2007 and Pléiades 2014 DEMs was analyzed on ice-free terrain to bet-ter characbet-terize the elevation change uncertainty in the re-cent mass balance estimation on TNIC. A low autocorrela-tion distance (<100 m) was found between the two elevation products. Applying standard principles of error propagation (e.g. Zemp et al., 2013), we found a very low (±0.1 m) un-certainty for the elevation change averaged over the entire ice cap. Because we consider this value to be likely underes-timated, we conservatively assumed that the uncertainty for the elevation changes was equal to the quadratic sum of the two DEMs uncertainties (±1 m for the Pléiades DEM from Berthier et al. (2014) and±2.5 m for the ASTER DEM from its comparison to ICESat nearly simultaneous on the ice cap), assuming that (1) the elevation errors are fully correlated within each DEM and that (2) errors of the two DEMs are independent.
5 Results
5.1 Area changes
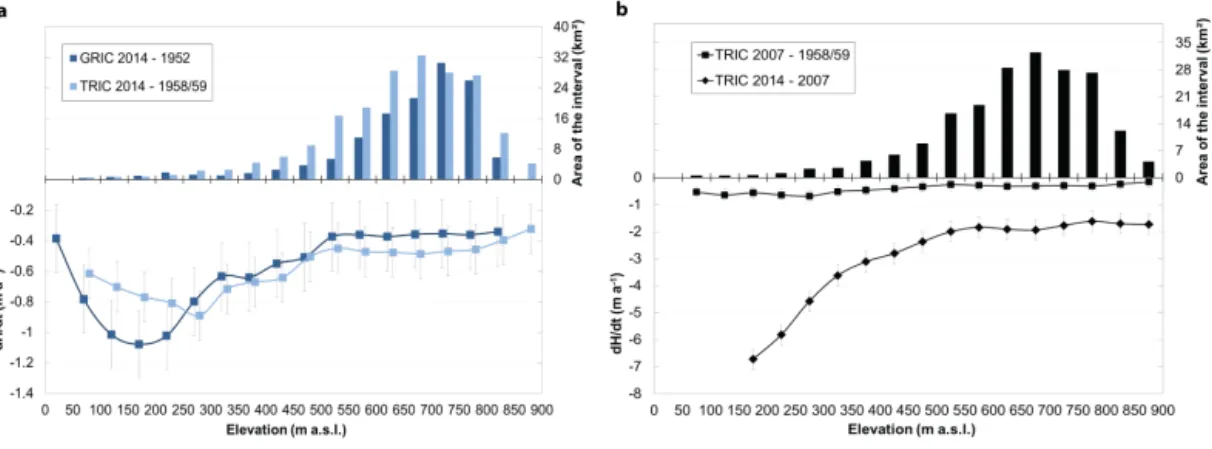
Areal changes measured for Grinnell and Terra Nivea ice caps since the 1950s are shown in Fig. 2. GRIC experi-enced a mean rate of areal change of−0.10±0.01 km2a−1 between 1952 and 1999, whereas a mean rate of −0.59±0.03 km2a−1 is measured for TNIC between 1958/59 and 1998. These rates of area change have been significantly more negative since 1998/99 reaching −1.37±0.04 km2a−1 for GRIC and−1.69±0.05 km2a−1 for TNIC. For GRIC, the 2014 areal extent is about 20 % smaller than in 1952, while TNIC area shrank by 34 % be-tween 1958/59 and 2014.
5.2 Elevation changes
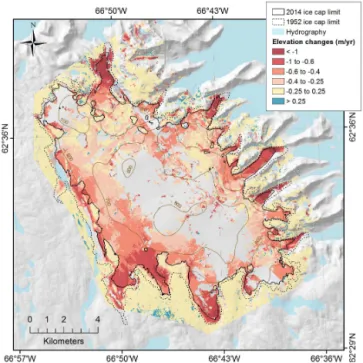
Maps of historical and recent elevation change rates (dH/dt) for the two ice caps are presented in Figs. 3 to 5 (whole ice cap) and Figs. 4 and 6 (changes by elevation).
The glacier-wide rates of elevation change (dH/dtavg) over the period 1952–2014 were −0.44±0.25 m a−1 for GRIC and −0.56±0.19 m a−1 for TNIC. Similar patterns of his-torical dH/dt are observed for both ice caps (Fig. 6 and dH/dt maps), revealing an average surface lowering reach-ing−1.1±0.25 m a−1for GRIC and−0.9±0.19 m a−1for TNIC in the lower altitudes (i.e. the outlet glaciers in the peripheries). Above 250 m a.s.l., the thinning rate was con-sistently 0.1 m a−1more negative for TNIC than GRIC. The surface thinning was similar for all outlet glaciers of GRIC between 1952 and 2014 (Fig. 3), while on TNIC, a stronger lowering (i.e.<−1 m a−1)was experienced on the northeast outlet glaciers between 1958/59–2007 (Fig. 5a).
Elevation change rates sharply increased in recent years for both ice caps. On TNIC, the recent (2007–2014) dH/dtavg was −1.97±0.40 m a−1, a rate ∼5.6 times as negative as the rate of −0.35±0.22 m a−1 measured between 1958/59 and 2007. The acceleration of the thinning rate was particularly pronounced at lowermost elevations (−6.7±0.40 m a−1 between 2007 and 2014 vs.−0.9±0.22 m a−1between 1958/59 and 2007), but was also unambiguously observed in the upper sections of the ac-cumulation area (−1.7±0.40 m a−1between 2007 and 2014 vs.−0.3±0.22 m a−1between 1958/59 and 2007).
On GRIC, changes in dH/dt were evaluated over the pe-riods 1952–2004 and 2004–2014 using overlapping areas of the 1952 DEM, in situ GPS measurements and ICESat tran-sects (2004), and the Pléiades DEM (2014) (Fig. 4). Because of the lack of data about seasonal surface height fluctuations, no correction was applied to account for the different eleva-tion acquisieleva-tion periods of 1952 and 2014 (August) and 2004 (March/April). For the 203 points where elevation measure-ments are available for the 3 years (points superposed with black dots on Fig. 4), the dH/dtwas up to 6 times more
neg-Figure 3.Elevation change rates (m a−1) on Grinnell Ice Cap be-tween August 1952 (Aerial photo DEM) and August 2014 (Pléiades DEM). For this figure as well as for the next ones, no color (i.e. hill-shade is visible) represents no data.
ative over the 2004–2014 period (−1.47 m a−1) than over the 1952–2004 period (−0.25 m a−1).
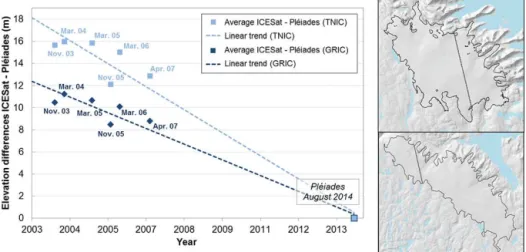
Additionally, elevation changes measured between ICESat repeat track transects and the Pléiades DEMs over both GRIC and TNIC between 2003 and 2014 are shown in Fig. 7. This analysis reveals a similar range of variability of annual ele-vation changes between both ice caps during the 2003–2007 interval and a coherent pattern of seasonal to inter-annual fluctuations. The absolute difference in elevation change be-tween 2003 and 2014 for the two ice caps (total thinning of ∼11 m for GRIC vs.∼16 m for TNIC) is likely to be at least partly explained by the fact that ICESat transects covering GRIC were located at higher altitudes (mean:∼65 m higher) than those over TNIC.
5.3 Mass balances
Table 2.Historical and recent glacier-wide mass balances for both ice caps.
Ice cap Time Data set Data Mass balance
interval voids (m a−1w.e.)
(%)
Grinnell 1952–2014 Photogrammetric DEM and Pléiades DEM 34 −0.37±0.21
Terra Nivea
1958/59–2014 CDED and Pléiades DEM 36 −0.47±0.16
1958/59–2007 CDED and ASTER DEM 21 −0.30±0.19
2007–2014 ASTER DEM and Pléiades DEM 29 −1.77±0.36
Figure 4.Elevation change rates (m a−1) on Grinnell Ice Cap between March/April 2004 (ICESat and in situ GPS points) and August 2014
(Pléiades DEM). Bottom right graph shows historical (1952–2004) and recent (2004–2014) rates of elevation changes along the 203 points contiguous with the 1952 DEM (represented as black dots on the map).
6 Discussion
6.1 Pléiades as a tool for photogrammetric GCPs collection
In many regions of the world, vast archives of historical aerial photographs represent a potential gold mine for glaciologists in order to document multi-decadal volumetric change of glaciers and ice caps (e.g. Soruco et al., 2009; Zemp et al., 2010). DEMs generated from these aerial photographs allows to put the recent glacier variations (satellite era) in a longer-term perspective. However, these data remain difficult to ex-ploit due to the logistical difficulties involved in the field col-lection of accurate and well-distributed GCPs in the remote high latitude/altitude regions. Field GCPs were also lacking for the two ice caps studied here. Instead, we took advantage of the very high resolution of the Pléiades imagery (0.7 m)
Figure 5. (a)Elevation change rates (dH/dt, m a−1) on Terra Nivea Ice Cap (TNIC) between 1958/59 (CDED) and 2007 (ASTER DEM).
(b) dH/dt on TNIC between 1958/59 (CDED) and 2014 (Pléiades DEM).(c)dH/dton TNIC between 2007 (ASTER DEM) and 2014
(Pléiades DEM). Note a different color scale for the lower panel(c).
Figure 7.Recent elevation differences on GRIC and TNIC measured between the Pléiades DEMs (2014) and ICESat altimetric points (2003
to 2007). Only the complete ICESat tracks available for both ice caps were used. The trend lines indicate the mean rate of elevation changes along these two ICESat reference tracks and are∼ −1.1 m a−1for GRIC and∼ −1.6 m a−1for TNIC. Transects location for each ice cap is
shown on the inset maps (top for GRIC and bottom for TNIC).
Figure 8.Representation of the same geomorphological feature on ice-free terrain surrounding GRIC using three different technologies, namely an aerial photography (August 1952), a Pléiades panchromatic band (3 August 2014) and a Landsat 8 panchromatic band (15 Au-gust 2014). Note the very fine resolution of the Pléiades panchromatic band (70 cm), in comparison to the Landsat 8 panchromatic band (15 m), allowing to retrieve bedrocks and ice-free features on archives aerial photos and thus to collect GCPs (e.g. at the bedrock localised by the yellow arrow).
6.2 Comparison to other studies
Our estimates of shrinkage for GRIC and TNIC can be com-pared with other studies from Baffin Island to verify the co-herence of results and get a more complete picture of the pattern of glacier changes across this vast region.
Sharp et al. (2014) reported rates of areal change for TNIC of up to −0.66 km2a−1 (197 to 169 km2) between 1958 and 2000, while our own results give a nearly iden-tical figure of −0.59±0.03 km2a−1 (196.2±9.9 km2 to 173.2±8.5 km2) over this similar period. For GRIC, how-ever, the shrinkage rate of−0.36 km2a−1(135 to 120 km2) reported by Sharp et al. (2014) over the period 1958–2000 is nearly 4 times more negative than our own figure of
Gardner et al. (2012) estimated that the average mass loss rate of all glaciers and ice caps on southern Baffin Island (South of 68.6◦N, excluding Penny Ice Cap) increased from −0.20±0.05 m a−1w.e. to −0.76±0.12 m a−1w.e. (i.e. a factor of 4) between the periods 1957–2006 and 2003–2009. This acceleration is more than twice that estimated over sim-ilar periods for northern Baffin Island glaciers (North of 68.6◦N, excluding Barnes Ice Cap). Barnes Ice Cap itself, lo-cated on central Baffin Island at elevations between 400 and 1100 m a.s.l., recently experienced a strong thinning acceler-ation (Sneed et al., 2008; Dupont et al., 2012), resulting in a mass loss rate of −1.08±0.12 m a−1w.e. between 2005 and 2011 (Gardner et al., 2012). The estimated mass loss rate on Penny Ice Cap between 2003 and 2009 is lower, at −0.52±0.12 m a−1w.e., a difference which Gardner et al. (2012) attribute to its much higher elevation range (up to∼2000 m a.s.l.). The comparatively large mass loss rates experienced by GRIC and TNIC in the past half-century can be ascribed to differences in size and to the hypsometry of the ice caps, but also possibly to local climatic factors, as described below.
6.3 Regional context and climatic factors
The accelerating recession of glaciers and ice caps across the CAA in recent decades, and the concurrent increase in sur-face melt over the Greenland Ice Sheet, have been ascribed to a sustained atmospheric pressure and circulation pattern that favors the advection of warm air from the northwest Atlantic into the eastern Arctic and over western Greenland (Sharp et al., 2011; Fettweis et al., 2013). This situation has led to warmer, longer summer melt periods on glaciers of the eastern CAA, and this largely accounts for their increasingly negative mass balance (Weaver, 1975; Hooke et al., 1987; Koerner, 2005; Sneed et al., 2008; Gardner and Sharp, 2007; Gardner et al., 2012).
In the southern Baffin Island region, annual and sea-sonal mean air temperatures have generally increased since 1948 (except in the spring), but not monotonically (Vin-cent et al., 2015). At Iqaluit, seasonal trends from 1948 to ∼1990 were non-significant or slightly negative (spring). Thereafter, temperatures rose, particularly in autumn (SON; +0.8◦C decade−1) and winter (DJF; +2.9◦C decade−1), both of these trends being significant at the 95 % level (p <0.05), even when autocorrelation is accounted for (Ebisuzaki, 1997). Climate records from stations further south (e.g. Resolution Island, 61.5◦N) are unfortunately too discontinuous to allow quantification of temperature trends on Meta Incognita Peninsula, but these are probably close to those observed in Iqaluit. Although GRIC and TNIC are only separated by 17 km, they did not experience the same historical and recent rates of shrinkage and mass loss (see the Sect. 5), and part of the difference is likely due to differ-ences in hypsometry, which strongly infludiffer-ences the response of glaciers to a given climate forcing (Oerlemans et al., 1998;
Davies et al., 2012; Hannesdóttir et al., 2015). GRIC lies at a slightly higher altitude than TNIC, with 77 % of its area above 600 m a.s.l., compared to 68 % for the TNIC, and is therefore expected to have a slightly less negative mass bal-ance, as our observations confirm.
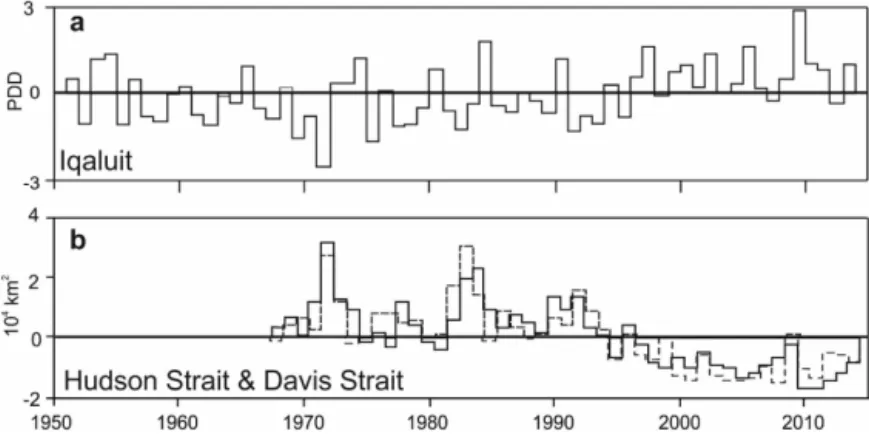
Figure 9. (a)Annual anomalies in total positive degree-days (PDD) recorded from April to November at the Iqaluit weather station, 1952 to 2014, based on Homogenized Canadian Historical Climate Data (Vincent et al., 2015).(b)Anomalies in total sea-ice covered area during
the summer and autumn (25 June–19 November) over Hudson Strait (full line) and Davis Strait (dashed line), 1968–2014. Data provided by the Canadian Ice Service. For region boundaries, see Tivy et al. (2011), Fig. 4.
two glacierized sectors of Baffin Island respond to regional warming in different ways.
7 Conclusions
This paper highlighted historical and recent trends in area, elevation and mass changes for the two southernmost ice caps of the Canadian Arctic Archipelago, Grinnell and Terra Nivea Ice Caps. Our analysis is based on multiple data sets and uses an original approach where ground control points for the photogrammetric processing of old aerial pho-tographs are derived from sub-meter resolution Pléiades satellite stereo-images. This approach takes full advantage of the highly precise Pléiades products and represents an im-portant advance for eventually unlocking the vast archives of historical aerial photographs.
Results show that the areal extent of TNIC is 34 % smaller in 2014 when compared to the end of the 1950’s extent, while GRIC shrank by nearly 20 % between 1952 and 2014. Both ice caps also experienced an acceleration of their shrinkage rates since the beginning of the 21st century.
The historical glacier-wide mass balance for GRIC was estimated to be −0.37±0.21 m a−1w.e. (1952– 2014) and slightly more negative for TNIC at −0.47±0.16 m a−1w.e. (1958/59–2014). Between 2007 and 2014, the mass balance of TNIC was of −1.77±0.36 m a−1w.e., a rate 5.9 as negative as the mass balance of−0.30±0.19 m a−1w.e. measured between 1958/59 and 2007. This is also twice as negative as the average mass balance obtained between 2003 and 2009 for other larger ice caps in the southern part of Baffin Island (Gardner et al., 2012).
The 2007–2014 mass balance of TNIC is among the most negative multi-annual glacier-wide mass balances measured to date, comparable to other negative values observed in the southern mid-latitudes (e.g. Willis et al., 2012; Berthier et al.,
2009) or in southeast Alaska (Trüssel et al., 2013). Given the absence of calving glaciers for TNIC, its high rate of mass loss can only be explained by negative surface mass balance due to an ELA that, for most years, is above the maximum ice cap altitude. Nonetheless, this similarity in rate of mass loss underlines the strong sensitivity of maritime low-elevation ice bodies to the currently observed climate change at mid-latitudes and in polar regions (Hock et al., 2009). The recent acceleration of ice cap wastage on Meta Incognita Peninsula is linked to a strong near-surface regional warming and a lengthening of the melt season into the autumn that may be reinforced by sea ice cover reduction and later freeze-up in Hudson Strait and nearby marine areas.
Acknowledgements. This paper is dedicated to Gunnar Østrem (PhD Stockholm Univ., 1965) a tireless pioneer in the study of mountain and Arctic glaciers across Canada, who surveyed GRIC in the early 1990s. Charles Papasodoro acknowledges support from the Fond Québécois de Recherche en Nature et Technologies (FQRNT) fellowship program and the Centre d’Études Nordiques (CEN) for an internship at LEGOS (Toulouse, France). The 2003-04 field surveys on GRIC were conducted with the able assistance of J.C. Lavergne and C. Kinnard, and logistical support from the Geological Survey of Canada, the Polar Continental Shelf Project, and the Nunavut Research Institute. D. Scott, F. Savopol, C. Armenakis and P. Sauvé (Geomatics Canada) assisted with the GPS data reduction back in 2004. This research was supported by the Natural Sciences and Engineering Research Council of Canada, by the French Space Agency (CNES) through the ISIS and TOSCA programs (Pléiades data) and by the Geological Survey of Canada (field campaign). ASTER and Landsat data were obtained free of charge thanks respectively to the GLIMS program (NSIDC) and USGS.
References
Andrews, J. T., Holdsworth, G., and Jacobs, J. D.: Glaciers of the Arctic Islands. Glaciers of Baffin Island, USGS Professional Pa-per 1386-J-1, USGS, J162–J198, 2002.
Astrium: Pléiades Imagery User Guide, Airbus Defence and Space, Geo-Information Services, Toulouse, 2012.
Barrand, N. E., Murray, T., James, T. D., Barr, S. L., and Mills, J. P.: Instruments and Methods Optimizing photogrammetric DEMs for glacier volume change assessment using laser-scanning de-rived ground-control points, J. Glaciol., 55, 106–116, 2009. Berthier, E. and Toutin, T.: SPOT5-HRS digital elevation models
and the monitoring of glacier elevation changes in North-West Canada and South-East Alaska, Remote Sens. Environ., 112, 2443–2454, doi:10.1016/j.rse.2007.11.004, 2008.
Berthier, E., Le Bris, R., Mabileau, L., Testut, L., and Rémy, F.: Ice wastage on the Kerguelen Islands (49◦S, 69◦E)
between 1963 and 2006, J. Geophys. Res., 114, F03005, doi:10.1029/2008JF001192, 2009.
Berthier, E., Vincent, C., Magnússon, E., Gunnlaugsson, Á. Þ., Pitte, P., Le Meur, E., Masiokas, M., Ruiz, L., Pálsson, F., Be-lart, J. M. C., and Wagnon, P.: Glacier topography and eleva-tion changes derived from Pléiades sub-meter stereo images, The Cryosphere, 8, 2275–2291, doi:10.5194/tc-8-2275-2014, 2014. Blake, W.: Studies of the Grinnell Glacier, Baffin Island, Arctic, 6,
167, 1953.
Cogley, J. G., Hock, R., Rasmussen, L. A., Arendt, A. A., Bauder, A., Braithwaite, R. J., Jansson, P., Kaser, G., Möller, M., Nichol-son, L., and Zemp, M.: Glossary of Glacier Mass Balance and Related Terms, IHP-VII Technical Documents in Hydrology No. 86, IACS Contribution No. 2, UNESCO-IHP, Paris, 114 pp., 2011.
Comiso, J. C. and Hall, D. K.: Climate trends in the Arctic as ob-served from space, Wiley Interdiscip. Rev. Clim. Change, 5, 389– 409, doi:10.1002/wcc.277, 2014.
Das, I., Hock, R., Berthier, E. and Lingle, C. S.: 21st-century in-crease in glacier mass loss in the Wrangell Mountains, Alaska, USA, from airborne laser altimetry and satellite stereo imagery, J. Glaciol., 60, 283–293, doi:10.3189/2014JoG13J119, 2014. Davies, B. J., Carrivick, J. L., Glasser, N. F., Hambrey, M. J., and
Smellie, J. L.: Variable glacier response to atmospheric warm-ing, northern Antarctic Peninsula, 1988–2009, The Cryosphere, 6, 1031–1048, doi:10.5194/tc-6-1031-2012, 2012.
Dowdeswell, J.: Debris transport paths and sediment flux through the Grinnell ice cap, Frobisher Bay, Baffin Island, N. W. T., Canada, unpublished MA Thesis, University of Colorado, Boul-der, Colorado, 169 pp., 1982.
Dowdeswell, J.: Late Quaternary Chronology for Watts Bay Area, Frobisher Bay, Southern Baffin Island, N. W. T., Canada, Arct. Alp. Res., 16 311–320, 1984.
Dunlap, E., DeTracey, B. M., and Tang, C. C. L.: Short-wave ra-diation and sea ice in Baffin Bay, Atmos,-Ocean, 45, 195–210, doi:10.3137/ao.450402, 2007.
Dupont, F., Royer, A., Langlois, A., Gressent, A., Picard, G., Fily, M., Cliche, P., and Chum, M.: Monitoring the melt season length of the Barnes Ice Cap over the 1979–2010 period using active and passive microwave remote sensing data, Hydrol. Process., 26, 2643–2652, doi:10.1002/hyp.9382, 2012.
Ebisuzaki, W.: A method to estimate the statistical significance of a correlation when the data are serially correlated, J. Climate, 2, 2147–2153, 1997.
Fox, J. A. and Nuttall, A.-M.: Photogrammetry as a research tool, Photogram. Record, 15, 725–737, 1997.
Fettweis, X., Hanna, E., Lang, C., Belleflamme, A., Erpicum, M., and Gallée, H.:Brief communication“Important role of the mid-tropospheric atmospheric circulation in the recent surface melt increase over the Greenland ice sheet”, The Cryosphere, 7, 241– 248, doi:10.5194/tc-7-241-2013, 2013.
Fujisada, H., Bailey, G. B., Kelly, G. G., Hara, S., and Abrams, M. J.: ASTER DEM performance, IEEE T. Geosci. Remote, 43, 2707–2714, doi:10.1109/TGRS.2005.847924, 2005.
Gardelle, J., Berthier, E., Arnaud, Y., and Kääb, A.: Region-wide glacier mass balances over the Pamir–Karakoram–Himalaya dur-ing 1999–2011, The Cryosphere, 7, 1263–1286, doi:10.5194/tc-7-1263-2013, 2013.
Gardner, A. S. and Sharp, M.: Influence of the Arctic Circumpolar Vortex on the Mass Balance of Canadian High Arctic Glaciers, J. Climate, 20, 4586–4598, doi:10.1175/JCLI4268.1, 2007. Gardner, A. S., Moholdt, G., Wouters, B., Wolken, G. J., Burgess,
D. O., Sharp, M. J., Cogley, J. G., Braun, C., and Labine, C.: Sharply increased mass loss from glaciers and ice caps in the Canadian Arctic Archipelago, Nature, 473, 357–360, doi:10.1038/nature10089, 2011.
Gardner, A., Moholdt, G., Arendt, A., and Wouters, B.: Accelerated contributions of Canada’s Baffin and Bylot Island glaciers to sea level rise over the past half century, The Cryosphere, 6, 1103– 1125, doi:10.5194/tc-6-1103-2012, 2012.
Gardner, A. S., Moholdt, G., Cogley, J. G., Wouters, B., Arendt, A., Wahr, J., Berthier, E., Hock, R., Pfeffer, W. T., Kaser, G., Ligtenberg, S. R. M., Bolch, T., Sharp, M. J., Hagen, J. O., van den Broeke, M. R., and Paul, F.: A reconciled estimate of glacier contributions to sea level rise: 2003 to 2009, Science, 340, 852– 857, doi:10.1126/science.1234532, 2013.
Hannesdóttir, H., Björnsson, H., Pálsson, F., Aðalgeirsdóttir, G. and Guðmundsson, S.: Changes in the southeast Vatnajökull ice cap, Iceland, between∼1890 and 2010, The Cryosphere, 9, 565–585,
doi:10.5194/tc-9-565-2015, 2015.
Hocheim, K. P. and Barber, D. G.: An update on the ice climatology of the Hudson Bay system, Arct. Antarc. Alp. Res., 46, 66–83, 2014.
Hock, R., de Woul, M., Radi´c, V., and Dyurgerov, M.: Moun-tain glaciers and ice caps around Antarctica make a large sea-level rise contribution, Geophys. Res. Lett., 36, L07501, doi:10.1029/2008GL037020, 2009.
Hooke, R. L., Johnson, G. W., Brugger, K. A., Hanson, B., and Holdsworth, G.: Changes in mass balance, velocity, and surface profile along a flow line on Barnes Ice Cap, 1970–1984, Can. J. Earth Sci., 24, 1550–1561, 1987.
Huss, M.: Density assumptions for converting geodetic glacier volume change to mass change, The Cryosphere, 7, 877–887, doi:10.5194/tc-7-877-2013, 2013.
Kääb, A.: Glacier volume changes using ASTER satellite stereo and ICESat GLAS laser altimetry. A test study on Edgeøya, Eastern Svalbard, IEEE T. Geosci. Remote, 46, 2823–2830, 2008. Koerner, R. M.: Mass balance of glaciers in the Queen Elizabeth
Marti, R., Gascoin, S., Houet, T., Ribière, O., Laffly, D., Con-dom, T., Monnier, S., Schmutz, M., Camerlynck, C., Tihay, J. P., Soubeyroux, J. M., and René, P.: Evolution of Ossoue Glacier (French Pyrenees) since the end of the Little Ice Age, The Cryosphere Discuss., 9, 2431–2494, doi:10.5194/tcd-9-2431-2015, 2015.
Matsoukas, C., Hatzianastassiou, N., Fotiadi, A., Pavlakis, K. G., and Vardavas, I.: The effect of Arctic sea-ice extent on the absorbed (net) solar flux at the surface, based on ISCCP-D2 cloud data for 1983–2007, Atmos. Chem. Phys., 10, 777–787, doi:10.5194/acp-10-777-2010, 2010.
Mercer, J. H.: The physiography and glaciology of southernmost of Baffin Island, unpublished PhD Thesis, McGill University, Mon-treal, Canada, p. 150, 1954.
Mercer, J. H.: The Grinnell and Terra Nivea ice caps, J. Glaciol., 19, 653–656, doi:10.3189/002214356793701910, 1956.
Muller, D. S.: Glacial geology and Quaternary history of southeast Meta Incognita Peninsula, Baffin Island, Canada, MS thesis, Uni-versity of Colorado, Boulder, Colorado, 211 pp., 1980.
Nuth, C. and Kääb, A.: Co-registration and bias corrections of satel-lite elevation data sets for quantifying glacier thickness change, The Cryosphere, 5, 271–290, doi:10.5194/tc-5-271-2011, 2011. Oerlemans, J., Anderson, B., Hubbard, A., Huybrechts, P.,
Johan-nesson, T., Knap, W. H., Schmeits, M., Stroeven, A. P., van de Wal, R. S. W., Wallinga, J., and Zuo, Z.: Modelling the response of glaciers to climate warming, Clim. Dynam., 14, 267–274, 1998.
Paul, F., Barrand, N. E., Baumann, S., Berthier, E., Bolch, T., Casey, K., Frey, H., Joshi, S. P., Konovalov, V., Bris, R. Le, Mölg, N., Nosenko, G., Nuth, C., Pope, A., Racoviteanu, A., Rastner, P., Raup, B., Scharrer, K., Steffen, S., and Winsvold, S.: On the accuracy of glacier outlines derived from remote-sensing data, Ann. Glaciol., 54, 171–182, doi:10.3189/2013AoG63A296, 2013.
PCI Geomatics: OrthoEngine User Guide, Richmond Hill, Ontario, Canada, 2013.
Pelto, M. S.: Forecasting temperate alpine glacier survival from accumulation zone observations, The Cryosphere, 4, 67–75, doi:10.5194/tc-4-67-2010, 2010.
Pfeffer, W. T., Arendt, A. A., Bliss, A., Bolch, T., Cogley, J. G., Gardner, A. S., Hagen, J.-O., Hock, R., Kaser, G., Kienholz, C., Miles, E. S., Moholdt, G., Mölg, N., Paul, F., Radi´c, V., Rastner, P., Raup, B. H., Rich, J., Sharp, M. J. and the Ran-dolph consortium: The RanRan-dolph Glacier Inventory: a glob-ally complete inventory of glaciers, J. Glaciol., 60, 537–552, doi:10.3189/2014JoG13J176, 2014.
Schutz, B. E., Zwally, H. J., Shuman, C. A., Hancock, D., and Di-Marzio, J. P.: Overview of the ICESat Mission, Geophys. Res. Lett., 32, L21S01, doi:10.1029/2005GL024009, 2005.
Sharp, M., Burgess, D. O., Cogley, J. G., Ecclestone, M., Labine, C., and Wolken, G. J.: Extreme melt on Canada’s Arctic ice caps in the 21st century, Geophys. Res. Lett., 38, L11501, doi:10.1029/2011GL047381, 2011.
Sharp, M., Burgess, D. O., Cawkwell, F., Copland, L., Davis, J. A., Dowdeswell, E. K., Dowdeswell, J. A., Gardner, A. S., Mair, D., Wang, L., Williamson, S. N., Wolken, G. J., and Wyatt, F.: Recent glacier changes in the Canadian Arctic, in: Global Land Ice Measurements from Space: Satellite Multispectral Imaging
of Glaciers, edited by: Kargel, J. S., Bishop, M. P., Kaab, A., Raup, B. H., and Leonard, G., Springer-Praxis, 205–228, 2014. Sneed, W. A., Hooke, R. L., and Hamilton, G. S.: Thinning of the
south dome of Barnes Ice Cap, Arctic Canada, over the past two decades, Geology, 36, 71–74, doi:10.1130/G24013A.1, 2008. Soruco, A., Vincent, C., Francou, B., and Gonzalez, J. F.: Glacier
decline between 1963 and 2006 in the Cordillera Real, Bolivia, Geophys. Res. Lett., 36, L03502, doi:10.1029/2008GL036238, 2009.
Tingley, M. P. and Huybers, P.: Recent temperature extremes at high northern latitudes unprecedented in the past 600 years, Nature, 496, 201–205, doi:10.1038/nature11969, 2013.
Tivy, A., Howell, E. L., Alt, B., McCourt, S., Chagnon, R., Crocker, G., Carrieres, T., and Yackel, J. J.: Trends and variability in sum-mer sea ice cover in the Canadian Arctic based on the Canadian Ice Service Digital Archive, 1960–2008 and 1968–2008, J. Geo-phys. Res., 116, C03007, doi:10.1029/2009JC005855, 2011. Trüssel, B. L., Motyka, R. J., Truffer, M., and Larsen, C. F.: Rapid
thinning of lake-calving Yakutat Glacier and the collapse of the Yakutat Icefield, southeast Alaska, USA, J. Glaciol., 59, 149– 161, doi:10.3189/2013J0G12J081, 2013.
Vaughan, D. G., Comiso, J. C., Allison, I., Carrasco, J., Kaser, G., Kwok, R., Mote, P., Murray, T., Paul, F., Ren, J., Rig-not, E., Solomina, O., Steffen, K., and Zhang, T.: Observations: Cryosphere, in: Climate Change 2013: The Physical Science Ba-sis, Contribution of Working Group I to the Fifth Assessment Re-port of the Intergovernmental Panel on Climate Change, edited by: Stocker, T. F., Qin, D., Plattner, G.-K., Tignor, M., Allen, S. K., Boschung, J., Nauels, A., Xia, Y., Bex, V., and Midgley, P. M., Cambridge University Press, Cambridge, UK and New York, NY, USA, 317–382, 2013.
Vincent, L. A., Zhang, X., Bonsal, B. R., and Hogg, W. D.: Ho-mogenization of daily temperatures over Canada, J. Climate, 15, 1322–1334, 2002.
Vincent, L. A., Zhang, X. Brown, R., Feng, Y., Mekis, E., Milewska, E., Wan, H., and Wang, X.: Observed trends in Canada’s climate and influence of low frequency variability modes, J. Climate, 28, 4545–4560, 2015.
Wagnon, P., Vincent, C., Arnaud, Y., Berthier, E., Vuillermoz, E., Gruber, S., Ménégoz, M., Gilbert, A., Dumont, M., Shea, J. M., Stumm, D., and Pokhrel, B. K.: Seasonal and annual mass balances of Mera and Pokalde glaciers (Nepal Himalaya) since 2007, The Cryosphere, 7, 1769–1786, doi:10.5194/tc-7-1769-2013, 2013.
Way, R.: Multidecadal Recession of Grinnell and Terra Nivea Ice Caps, Baffin Island, Canada, Arctic, 68, 45–53, doi:10.14430/arctic4461, 2015.
Weaver, R. L.: “Boas” Glacier (Baffin Island, N. W. T., Canada) mass balance for the five budget years 1969 to 1974, Arct. Alp. Res., 7, 279–284, 1975.
Willis, M. J., Melkonian, A. K., Pritchard, M. E., and Rivera, A.: Ice loss from the Southern Patagonian Ice Field, South Amer-ica, between 2000 and 2012, Geophys. Res. Lett., 39, L17501, doi:10.1029/2012GL053136, 2012.
Zdanowicz, C.: Glacier-climate studies on Grinnell ice cap – Final research report, Nunavut Research Institute, National Glaciology Program, Geological Survey of Canada, Ottawa, Canada, 2007. Zemp, M., Jansson, P., Holmlund, P., Gärtner-Roer, I., Koblet,
T., Thee, P., and Haeberli, W.: Reanalysis of multi-temporal aerial images of Storglaciären, Sweden (1959–99) – Part 2: Comparison of glaciological and volumetric mass balances, The Cryosphere, 4, 345–357, doi:10.5194/tc-4-345-2010, 2010.
Zemp, M., Thibert, E., Huss, M., Stumm, D., Rolstad Denby, C., Nuth, C., Nussbaumer, S. U., Moholdt, G., Mercer, A., Mayer, C., Joerg, P. C., Jansson, P., Hynek, B., Fischer, A., Escher-Vetter, H., Elvehøy, H., and Andreassen, L. M.: Reanalysing glacier mass balance measurement series, The Cryosphere, 7, 1227– 1245, doi:10.5194/tc-7-1227-2013, 2013.