MODIS snow cover mapping accuracy in a small mountain
catchment – comparison between open and forest sites
J. Parajka1, L. Holko2, Z. Kostka2, and G. Bl¨oschl1
1Institute of Hydraulic Engineering and Water Resources Management, Vienna University of Technology, Vienna, Austria 2Institute of Hydrology, Slovak Academy of Sciences, Liptovsk´y Mikul´aˇs, Slovakia
Correspondence to:J. Parajka ([email protected])
Received: 7 March 2012 – Published in Hydrol. Earth Syst. Sci. Discuss.: 28 March 2012 Revised: 21 June 2012 – Accepted: 6 July 2012 – Published: 30 July 2012
Abstract.Numerous global and regional validation studies have examined MODIS snow mapping accuracy by using measurements at climate stations, which are mainly at open sites. MODIS accuracy in alpine and forested regions is, however, still not well understood. The main objective of this study is to evaluate MODIS (MOD10A1 and MYD10A1) snow cover products in a small experimental catchment by using extensive snow course measurements at open and for-est sites. The MODIS accuracy is tfor-ested in the Jalovecky creek catchment (northern Slovakia) in the period 2000– 2011. The results show that the combined Terra and Aqua im-ages enable snow mapping at an overall accuracy of 91.5 %. The accuracies at forested, open and mixed land uses at the
ˇ
Cervenec sites are 92.7 %, 98.3 % and 81.8 %, respectively. The use of a 2-day temporal filter enables a significant re-duction in the number of days with cloud coverage and an increase in overall snow mapping accuracy. In total, the 2-day temporal filter decreases the number of cloudy 2-days from 61 % to 26 % and increases the snow mapping accuracy to 94 %. The results indicate three possible factors leading to misclassification of snow as land: patchy snow cover, lim-ited MODIS geolocation accuracy and mapping algorithm errors. Out of a total of 27 misclassification cases, patchy snow cover, geolocation issues and mapping errors occur in 12, 12 and 3 cases, respectively.
1 Introduction
Snow pack is an important storage reservoir of water in many regions of the world, especially in mountains. Monitoring of its spatial and temporal changes provides essential
infor-mation for water resources management and predictions of snowmelt runoff. Numerous applications of remote sensing products in the past have demonstrated that satellite images of snow cover are an attractive alternative to ground observa-tions (Parajka and Bl¨oschl, 2012).
deciduous forest, herb-dominated and lichen land cover type. The lowest MODIS accuracy was found for the evergreen forest class, with a minimum of 80 % accuracy in April. This is somewhat smaller than the expected global mini-mum accuracy of 85 % reported by the MODIS documen-tation (MODIS, 2010). The results of Simic et al. (2004) indicated a clear tendency of MODIS to overestimate snow cover extent in the evergreen forest. Similar findings were indicated by a modeling study of Nester et al. (2012). They evaluated a snow routine of an operational flood forecasting model in the alpine part of the Danube river and reported a tendency of MODIS to map more snow than was simu-lated by the hydrologic model in forested areas. Parajka and Bl¨oschl (2006) examined the MODIS accuracy at 754 cli-mate stations in Austria and used dominant land cover in-formation as an indicator of possible tendencies in MODIS errors. Their results indicated that the largest mapping errors occurred on pastures and shrub land. The mean misclassifi-cation error for the shrub class was around 10 %, for pastures and forest it was around 6 %. Recently, Roy et al. (2010) examined MODIS mapping accuracy as a function of tree canopy cover. The tree canopy cover was estimated by using the MODIS Vegetation Continuous Fields dataset (Hansen et al., 2003), which indicates the proportions of cover types such as woody vegetation, herbaceous vegetation and bare ground in each MODIS pixel. The results showed a general tendency of increasing mapping errors with increasing for-est cover. The MODIS underfor-estimation dominated at lower canopy cover, while the overestimation of snow cover was observed for tree canopy cover between 60 and 80 %.
The objective of this paper is to assess the accuracy of MODIS snow cover mapping in a mountain forested environ-ment relative to open sites based on extensive snow course measurements. It is anticipated that a decade of snow obser-vations in a well documented experimental catchment may give general insights into the efficiency and accuracy of the MODIS snow cover dataset in forested mountain regions.
2 Data
2.1 Study area
The MODIS accuracy is tested in Jalovecky creek ment (Fig. 1). This catchment is an experimental catch-ment of the Institute of Hydrology, Slovak Academy of Sci-ences. It is situated in northern Slovakia, in the highest part of the Carpathian Mountains. Catchment size is 22.2 km2 and elevation ranges between 820 and 2178 m a.s.l. (Fig. 2). The mean catchment elevation is 1500 m a.s.l. Catchment mean annual precipitation is 1550 mm, mean annual runoff is 1015 mm and mean annual air temperature at catchment mean elevation is 3.5◦
C. The lower part of the catchment is forested. The forest line reaches approximately 1400 m a.s.l. The forest is dominated by spruce and dwarf pine, which
Fig. 1. View to the highest part of the Jaloveck´y creek catch-ment (upper panel), climate station and snow course locations at
ˇ
Cervenec (bottom left panel) and snow measurement in the forest (bottom right panel).
cover 44 and 31 % of the catchment, respectively (Holko and Kostka, 2010). The rest of the catchment is covered by alpine meadows and bare rocks. Since the catchment is situated in a national park, forestry activities are restricted. Most of the forest (70 %) is older than 110 yr, and about 18 % of the for-est is 50–80 yr old. The stand density (i.e. a measure of the degree of stem crowding within a stand) varies between 0.05 and 15.21 (Kostka and Holko, 1997). Most of the forest has stand density of 0.7.
Fig. 2.Topography (screenshot from Google Earth left, digital elevation model right) and location of snow course profiles in the Jalovecky creek catchment. Measurements in the forest and open areas are indicated by green and yellow color, respectively. The blue symbol indicates the position of the reference profile at ˇCervenec station (49◦11′15′′N, 19◦38′32′′E).
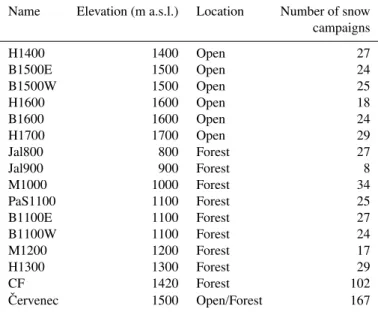
Table 1.Number and location of snow measurements at each snow profile in the period 2000–2011.
Name Elevation (m a.s.l.) Location Number of snow campaigns
H1400 1400 Open 27
B1500E 1500 Open 24
B1500W 1500 Open 25
H1600 1600 Open 18
B1600 1600 Open 24
H1700 1700 Open 29
Jal800 800 Forest 27
Jal900 900 Forest 8
M1000 1000 Forest 34
PaS1100 1100 Forest 25
B1100E 1100 Forest 27
B1100W 1100 Forest 24
M1200 1200 Forest 17
H1300 1300 Forest 29
CF 1420 Forest 102
ˇ
Cervenec 1500 Open/Forest 167
out every two weeks during snow accumulation and weekly or more frequently during the snowmelt period. Snow depth and SWE are measured at ˇCervenec along 3 snow course pro-files (i.e. 60 snow depth and 3 SWE measurements). The lo-cation of ˇCervenec station is specific in that the snow profiles represent open site conditions, but in the surrounding area representing MODIS pixel size, the forest cover is approxi-mately 40–50 % (Fig. 3).
Fig. 3. Location and vegetation coverage near ˇCervenec station (screenshot from Google Earth). The blue polygon indicates the size and position of the MODIS pixel.
2.2 MODIS snow cover
descending mode for the Terra and approximately 01:30 p.m. in an ascending mode for the Aqua satellite. In this study, daily datasets from Terra (MOD10A1, V005) and Aqua (MYD10A1, V005) are used. The spatial resolution of the products is 500 m, and the geolocation accuracy is about 45–60 m (George Riggs, personal communication, also see Wolfe et al., 1998, 2002). Our study catchment is covered by the h19v04 MODIS tile. The original MODIS dataset was reprojected into conformal conic projection used in Slovakia by using MODIS Reprojection Tool (MRT, 2011).
The mapping of snow cover by using optical sensors is limited in areas where snow cover is obscured by clouds and dense forest canopies (Hall et al., 2001). In the MODIS prod-ucts, a mapping of snow in forested locations is based upon a combination of vegetation and snow indices (Klein et al., 1998; Hall et al., 2001). The Normalized Difference Snow Index (NDSI) allows us to distinguish snow from many other surface features such as clouds that have high reflectance in both the visible and the short-wave infrared part of the spec-trum (Hall et al., 1998). Application of the Normalized Dif-ference Vegetation Index (NDVI) allows for the use of dif-ferent NDSI thresholds for forested and non-forested pixels without compromising the algorithm performance for other land cover types. However, such a mapping approach can only be applied to the Terra data. The NDSI/NDVI test for snow in vegetated areas was disabled for Aqua imagery, be-cause the use of band 7 resulted in too much false snow detection (Hall et al., 2006). The maximum monthly errors are expected to range from 5 percent to 9 percent for North America, and from 5 percent to 10 percent for Eurasia. The maximum aggregated Northern Hemisphere snow mapping error is estimated to be 7.5 percent. The error is highest, around 9 percent to 10 percent, when snow covers boreal for-est roughly between November and April (Hall et al., 2001). In order to reduce the effects of clouds, the methodology proposed in Parajka and Bl¨oschl (2008) is applied in this study. It includes the combination of Terra and Aqua im-ages and a 2-day temporal filter for snow cover mapping. The combination of Terra and Aqua merges the two MODIS snow cover products on a pixel basis. The pixels classified as clouds in the Terra images are updated by the Aqua pixel value of the same location if the Aqua pixel is snow or land. This approach combines observations on the same day, shifted by several hours. The additional 2-day temporal fil-ter replaces cloud pixels in the combined images by the most recent preceding non-cloud observations at the same pixel within a predefined 2-day temporal window.
3 MODIS accuracy assessment
The accuracy of the MODIS snow cover product is quanti-tatively evaluated by using snow course (ground) measure-ments. Snow observations along the transects are considered as ground truth for the pixel that is closest to the location
Table 2.Confusion matrix defining the snow mapping accuracy (SI) by relating the ground-based snow depth observations (Ground) and the satellite snow cover from MODIS.AandBrepresent the num-ber of cloud-free station days in a particular classification category.
Sum of station days MODIS: SNOW MODIS: NO-SNOW
Ground: SNOW A B
Ground: NO-SNOW – –
of the snow measurements. If ground SWE measurement is larger than zero, the pixel is considered as snow covered. In the MODIS validation, only the snow cover mapping accu-racy is assessed. The exact information on when snow dis-appeared is not available, so the snow cover mapping accu-racy index (SI) relates the sum of station days with correctly mapped snow to the sum of correctly (A) and falsely (B) mapped snow cover by MODIS:
SI= A
(A+B)·100 (1)
whereAandB represent the number of cloud-free ground observations in a particular classification category as of Ta-ble 2.
4 Results
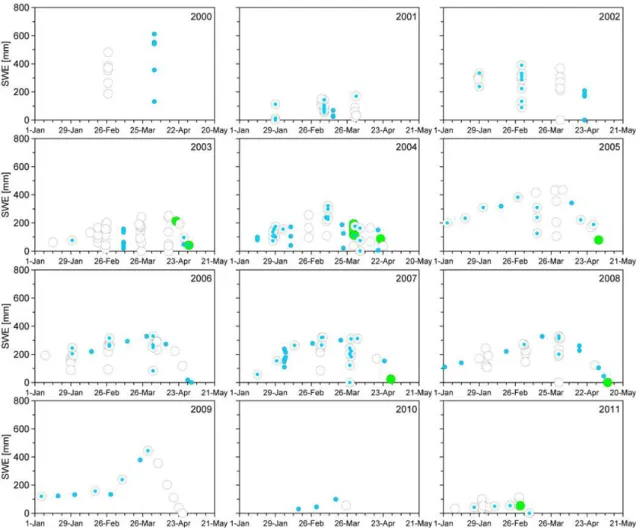
Fig. 4.Snow water equivalent (SWE) observations at open sites and MODIS classification at the respective pixels in individual snow seasons (2000–2011). Colors indicate MODIS snow (white), land (green) and cloud (blue) classifications. Overlapping of smaller (cloud) with larger (snow or land) symbols indicates the information is from the MODIS 2-day filter instead of the original cloud classification by MODIS for that day.
measurements (564 and 595 mm) in January 2002. Figure 5 displays the sequence of MODIS images for both cases. The top panels (Fig. 5) present the end of the snowmelt season in May 2001. The MODIS images indicate depletion of the snow cover at open sites (i.e. elevations above 1400 m a.s.l.) and no snow in the lower forested part of the catchment, which is in line with ground snow observations. Although the mean snow depth at the open sites exceeded 35 cm, a patchy snow cover is indicated by snow course measure-ments. The bottom panels (Fig. 5) show the cloud obstruc-tion for the date of SWE observaobstruc-tions and the applicaobstruc-tion of the MODIS temporal filter which indicates no snow on the previous day (29 January). In this case, the open sites are situated directly at the edge of cloud coverage, which most likely indicates a false MODIS classification. This is docu-mented by ground snow depth measurements, which exceed 120 cm, and by continuous snow cover observed in the lower, forested part of the catchment.
Table 3.Snow mapping accuracy (SI) at open sites. TheA,Band Clouds categories represent the number of station days and are defined as in Table 2.
Combined Terra+Aqua 2-day temporal filter of the combined images
Snow True Snow False Snow True Snow False
Year (A) (B) Clouds SI (%) (A) (B) Clouds SIFILTER(%)
2000 3 0 13 100 4 0 12 100
2001 10 1 11 90.9 14 1 7 93.3
2002 4 0 15 100 9 2 8 81.8
2003 10 0 2 100 10 0 2 100
2004 5 0 15 100 14 0 6 100
2005 2 0 2 100 4 0 0 100
2006 8 0 7 100 14 0 1 100
2007 3 0 12 100 10 0 5 100
2008 3 0 12 100 15 0 0 100
2009
2010 4 0 0 100 4 0 0 100
2011 5 0 0 100 5 0 0 100
Sum 57 1 89 98.3 103 3 41 97.2
Fig. 5.Misclassification of snow as land by the combined MODIS product (top panels, May 2001) and the 2-day filter of the combined product (bottom panels, January 2002) at open sites (Fig. 4). The maps in black frames show the date of ground snow measurement; red circles indicate the sites where misclassification occurs.
maximum SWE measured in the forest. Most of the MODIS mapping errors occur at the end of the snowmelt seasons, when snow cover tends to be patchy and the mean snow depth usually does not exceed 10–15 cm. The snow cover accuracy of the combined product decreases from perfect agreement in January and February to 84.6 % in March and 90.0 % in April. A similar decrease of SI to 92.0 % (March) and 81.8 % (April) is found for the 2-day filter. Figure 7 shows MODIS snow cover patterns for days when MODIS misclassifica-tion occurs. The mapping errors occur at 6 different snow
Year (A) (B) Clouds SI (%) (A) (B) Clouds SIFILTER(%)
2000 6 0 12 100.0 6 0 12 100.0
2001 8 0 13 100.0 18 0 3 100.0
2002 7 0 13 100 16 0 4 100.0
2003 32 1 12 97.0 34 2 9 94.4
2004 9 5 28 64.3 24 6 12 80.0
2005 9 1 12 90.0 19 1 2 95.0
2006 15 0 15 100.0 24 0 6 100.0
2007 5 1 22 83.3 18 1 9 94.7
2008 5 0 26 100.0 23 1 7 95.8
2009 5 0 9 100.0 9 0 5 100.0
2010 1 0 3 100.0 1 0 3 100.0
2011 12 1 5 92.3 17 1 0 94.4
Sum 114 9 170 92.7 209 12 72 94.6
accuracy. Overall, from the 12 misclassification cases, 4 oc-cur during patchy snow conditions as is indicated by profile snow depth measurements, and in 9 cases MODIS indicates snow closer than 120 m to the snow profile.
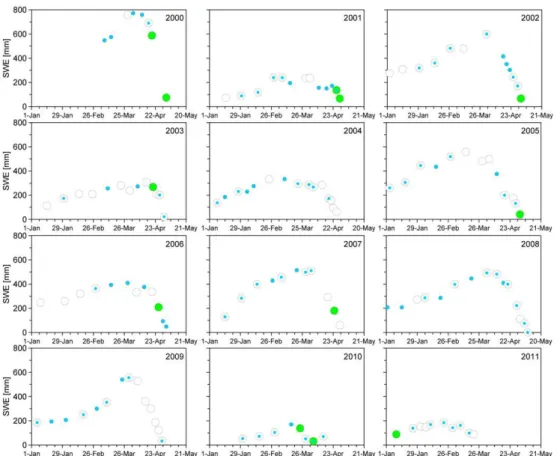
The MODIS snow mapping accuracy at the ˇCervenec site is presented in Table 5 and Fig. 8. This site is specific in that the snow measurements are carried out in an open field, but from the perspective of the MODIS pixel resolution, it con-sists of a significant portion of forest cover. The snow map-ping accuracy of combined product is only 81.8 %, which is significantly smaller than at the open or forest sites. This product falsely classifies snow as land on 10 days in the pe-riod 2000–2011. The application of a 2-day temporal filter increases the snow mapping accuracy to 90.1 % and at the same time decreases the relative number of days with cloud coverage from 67 % to less than 28 %. Figures 8 and 9 show that most of the mapping errors occur during the snowmelt period in April. From 12 misclassification cases of the tem-poral filter, 7 cases (May 2000, 2002, 2005 and April 2001, 2007 and 2010) represent patchy snow conditions, and in 4 cases there is snow mapped very close (less than 60 m) to the site. If we omit days with patchy conditions from the anal-yses, then the snow mapping accuracy increases to 93.8 % (combined MODIS) and 95.6 % (filtered MODIS). The re-sults indicate that only in one case (20 April 2000) the mis-classification error is caused by the MODIS mapping algo-rithm. The snow depth measurements at three snow profiles varies between 80 and 165 cm on this day.
5 Discussion and conclusions
The main objective of this study is to evaluate the MODIS snow mapping accuracy in a small mountain catchment. In
comparison to existing assessments, a decade of extensive snow course measurements are used to test how accurate MODIS is at open and forest sites. A focus on a small exper-imental catchment has the advantage of using very detailed local knowledge and the possibility of using snow measure-ments carried out directly in the forest, instead of extrapolat-ing the measurements from climate stations (grassy sites). As it is indicated by Simic et al. (2004), open site measurements may not always be representative of snow cover conditions in surrounding vegetated areas.
Fig. 6.Snow water equivalent (SWE) observations at forest sites and MODIS classification at the respective pixels in individual snow seasons (2000–2011). Colors indicate MODIS snow (white), land (green) and cloud (blue) classifications. Overlapping of smaller (cloud) with larger (snow or land) symbols indicates the information is from the MODIS 2-day filter instead of the original cloud classification by MODIS for that day.
experimental catchment, the relative number of days with clouds exceeds 60 %, which is similar to results from Aus-tria (Parajka and Bl¨oschl, 2006) and in Canada (Tong et al., 2009a). Interestingly, the use of the 2-day temporal filter en-ables a significant decrease in the number of days with cloud coverage and an increase of overall snow mapping accuracy. In total, the 2-day temporal filter decreases the number of cloudy days in the Jalovecky creek catchment to 26 % and increases the snow cover mapping index to 94 %.
The existing studies report that the largest MODIS map-ping errors occur only at a small number of sites, which are likely affected by specific local meteorological and/or phys-iographic conditions (e.g. low solar illumination conditions or false land/water mask along the coastline). Riggs and Hall (2011) note that “aside from potential mapping or geoloca-tion errors, most snow detecgeoloca-tion errors are associated with non-ideal conditions for snow detection or with snow/cloud discrimination.” The dataset used in this study enables a de-tailed assessment of the misclassification of snow as land by
Fig. 8.Snow water equivalent (SWE) observations at ˇCervenec station and MODIS classification at the respective pixel in individual snow seasons (2000–2011). Colors indicate MODIS snow (white), land (green) and cloud (blue) classifications. Overlapping of smaller (cloud) with larger (snow or land) symbols indicates the information is from the MODIS 2-day filter instead of the original cloud classification by MODIS for that day.
Table 5.Snow mapping accuracy (SI) at ˇCervenec station. TheA,B and Clouds categories represent the number of station days and are defined as in Table 2.
Combined Terra+Aqua 2-day temporal filter of the combined images
Snow True Snow False Snow True Snow False
Year (A) (B) Clouds SI (%) (A) (B) Clouds SIFILTER(%)
2000 1 2 13 33.3 2 2 12 50.0
2001 3 1 9 75.0 7 2 4 77.8
2002 3 1 12 75.0 11 1 4 91.7
2003 7 1 5 87.5 10 1 2 90.9
2004 5 0 12 100.0 13 0 4 100.0
2005 6 1 9 85.7 13 1 2 92.9
2006 5 1 7 83.3 6 1 6 85.7
2007 2 1 8 66.7 8 1 2 88.9
2008 3 0 13 100.0 11 0 5 100.0
2009 6 0 10 100.0 12 0 4 100.0
2010 0 1 7 0.0 5 2 1 71.4
2011 4 1 7 80.0 11 1 0 91.7
itself. It would be interesting to examine some kind of spa-tial filter to reduce such misclassifications in the future. The third factor is the misclassification by the MODIS mapping algorithm. Three cases are identified as caused by this fac-tor. Two of them are found at open sites and are located at the edge of cloud cover. Only one case at the ˇCervenec sta-tion (April 2000) seems to be a distinct MODIS mapping error. However, it is beyond the scope of the study to analyze technical details of why the MODIS algorithm classifies the particular pixels as land instead of snow in those cases.
The results of this study confirm that MODIS allows ac-curate snow cover mapping also in forested mountain catch-ments. We believe that our results could be extrapolated to other regions with similar vegetation and terrain characteris-tics. For the future, it would be very interesting and important to observe the exact date of snow disappearance, as well as to extend such accuracy assessments to other regions, because snow in forests is an important component of the water bal-ance in many catchments worldwide.
Acknowledgements. We would like to thank grant VEGA 2/0042/11 and the ¨OAW project “Predictability of Runoff in a Changing Environment” for financial support. We greatly appre-ciate very constructive and helpful comments of S. Dery and an anonymous reviewer.
Edited by: M. Gooseff
References
Barnes, W. L., Pagano, T. S., and Salomonson, V. V.: Prelaunch characteristics on the moderate resolution imaging spectrora-diometer (MODIS) on EOS-AM1, IEEE T. Geosci. Remote, 36, 1088–1100, 1998.
Hall, D. K., Foster, J. L., Verbyla, D. L., Klein, A. G., and Benson, C. S.: Assessment of snow-cover mapping accuracy in a vari-ety of vegetation-cover densities in central Alaska, Remote Sens. Environ., 66, 129–137, 1998.
Hall, D. K., Riggs, G. A., and Salomonson, V. V.: Algorithm Theoretical Basis Document (ATBD) for the MODIS Snow and Sea Ice-mapping Algorithms, available at: http://modis.gsfc. nasa.gov/data/atbd/atbd mod10.pdf, 2001.
Hall, D. K., Riggs, G. A., and Salomonson, V. V: MODIS/Terra Snow Cover Daily L3 Global 500 m Grid V005, Boulder, Col-orado USA: National Snow and Ice Data Center, Digital media, updated daily, 2006.
Hansen, M. C., DeFries, R. S., Townshend, J. R. G., Carroll, M., Dimiceli, C., and Sohlberg, R. A.: Global percent tree cover at a spatial resolution of 500 m: first results of the MODIS vegetation continuous fields algorithm, Electronic media, 2003.
Holko, L. and Kostka, Z.: Hydrological characteristics of snow cover in the Western Tatra Mountains in winters 1987–2008, Fo-lia Geographica, series Geographica-physica, ISSN 0071-6715, XXXIX, 63–77, 2008.
Holko, L. and Kostka, Z.: Hydrological processes in mountains – knowledge gained in the Jalovecky Creek catchment, Slovakia.
Status and Perspectives of Hydrology in Small Basins (Pro-ceedings of the Workshop held at Goslar-Hahnenklee, Germany, 30 March–2 April 2009), IAHS Publ. 336, Wallingford: IAHS, ISBN 978-1-907161-08-7, 84–89, 2010.
Kaufman, Y. J., Kleidman, R. G., Hall, D. K., and Martins, J. V.: Remote sensing of subpixel snow cover using 0.66 and 2.1 µm channels, Geophys. Res. Lett., 29, 4 pp., 1781, doi:10.1029/2001GL013580, 2002.
Klein, A. G. and Barnett, A. C.: Validation of daily MODIS snow cover maps if the Upper Rio Grande River Basin for the 2000– 2001 snow year, Remote Sens. Environ., 86, 162–176, 2003. Klein, A. G., Hall, D. K., and Riggs, G. A.: Improving snow cover
mapping in forests through the use of a canopy reflectance model, Hydrol. Process., 12, 1723–1744, 1998.
Kostka, Z. and Holko, L.: Soil moisture and runoff generation in a small mountain basin, Publication of the Slovak Committee for Hydrology, 2, Bratislava, ISBN 80-967808-1-6, 90 pp., 1997. MODIS web page information at: http://nsidc.org/data/docs/daac/
modis v5/mod10 l2 modis terra snow cover 5min swath.gd. html, 2010.
MODIS Reprojection Tool (MRT): user’s manual (Release 4.1), Land Processes DAAC USGS Earth Resources Observation and Science (EROS) Center, 69 pp., 2011.
Nester, T., Kirnbauer, R., Parajka, J., and Bl¨oschl, G.: Evaluating the snow component of a flood forecasting model, Hydrol. Res., in press, 2012.
Parajka, J. and Bl¨oschl, G.: Validation of MODIS snow cover images over Austria, Hydrol. Earth Syst. Sci., 10, 679–689, doi:10.5194/hess-10-679-2006, 2006.
Parajka, J. and Bl¨oschl, G.: Spatio-temporal combination of MODIS images – potential for snow cover mapping, Water Re-sour. Res., 44, W03406, doi:10.1029/2007WR006204, 2008. Parajka, J., and Bl¨oschl, G.: MODIS-based Snow Cover Products,
Validation, and Hydrologic Applications, in: Multiscale Hydro-logic Remote Sensing Perspectives and Applications, edited by: Chang, Y. and Ni-Bin, H., CRC Press 2012, 185–212, Print ISBN 978-1-4398-7745-6, 2012.
Poon, S. K. M. and Valeo, C.: Investigation of the MODIS snow mapping algorithm during snowmelt in the northern boreal forest of Canada, Can. J. Remote Sens., 32, 254–267, 2006.
Pu, Z., Xu, L., and Salomonson, V. V.: MODIS/Terra observed sea-sonal variations of snow cover over the Tibetan Plateau, Geo-phys. Res. Lett., 34, L06706, doi:10.1029/2007GL029262, 2007. Riggs, G. A. and Hall, D. K.: MODIS Snow and Ice Products, and Their Assessment and Applications, in: Land Remote Sensing and Global Environmental Change, edited by: Ramachandran, B., Justice, C. O., and Abrams, M. J., Springer Science+Business Media, LLC 2011, Remote Sensing and Digital Image Pro-cessing 11, Chapter 30, 681–707, doi:10.1007/978-1-4419-6749-7 30, 2011.
Roy, A., Royer, A., and Turcotte, R.: Improvement of springtime streamflow simulations in a boreal environment by incorporating snow-covered area derived from remote sensing data, J. Hydrol., 390, 35–44, 2010.
orology of the Quesnel River Basin, British Columbia, Canada, Hydrol. Earth Syst. Sci., 13, 1439–1452, doi:10.5194/hess-13-1439-2009, 2009a.
Tong, J., D´ery, S. J., and Jackson, P. L.: Topographic control of snow distribution in an alpine watershed of western Canada inferred from spatially-filtered MODIS snow products, Hydrol. Earth Syst. Sci., 13, 319–326, doi:10.5194/hess-13-319-2009, 2009b.
Geosci. Remote, 36, 1324–1338, 1998.