HESSD
12, 4471–4506, 2015Variability in snow cover phenology in China from 1952 to
2010
C. Q. Ke et al.
Title Page
Abstract Introduction
Conclusions References
Tables Figures
◭ ◮
◭ ◮
Back Close
Full Screen / Esc
Printer-friendly Version
Interactive Discussion
Discussion
P
a
per
|
Discussion
P
a
per
|
Discussion
P
a
per
|
Discussion
P
a
per
Hydrol. Earth Syst. Sci. Discuss., 12, 4471–4506, 2015 www.hydrol-earth-syst-sci-discuss.net/12/4471/2015/ doi:10.5194/hessd-12-4471-2015
© Author(s) 2015. CC Attribution 3.0 License.
This discussion paper is/has been under review for the journal Hydrology and Earth System Sciences (HESS). Please refer to the corresponding final paper in HESS if available.
Variability in snow cover phenology in
China from 1952 to 2010
C. Q. Ke1,2, X. C. Li3,4, H. Xie5, X. Liu1,2, and C. Kou1,2
1
Jiangsu Provincial Key Laboratory of Geographic Information Science and Technology, Nanjing University, Nanjing, 210023, China
2
Key Laboratory for Satellite Mapping Technology and Applications of State Administration of Surveying, Mapping and Geoinformation of China, Nanjing University, Nanjing, 210023 China
3
National Climate Center, China Meteorological Administration, Beijing 100081, China
4
Collaborative Innovation Center on Forecast and Evaluation of Meteorological Disasters, Faculty of Geography and Remote Sensing, Nanjing University of Information Science and Technology, Nanjing, 210044, China
5
Department of Geological Sciences, University of Texas at San Antonio, Texas 78249, USA
Received: 12 February 2015 – Accepted: 16 April 2015 – Published: 30 April 2015
Correspondence to: C. Q. Ke (kecq@nju.edu.cn)
HESSD
12, 4471–4506, 2015Variability in snow cover phenology in China from 1952 to
2010
C. Q. Ke et al.
Title Page
Abstract Introduction
Conclusions References
Tables Figures
◭ ◮
◭ ◮
Back Close
Full Screen / Esc
Printer-friendly Version
Interactive Discussion
Discussion
P
a
per
|
Discussion
P
a
per
|
Discussion
P
a
per
|
Discussion
P
a
per
|
Abstract
Daily snow observation data from 672 stations, particularly the 352 stations with over ten annual mean snow cover days (SCD), during 1952–2010 in China, are used in this study. We first examine spatiotemporal variations and trends of SCD, snow cover onset date (SCOD), and snow cover end date (SCED). We then investigate SCD
relation-5
ships with number of days with temperature below 0◦C (TBZD), mean air temperature
(MAT), and Arctic Oscillation (AO) index, the latter two being constrained to the snow season of each snow year. The results indicate that the heavy-snow years for the en-tire country include 1955, 1957, 1964, and 2010, and light-snow years include 1953, 1965, 1999, 2002, and 2009. The reduced TBZD and increased MAT are the main
rea-10
sons for the overall delay of SCOD and advance of SCED since 1952, although it is not necessary for one station to experience both significantly delayed SCOD and early SCED. This explains why only 15 % of the stations show significant shortening of SCD, while 75 % of the stations show no significant change in the SCD trends. This differs with the overall shortening of the snow period in the Northern Hemisphere previously
15
reported. Our analyses indicate that the SCD distribution pattern and trends in China are very complex and are not controlled by any single climate variable examined (i.e. TBZD, MAT, or AO), but a combination of multiple variables. It is found that the AO index has the maximum impact on the SCD shortening trends in Shandong Peninsula, Changbai Mountains, and North Xinjiang, while the combined TBZD and MAT have the
20
maximum impact on the SCD shortening trends in the Loess Plateau, Xiaoxingganling, and Sanjiang Plain.
1 Introduction
Snow has a profound impact on the surficial and atmospheric thermal conditions, and is very sensitive to climatic and environmental changes, because of its high
reflec-25
HESSD
12, 4471–4506, 2015Variability in snow cover phenology in China from 1952 to
2010
C. Q. Ke et al.
Title Page
Abstract Introduction
Conclusions References
Tables Figures
◭ ◮
◭ ◮
Back Close
Full Screen / Esc
Printer-friendly Version
Interactive Discussion
Discussion
P
a
per
|
Discussion
P
a
per
|
Discussion
P
a
per
|
Discussion
P
a
per
1989; Groisman et al., 1994). The extent of snow cover in the Northern Hemisphere has decreased significantly over the past decades because of global warming (Robin-son and Dewey, 1990; Brown and Robin(Robin-son, 2011). Snow cover showed the largest decrease in the spring, and the decrease rate increased for higher latitudes in re-sponse to larger albedo feedback (Déry and Brown, 2007). In North America, snow
5
depth in central Canada showed the greatest decrease (Dyer and Mote, 2006), and snowpack in the Rocky Mountains in the U.S. declined (Pederson et al., 2013). How-ever, in situ data showed a significant increase in snow accumulation in winter but a shorter snowmelt season over Eurasia (Bulygina et al., 2009). Meteorological data indicated that the snow cover over northwest China exhibited a weak upward trend in
10
depth (Qin et al., 2006), but the spatiotemporal variations were large (Ke et al., 2009; Ma and Qin, 2012). Simulation experiments using climate models indicated that, with continuing global warming, the snow variation in China would show more differences and uncertainties in space and time than ever before (Shi et al., 2011; Ji and Kang, 2013). Spatiotemporal variations of snow cover are also manifested as snowstorms
15
or blizzards, particularly, excessive snowfall over a short time duration (Bolsenga and Norton, 1992; Liang et al., 2008; Gao, 2009; Wang et al., 2013; Llasat et al., 2014).
Snow cover day (SCD) is an important index that represents the environmental fea-tures of climate (Ye and Ellison, 2003; Scherrer et al., 2004), and is directly related to the radiation and heat balance of the Earth–atmosphere system. The SCD varies
20
in space and time and contributes to climate change over short time scales (Zhang, 2005), especially in the Northern Hemisphere. Bulygina et al. (2009) investigated the linear trends of SCD observed at 820 stations from 1966 to 2007, and indicated that the duration of snow cover decreased in the northern regions of European Russia and in the mountainous regions of southern Siberia, while it increased in Yakutia and the
25
HESSD
12, 4471–4506, 2015Variability in snow cover phenology in China from 1952 to
2010
C. Q. Ke et al.
Title Page
Abstract Introduction
Conclusions References
Tables Figures
◭ ◮
◭ ◮
Back Close
Full Screen / Esc
Printer-friendly Version
Interactive Discussion
Discussion
P
a
per
|
Discussion
P
a
per
|
Discussion
P
a
per
|
Discussion
P
a
per
|
advanced. Satellite snow data indicated that the average snow season duration over the Northern Hemisphere has decreased at a rate of 5.3 days per decade between 1972/73 and 2007/08, with a major change in the trend of snow duration in the late 1980s, especially in western Europe, central and East Asia, and mountainous regions in western United States (Choi et al., 2010).
5
China is the main large snow cover distribution area in the middle latitudes and the Northern Hemisphere, with large spatiotemporal differences in the SCD (Wang and Li, 2012). Analysis of 40 meteorological stations from 1971 to 2010 indicated that the SCD had a significant decreasing trend in the western and south-eastern Tibetan Plateau, with the largest decline observed in Nielamu, reaching 9.2 days per decade (Tang
10
et al., 2012). Data analysis also indicated that the SCD had a linear decreasing trend at most stations in the Hetao region and its vicinity (Xi et al., 2009). However, analysis of meteorological station data in Xinjiang showed that the SCD had a slight increasing trend, occurring mainly in 1960–1980 (Wang et al., 2009b). Li et al. (2009) analysed meteorological data from 80 stations in Heilongjiang Province, Northeast China. Their
15
results showed that the snow cover duration shortened, because of both the delayed SCOD (by 1.9 days per decade) and advancing SCED (by 1.6 days per decade). The delay and advance took place mainly in the lower altitude plains.
The SCD is sensitive to local winter temperature and precipitation, latitude (Hantel et al., 2000; Wang et al., 2009a; Serquet et al., 2011; Morán-Tejeda et al., 2013), and
20
altitudinal gradient and terrain roughness (Lehning et al., 2011; Ke and Liu, 2014). Essentially, the SCD variation is mainly attributed to large-scale atmospheric circula-tion or climatic forcing (Beniston, 1997; Ma and Qin, 2012; Birsan and Dumitrescu, 2014), such as monsoons, El Niño/Southern Oscillation (ENSO), North Atlantic Os-cillation (NAO), and Arctic OsOs-cillation (AO). Xu et al. (2010) investigated the
relation-25
HESSD
12, 4471–4506, 2015Variability in snow cover phenology in China from 1952 to
2010
C. Q. Ke et al.
Title Page
Abstract Introduction
Conclusions References
Tables Figures
◭ ◮
◭ ◮
Back Close
Full Screen / Esc
Printer-friendly Version
Interactive Discussion
Discussion
P
a
per
|
Discussion
P
a
per
|
Discussion
P
a
per
|
Discussion
P
a
per
et al., 2001; Wu and Wang, 2002; Jeong and Ho, 2005). The inter-annual variation of winter extreme cold days in the northern part of eastern China is closely linked to the AO (Chen et al., 2013). Certainly, the AO plays an important role in the SCD variation. An increase in the SCD before 1990 and a decrease after 1990 have been reported in the Tibetan Plateau, and snow duration has positive correlations with the winter AO
5
index (You et al., 2011), and a significant correlation between the AO and snowfall over the Tibetan Plateau on inter-decadal timescale was also reported by Lü et al. (2008).
The focus of this study is the variability in the snow cover phenology of China. A longer time series of daily observations of snow cover is used for these spatial and temporal analyses. We first characterize the spatial patterns of change in the SCD,
10
SCOD, and SCED in different regions of China; we then examine the sensitivity of SCD to the number of day with temperature below 0◦C (TBZD), the mean air temperature
(MAT), and the Arctic Oscillation (AO) index during the snow season (between SCOD and SCED).
2 Data and methods
15
2.1 Data
We use daily snow cover and temperature data in China from 1 September 1951 to 31 August 2010, provided by the National Meteorological Information Centre of China Meteorological Administration (CMA). According to the Specifications for Surface Me-teorological Observations (China MeMe-teorological Administration, 2003), an SCD is
de-20
fined as a day when the snow cover in the area fulfils two requirements: at least half of the observation field is covered by snow, and the minimum snow depth is 1 cm. For any day with at least half of the observation field covered by snow but with snow depth of less than 1 cm, the snow depth is denoted as 0, i.e. a thin SCD. Station density is high in eastern China, where the observational data for most stations are complete,
25
HESSD
12, 4471–4506, 2015Variability in snow cover phenology in China from 1952 to
2010
C. Q. Ke et al.
Title Page
Abstract Introduction
Conclusions References
Tables Figures
◭ ◮
◭ ◮
Back Close
Full Screen / Esc
Printer-friendly Version
Interactive Discussion
Discussion
P
a
per
|
Discussion
P
a
per
|
Discussion
P
a
per
|
Discussion
P
a
per
|
conditions, the discontinuous nature of snowfall is obvious in western China, especially in the Tibetan Plateau, with patchy snow cover (Ke and Li, 1998), and many thin SCDs in these station records. At the same time, in western China, station density is low, and the observation history is relatively short, although two of the three major snow regions are located in western China. If all stations with short time series are eliminated, and
5
thin SCDs are not taken into account, the spatial representativeness of the dataset would be a problem. Therefore, a time series of at least 30 years is included in this study, including those thin SCDs.
Since station relocation and changes in the ambient environment could cause incon-sistencies in the recorded data, we implement strict quality controls (such as inspection
10
for logic, consistency, and uniformity) on the observational datasets in order to reduce errors (Ren et al., 2005). The standard normal homogeneity test (Alexandersson and Moberg, 1997) at the 95 % confidence level is applied to the daily SCD and tempera-ture series data in order to identify all possible breakpoints. Time series gap filling is performed after all inhomogeneities are eliminated, using nearest neighbour
interpola-15
tion.
We define a snow year as the period from 1 September of the previous year to 31 August of the current year. For instance, September, October, and November 2009 are treated as the autumn season of snow year 2010, December 2009 and January and February 2010 as the winter season of snow year 2010, and March, April, and
20
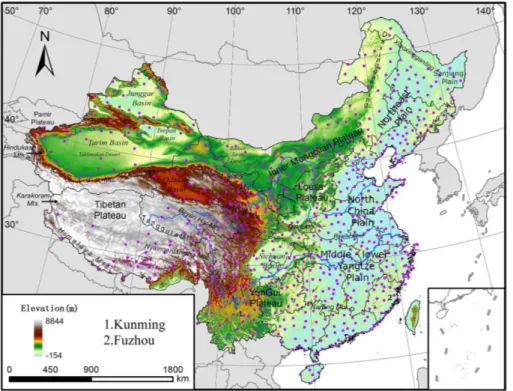
May 2010 as the spring season of snow year 2010. Finally, 672 stations with annual mean SCDs greater than 1.0 (day) are selected for this study (Fig. 1), although the observation period for each station is different, varying between 59 years (1951/1952– 2009/2010) and 30 years (1980/1981–2009/2010). Overall, 588 stations have obser-vation records between 50 and 59 years, 47 stations between 40 and 49 years, and 37
25
HESSD
12, 4471–4506, 2015Variability in snow cover phenology in China from 1952 to
2010
C. Q. Ke et al.
Title Page
Abstract Introduction
Conclusions References
Tables Figures
◭ ◮
◭ ◮
Back Close
Full Screen / Esc
Printer-friendly Version
Interactive Discussion
Discussion
P
a
per
|
Discussion
P
a
per
|
Discussion
P
a
per
|
Discussion
P
a
per
All 672 stations are used to analyse the spatiotemporal distribution of SCD in China, while only 352 stations with more than ten annual mean SCDs are used to study the changes of SCOD, SCED, and SCD relationships with TBZD, MAT, and the AO index.
The daily AO index constructed by projecting the daily (00Z) 1000 mb height anoma-lies poleward of 20◦N from http://www.cpc.ncep.noaa.gov/products/precip/CWlink/ 5
daily_ao_index/ao.shtml, is used in this paper. A positive (negative) AO index corre-sponds to low (high) pressure anomalies throughout the polar region and high (low) pressure anomalies across the subtropical and mid-latitudes (Peings et al., 2013). We average the daily AO indexes during the snow season (between SCOD and SCED) of each station as the AO index of the year. A time series of AO indexes of the snow
10
seasons from 1952 to 2010, for each of the 352 stations, is then constructed.
A digital elevation model (DEM) according to the Shuttle Radar Topographic Mission (SRTM, http://srtm.csi.cgiar.org) of the National Aeronautics and Space Administration (NASA) with a resolution of 90 m and the administration map of China are used as the base map.
15
2.2 Methods
We apply the non-parametric Mann–Kendall (MK) test to analyse the trends of SCD, SCOD, and SCED. The MK test is an effective tool to extract the trends of time series, and is widely applied to the analysis of climate sequences (Marty, 2008). The MK test is characterized as being more objective, since it is a non-parametric test. A positive
20
standardized MK statistic value indicates an upward or increasing trend, while a nega-tive value demonstrates a downward or decreasing trend. Confidence levels of 90 and 95 % are taken as thresholds to classify the significance of positive and negative trends of SCD, SCOD, and SCED.
The spatial distribution of tendency in the SCD, SCOD, and SCED, and their
cal-25
HESSD
12, 4471–4506, 2015Variability in snow cover phenology in China from 1952 to
2010
C. Q. Ke et al.
Title Page
Abstract Introduction
Conclusions References
Tables Figures
◭ ◮
◭ ◮
Back Close
Full Screen / Esc
Printer-friendly Version
Interactive Discussion
Discussion
P
a
per
|
Discussion
P
a
per
|
Discussion
P
a
per
|
Discussion
P
a
per
|
their cross-covariance, and has been successfully applied to spatial data interpolation (Kuhlman and Igúzquiza, 2010; Biggs and Atkinson, 2011).
3 Results
3.1 Spatiotemporal variations of SCD
3.1.1 Spatial distribution of SCD
5
The analysis of observations from 672 stations indicates that there are three major stable snow regions with more than 60 annual mean SCDs: Northeast China, North Xinjiang, and the Tibetan Plateau, with Northeast China being the largest of the three (Fig. 2a). In the Daxingganling, Xiaoxingganling, and Changbai Mountains of North-east China, there are more than 90 annual mean SCDs, corresponding to a relatively
10
long snow season. The longest annual mean SCDs, 169 days, is at Arxan Station (in the Daxinganling Mountains) in Inner Mongolia. In North Xinjiang, the SCDs are rela-tively long in the Tianshan and Altun Mountains, followed by the Junggar Basin. The annual mean SCDs in the Himalayas, Nyainqentanglha, Tanggula Mountains, Bayan Har Mountains, Anemaqen Mountains, and Qilian Mountains of the Tibetan Plateau
15
are relatively long, although most of these areas have less than 60 annual SCDs. Al-though the Tibetan Plateau has a high elevation, a cold climate, and many glaciers, its mean SCD is not as large as that of the other two stable snow regions.
Areas with SCDs of 10–60 are called unstable snow areas with annual periodicity, including the peripheral parts of the three major stable snow regions, and the Loess
20
Plateau, Northeast Plain, North China Plain, Shandong Peninsula, and areas in north of the Qinling-Huaihe line (along the Qinling Mountains and Huaihe River to the east). Areas with SCDs of 1–10 are called unstable snow areas without annual periodicity (the mountainous areas are excluded), including the Tarim Basin, Qaidam Basin, Badain Jaran Desert, the peripheral parts of Sichuan Basin, the northeast part of the Yungui
HESSD
12, 4471–4506, 2015Variability in snow cover phenology in China from 1952 to
2010
C. Q. Ke et al.
Title Page
Abstract Introduction
Conclusions References
Tables Figures
◭ ◮
◭ ◮
Back Close
Full Screen / Esc
Printer-friendly Version
Interactive Discussion
Discussion
P
a
per
|
Discussion
P
a
per
|
Discussion
P
a
per
|
Discussion
P
a
per
Plateau, and the middle and lower Yangtze River Plain. Areas with occasional snow and mean annual SCD of less than 1.0 (day) are distributed north of the Sichuan Basin and in the belt along Kunming, the Nanling Mountains, and Fuzhou (approximate latitude of 25◦N). Because of the latitude or local climate and terrain, there is no snow in the
Taklimakan Desert, Turpan Basin, the Yangtze River Valley in the Sichuan Basin, the
5
southern parts of Yunnan, Guangxi, Guangdong and Fujian, and on the Hainan Island. The spatial distribution pattern of SCDs based on longer time series climate data in this study is similar to previous studies (Li and Mi, 1983; Li, 1990; Liu et al., 2012; Wang et al., 2009a; Wang and Li, 2012). The snow distribution is closely linked to latitude and elevation, and is generally consistent with the climate zones (Lehning et al., 2011; Ke
10
and Liu, 2014). The higher the latitude, the lower the temperature and the more SCDs there are. Therefore, there are relatively more SCDs in Northeast China and North Xinjiang, and fewer SCDs to the south (Fig. 2a). In the Tibetan Plateau, located in south-western China, the elevation is higher than eastern areas at the same latitude, and the SCDs are greater than in eastern China (Tang et al., 2012). The amount of
15
precipitation also plays a critical role in determining the SCD (Hantel et al., 2000). In the north-eastern coastal areas of China, which are affected considerably by the ocean, there is much precipitation. In North Xinjiang, which has a typical continental (inland) climate, the precipitation is less than in Northeast China, and there are more SCDs in the north of Northeast China than in North Xinjiang (Dong et al., 2004; Wang
20
et al., 2009b). Moreover, the local topography has a relatively large impact on the SCD (Lehning et al., 2011). The Tarim Basin is located inland, with relatively little precipita-tion, thus snowfall there is extremely rare (Li, 1993). The Sichuan Basin is surrounded by high mountains, and therefore situated in the precipitation shadow in winter, result-ing in fewer SCDs (Li and Mi, 1983; Li, 1990).
25
HESSD
12, 4471–4506, 2015Variability in snow cover phenology in China from 1952 to
2010
C. Q. Ke et al.
Title Page
Abstract Introduction
Conclusions References
Tables Figures
◭ ◮
◭ ◮
Back Close
Full Screen / Esc
Printer-friendly Version
Interactive Discussion
Discussion
P
a
per
|
Discussion
P
a
per
|
Discussion
P
a
per
|
Discussion
P
a
per
|
large fluctuations because there is little precipitation during the cold seasons, and cer-tainly little snowfall and large CVs of SCD. In particular, the Taklimakan Desert in the Tarim Basin is an extremely arid region, with only occasional snowfall. Therefore, it has a very large range of SCD fluctuations. Additionally, the middle and lower Yangtze River Plain also has large SCD fluctuations because of warm-temperate or sub-tropic
5
climate with short winter and little snowfall. Generally, the smaller the SCD, the larger the CV (Wang et al., 2009a). This is consistent with other climate variables, such as precipitation (Yang et al., 2015).
3.1.2 Temporal variations of SCD
Seasonal variation of SCD is primarily controlled by temperature and precipitation
10
(Hantel et al., 2000; Liu et al., 2012). In North Xinjiang and Northeast China, snow is primarily concentrated in the winter (Fig. 3). In these regions, the SCD exhibits a “single-peak” distribution. In the Tibetan Plateau, however, the seasonal variation of SCD is slightly different, i.e. more snow in the spring and autumn combined than in the winter.
15
The temporal variation of SCD shows very large differences from one year to an-other. We define heavy-snow or light-snow years based on the SCD anomaly: for a given year, if 70 % of the stations have a positive (negative) anomaly and 30 % of the stations have an SCD larger (smaller) than the mean ± one SD (1 SD), we regard the year as a heavy-snow (light-snow) year. The heavy-snow years in China
20
are 1955, 1957, 1964, and 2010 (Table 1). Moreover, the stations with SCDs larger than the mean + 2 SD account for 29 % of all stations in 1955 and 1957, and are considered as extremely heavy-snow years. In 1957, there was an almost nation-wide snowstorm except for North Xinjiang (Fig. 4a). This 1957 event had a great impact on agriculture, natural ecology, and social-economic systems, and resulted
25
pat-HESSD
12, 4471–4506, 2015Variability in snow cover phenology in China from 1952 to
2010
C. Q. Ke et al.
Title Page
Abstract Introduction
Conclusions References
Tables Figures
◭ ◮
◭ ◮
Back Close
Full Screen / Esc
Printer-friendly Version
Interactive Discussion
Discussion
P
a
per
|
Discussion
P
a
per
|
Discussion
P
a
per
|
Discussion
P
a
per
tern caused by high pressure (the AO) brought cold, moist air from the north. Many parts of the Northern Hemisphere experienced heavy snowfall and record-low tem-peratures, leading to, among other things, a number of deaths, widespread trans-port disruption, and power failures http://en.wikipedia.org/wiki/Winter_of_2009-10_in_ Europe, http://en.wikipedia.org/wiki/February_9-10,_2010_North_American_blizzard).
5
The blizzards across the Texas and Oklahoma panhandles in 1957 (Bolsenga and Nor-ton, 1992; Changnon and Changnon, 2006) and across the east coast in 2010 were also recorded as the biggest snowstorms of the United States from 1888 to the present (http://www.crh.noaa.gov/mkx/?n=biggestsnowstorms-us).
Light-snow years include 1953, 1965, 1999, 2002, and 2009 (Table 1). If there is
10
too little snowfall in a specific year, a drought is possible. Drought resulting from little snowfall in the cold season is a slow process and can sometimes cause disasters. For example, East China displayed an apparent negative SCD anomaly in 2002 (Fig. 4b), and had very little snowfall, leading to an extreme winter drought in Northeast China, where snowfall is the primary form of winter precipitation (Fang et al., 2014).
15
Because of different atmospheric circulation backgrounds, vapour sources, and to-pographic conditions in different regions of China, there are great differences in the SCD even in one year. For example, in 2008, there were more SCDs and longer snow duration in the Yangtze River Basin, North China, and the Tianshan Mountains in Xin-jiang (Fig. 4c), especially in the Yangtze River Basin, where large snowfall is normally
20
not observed. However, four episodes of severe and persistent snow, extreme low tem-peratures, and freezing weather occurred in early 2008, leading to a large-scale catas-trophe in this region where there were no mitigation measures for this type of a disaster (Gao, 2009). As reported by the Ministry of Civil Affairs of China, the 2008 snow disas-ter killed 107 people and caused losses of US$ 15.45 billion. Both the SCDs and scale
25
HESSD
12, 4471–4506, 2015Variability in snow cover phenology in China from 1952 to
2010
C. Q. Ke et al.
Title Page
Abstract Introduction
Conclusions References
Tables Figures
◭ ◮
◭ ◮
Back Close
Full Screen / Esc
Printer-friendly Version
Interactive Discussion
Discussion
P
a
per
|
Discussion
P
a
per
|
Discussion
P
a
per
|
Discussion
P
a
per
|
There are big differences in the temporal variations of SCD even in the three major stable snow regions. If we redefine the SCD anomaly for heavy-snow or light-snow years, using the much higher standard that 80 % of stations should have a positive (negative) anomaly and 40 % of stations should have an SCD larger (smaller) than the mean±1SD, it is found that 1957, 1973, and 2010 are heavy-snow years in Northeast
5
China (Helongjiang, Jilin and eastern Inner Mongolia), while 1959, 1963, 1967, 1998, 2002, and 2008 are light-snow years there (Table 2, Fig. 4a–c). Heavy-snow years in North Xinjiang include 1959, 1960, 1977, 1980, 1988, 1994, and 2010, and light-snow years include 1974, 1995, and 2008 (Table 2, Fig. 4c). North Xinjiang is one of the regions prone to catastrophe, where frequent heavy snowfall greatly affects the
10
development of animal husbandry (Hao et al., 2002).
Heavy-snow years in the Tibetan Plateau include 1983 and 1990, whereas light-snow years include 1965, 1969, and 2010 (Table 2). The climate in the Tibetan Plateau is affected by the Indian monsoon from the south, westerlies from the west, and the East Asian monsoon from the east (Yao et al., 2012). Therefore, there is a regional
15
difference in the SCDs within the Tibetan Plateau, and even a difference in the spa-tiotemporal distribution of snow disasters (Wang et al., 2013). Our results differ from the conclusions drawn by Dong et al. (2001), as they only used data from 26 stations, covering only a short period (1967–1996).
3.1.3 SCD trends
20
Changing trends of annual SCDs are examined, as shown in Fig. 5, and summarized in Table 3. Among the 352 stations, there are 54 stations (15 %) with a significant neg-ative trend, and 35 stations (10 %) with a significant positive trend (both at the 90 % level), while 75 % of stations show no significant trends. The SCD exhibits a significant downward trend in the Shandong Peninsula, and insignificant downward trends in the
25
ex-HESSD
12, 4471–4506, 2015Variability in snow cover phenology in China from 1952 to
2010
C. Q. Ke et al.
Title Page
Abstract Introduction
Conclusions References
Tables Figures
◭ ◮
◭ ◮
Back Close
Full Screen / Esc
Printer-friendly Version
Interactive Discussion
Discussion
P
a
per
|
Discussion
P
a
per
|
Discussion
P
a
per
|
Discussion
P
a
per
ample, the SCD decreased by 40 days from 1955 to 2010 at the Kuandian station in Northeast China, 30 days from 1954 to 2010 at the Hongliuhe station in Xinjiang, and 15 days from 1958 to 2010 at the Gangcha station on the Tibetan Plateau (Fig. 6a–c). The SCDs in the Bayan Har Mountains, the Anemaqen Mountains, the Inner Mon-golia Plateau, and Daxingganling, exhibit a significant upward trend (Fig. 5a). For
ex-5
ample, for the Shiqu station on the eastern border of the Tibetan Plateau, the SCD increased 26 days from 1960 to 2010 (Fig. 6d). The coexistence of negative and pos-itive trends in the SCD change was also reported by Bulygina et al. (2009) and Wang and Li (2012).
3.2 Spatiotemporal variations of SCOD
10
3.2.1 SCOD variations
The SCOD is closely related to both latitude and elevation (Fig. 7a). For example, snowfall begins in September on the Tibetan Plateau, in early or middle October on the Daxingganling, and in middle or late October on the Altai Mountains of Xinjiang. The SCOD also varies from one year to another (Table 1). Using the definition of SCD
15
anomaly in terms of heavy-snow or light-snow years, as introduced before (i.e. 70 % stations with positive (negative) SCOD anomaly and 30 % stations with SCOD larger (smaller) than the mean±1SD), we consider a given year as a delayed (early) SCOD year. Only two years, 1996 and 2006, can be considered as delayed SCOD years on a large scale (Table 1), especially in 2006, in East China and the Tibetan Plateau
20
(Fig. 5d), while not any single year can be considered as an early SCOD year.
3.2.2 SCOD trends
There are 136 stations (39 %) with a significant trend of delayed SCOD, and 23 sta-tions (7 %) with a significant trend of early SCOD (both at the 90 % level), while 54 % of the stations show no significant trends (Table 3). The delaying of SCOD is significant
HESSD
12, 4471–4506, 2015Variability in snow cover phenology in China from 1952 to
2010
C. Q. Ke et al.
Title Page
Abstract Introduction
Conclusions References
Tables Figures
◭ ◮
◭ ◮
Back Close
Full Screen / Esc
Printer-friendly Version
Interactive Discussion
Discussion
P
a
per
|
Discussion
P
a
per
|
Discussion
P
a
per
|
Discussion
P
a
per
|
in Northeast China, the central and eastern Tibetan Plateau, the upper reach of the Yellow River, North Gansu, and North Xinjiang (Fig. 5b). These significantly delayed trends dominate the major snow areas of China. In particular, the delaying of SCOD in Northeast China is consistent with a previous study (Li et al., 2009). The SCOD in the Pan-Bohai Bay region and the Tianshan Mountains exhibits a trend towards
5
earlier SCOD. However, this trend is only significant in the Liaoxi corridor and the Tian-shan Mountains. For example, the SCOD at Pingliang station in Gansu Province shows a delaying rate of 5.2 days per decade from 1952 to 2010, but the SCOD at Weichang station in Hebei Province shows an advancing rate of 5.2 days per decade from 1952 to 2010 (Fig. 6e–f).
10
3.3 Spatiotemporal variations of SCED
3.3.1 SCED variations
The pattern of SCED is similar to that of SCOD (Fig. 7b), i.e. places with early snow-fall normally show late snowmelt, while places with late snowsnow-fall normally show early snowmelt. Like the SCOD, temporal variations of SCED are large (Table 1). Using the
15
same standard for defining the SCOD anomaly, we judge a given year as a delayed or early SCED year. It is obvious that 1957 was a typical year whose SCED was delayed, which was also the reason for the great SCDs (Table 1, Fig. 4e). The SCEDs in 1997 and 2004 were very early. For example, in 1997, the SCED was early for almost all of China except for the Tibetan Plateau, western Tianshan, and western Liaoning. In
gen-20
eral, the early SCED was dominant and more evident than the delayed SCED (Table 1, Fig. 4f).
3.3.2 SCED trends
For the SCED, there are 138 stations (39 %) with a significant advancing trend (at the 90 % level), while 60 % of stations show no significant trends (Table 3). Major snow
HESSD
12, 4471–4506, 2015Variability in snow cover phenology in China from 1952 to
2010
C. Q. Ke et al.
Title Page
Abstract Introduction
Conclusions References
Tables Figures
◭ ◮
◭ ◮
Back Close
Full Screen / Esc
Printer-friendly Version
Interactive Discussion
Discussion
P
a
per
|
Discussion
P
a
per
|
Discussion
P
a
per
|
Discussion
P
a
per
areas in China all show early SCED, significant for Northeast China and the Tibetan Plateau (Fig. 5c). The tendency of delayed SCED is limited, with only two stations showing a significant trend. For example, the SCED at Jixi station in Northeast China advanced at a rate of 4.4 days per decade from 1952 to 2010, while the SCED at Maerkang station in Sichuan Province delayed at a rate of 4.2 days per decade from
5
1954 to 2010 (Fig. 6g–h).
4 Discussion
In the context of global warming, 136 stations (∼39 %) show significant delaying SCOD, and 138 stations (∼39 %) show significant advancing SCED, all at the 90 % confidence level. It is not necessary for one station to show both significant delaying
10
SCOD and advancing SCED. This explains why only 15 % of stations show a signif-icantly negative SCD trend, while 75 % of stations show no significant change in the SCD trends. The latter is inconsistent with the overall shortening of the snow period in the Northern Hemisphere reported by Choi et al. (2010). One reason could be the different time periods used in the two studies, 1972–2007 in Choi et al. (2010) as
15
compared with 1952–2010 in this study. Below, we discuss the possible connections between the spatiotemporal variations of snow cover and the warming climate and changing AO.
4.1 Relationship with TBZD
The number of days with temperature below 0◦C (TBZD) plays an important role in
20
the SCD. There are 330 stations (94 % of all stations) showing positive correlations between TBZD and SCD, with 193 of them (55 %) having significantly positive correla-tions (Table 3, Fig. 5d). For example, there is a significantly positive correlation between SCD and TBZD at Chengshantou station (Fig. 8a). Therefore, generally speaking, the smaller the TBZD, the shorter the SCD.
HESSD
12, 4471–4506, 2015Variability in snow cover phenology in China from 1952 to
2010
C. Q. Ke et al.
Title Page
Abstract Introduction
Conclusions References
Tables Figures
◭ ◮
◭ ◮
Back Close
Full Screen / Esc
Printer-friendly Version
Interactive Discussion
Discussion
P
a
per
|
Discussion
P
a
per
|
Discussion
P
a
per
|
Discussion
P
a
per
|
For the SCOD, there are 287 stations with negative correlations with TBZD, account-ing for 82 % of 352 stations, whereas only 63 stations (18 %) show positive correlations (Table 3). This means that for smaller TBZD, the SCOD is more delayed. For the SCED, there are 318 stations with positive correlations, accounting for 90 % of 352 stations, whereas only 34 stations (10 %) have negative correlations (Table 3). This means that
5
for smaller TBZD, the SCED is earlier.
4.2 Relationship with MAT
We calculate the correlation coefficient between SCD and MAT during the snow season for each of the 352 stations (Table 3). There are 320 stations with negative correlations (91 %), but only 32 stations (9 %) have positive correlations. Among them, 171
sta-10
tions (49 %) show significantly negative correlations. For example, the SCD and MAT at Baicheng station significantly negatively correlated (Fig. 8b). The negative correla-tions are dominant, and exist in almost all snow areas (Fig. 5e). That is, the SCD has a close relationship with the MAT, clearly indicating that the higher the MAT because of global warming during the snow season, the shorter the SCD.
15
4.3 Relationship with AO
Although the AO index showed a strong positive trend in the past decades (Thompson et al., 2000), its impact on the SCD in China is spatially distinctive. Positive correlations (47 % of stations) are found in central China, i.e. the eastern Tibetan Plateau, the upper reach of the Yangtze River, and the upper and middle reaches of the Yellow
20
HESSD
12, 4471–4506, 2015Variability in snow cover phenology in China from 1952 to
2010
C. Q. Ke et al.
Title Page
Abstract Introduction
Conclusions References
Tables Figures
◭ ◮
◭ ◮
Back Close
Full Screen / Esc
Printer-friendly Version
Interactive Discussion
Discussion
P
a
per
|
Discussion
P
a
per
|
Discussion
P
a
per
|
Discussion
P
a
per
5 Conclusions
This study examines the snow cover change based on 672 stations in 1952–2010 in China. Specifically, the 352 stations with more than ten annual mean SCDs are used to study the changing trends of SCD, SCOD, and SCED, and SCD relationships with TBZD, MAT, and AO index during snow seasons. Some important results are
summa-5
rized below.
Northeast China, North Xinjiang, and the Tibetan Plateau are the three major snow regions, with Northeast China being the largest. In North Xinjiang and in central and north-eastern China, the SCDs are concentrated in the winter season. On the Tibetan Plateau, however, snowfall is more frequent in the spring and fall. In China, the overall
10
inter-annual variability of SCD is large. The heavy-snow years in China include 1955, 1957, 1964, and 2010, while the light-snow years are 1953, 1965, 1999, 2002, and 2009. Only 15 % of stations show a significantly negative SCD trend, while 75 % of stations show no significant SCD trends. This differs from the overall shortening of the snow period in the Northern Hemisphere previously reported. One reason could
15
be the different time periods used in the two studies, 1972–2007 in the work of Choi et al. (2010) compared with 1952–2010 in this study. Our analyses indicate that the SCD distribution pattern and trends in China are very complex and are not controlled by any single climate variable examined (i.e. TBZD, MAT, or AO), but a combination of multiple variables. However, it seems that the AO index has the most impact on the
20
SCD shortening trends in the Shandong Peninsula, Changbai Mountains, and North Xinjiang; the combination of smaller TBZD and increasing MAT has the largest impact on the SCD shortening trends on the Loess Plateau, Xiaoxingganling, and the Sanjiang Plain.
It is found that significantly delayed SCOD occurs in Northeast China, the central
25
HESSD
12, 4471–4506, 2015Variability in snow cover phenology in China from 1952 to
2010
C. Q. Ke et al.
Title Page
Abstract Introduction
Conclusions References
Tables Figures
◭ ◮
◭ ◮
Back Close
Full Screen / Esc
Printer-friendly Version
Interactive Discussion
Discussion
P
a
per
|
Discussion
P
a
per
|
Discussion
P
a
per
|
Discussion
P
a
per
|
are mostly controlled by local latitude and elevation. Owing to global warming since 1950s, the reduced TBZD and increased MAT are the main reasons for overall delayed SCOD and early SCED, although it is not necessary for one station to experience both significantly delayed SCOD and early SCED. This explains why only 15 % of stations show significantly negative SCD trends, while 75% of stations show no significant SCD
5
trends.
Long-duration, consistent records of snow are rare in China because of many chal-lenges associated with taking accurate and representative measurements, especially in western China. The density of stations and the choice of metric also vary with time and locality. Therefore, more accurate and reliable observation data are needed to further
10
analyse the spatiotemporal distribution and features of snow cover phenology. Atmo-spheric circulation causes variability in the snow cover phenology, and these effects also require deeper investigation.
Acknowledgements. This work is financially supported by the Program for National Nature Sci-ence Foundation of China (No. 41371391), and the Program for the Specialized Research 15
Fund for the Doctoral Program of Higher Education of China (No. 20120091110017). This work is also partially supported by Collaborative Innovation Center of Novel Software Technology and Industrialization. We would like to thank the National Climate Center of China (NCC) in Beijing for providing valuable climate datasets.
References
20
Alexandersson, H. and Moberg, A.: Homogenization of Swedish temperature data Part 1: Ho-mogeneity test for linear trends, Int. J. Climatol., 17, 25–34, 1997.
Barnett, T. P., Dumenil, L., and Latif, M.: The effect of Eurasian snow cover on regional and global climate variations, J. Atmos. Sci., 46, 661–685, 1989.
Beniston, M: Variations of snow depth and duration in the Swiss Alps over the last 50 years: 25
HESSD
12, 4471–4506, 2015Variability in snow cover phenology in China from 1952 to
2010
C. Q. Ke et al.
Title Page
Abstract Introduction
Conclusions References
Tables Figures
◭ ◮
◭ ◮
Back Close
Full Screen / Esc
Printer-friendly Version
Interactive Discussion
Discussion
P
a
per
|
Discussion
P
a
per
|
Discussion
P
a
per
|
Discussion
P
a
per
Biggs, E. M. and Atkinson, P. M.: A comparison of gauge and radar precipitation data for sim-ulating an extreme hydrological event in the Severn Uplands, UK, Hydrol. Process., 2, 795– 810, 2011.
Birsan, M. V. and Dumitrescu, A.: Snow variability in Romania in connection to large-scale atmospheric circulation, Int. J. Climatol., 34, 134–144, 2014.
5
Bolsenga, S. J. and Norton, D. C.: Maximum snowfall at long-term stations in the U. S./Canadian Great Lakes, Nat. Hazards, 5, 221–232, 1992.
Brown, R. D. and Robinson, D. A.: Northern Hemisphere spring snow cover variability and change over 1922–2010 including an assessment of uncertainty, The Cryosphere, 5, 219– 229, doi:10.5194/tc-5-219-2011, 2011.
10
Bulygina, O. N., Razuvaev, V. N., and Korshunova, N. N.: Changes in snow cover over North-ern Eurasia in the last few decades, Environ. Res. Lett., 4, 045026, doi:10.1088/1748-9326/4/4/045026, 2009.
Changnon, S. A. and Changnon, D.: A spatial and temporal analysis of damaging snowstorms in the United States, Nat. Hazards, 37, 373–389, 2006.
15
Chen, S., Chen, W., and Wei, K.: Recent trends in winter temperature extremes in eastern China and their relationship with the Arctic Oscillation and ENSO, Adv. Atmos. Sci., 30, 1712–1724, 2013.
China Meteorological Administration: Specifications for Surface Meteorological Observations, China Meteorological Press, Beijing, 1–62, 2003.
20
Choi, G., Robinson, D. A., and Kang, S.: Changing Northern Hemisphere snow seasons, J. Climate, 23, 5305–5310, 2010.
Déry, S. J. and Brown, R. D.: Recent Northern Hemisphere snow cover extent trends and implications for the snow-albedo feedback, Geophys. Res. Lett., 34, L22504, doi:10.1029/2007GL031474, 2007.
25
Dong, A., Guo, H., Wang, L., and Liang, T.: A CEOF analysis on variation about yearly snow days in Northern Xinjiang in recent 40 years, Plateau Meteorol., 23, 936–940, 2004.
Dong, W., Wei, Z., and Fan, J.: Climatic character analysis of snow disasters in east Qinghai-Xizang Plateau livestock farm, Plateau Meteorol., 20, 402–406, 2001.
Dyer, J. L. and Mote, T. L.: Spatial variability and trends in observed snow depth over North 30
HESSD
12, 4471–4506, 2015Variability in snow cover phenology in China from 1952 to
2010
C. Q. Ke et al.
Title Page
Abstract Introduction
Conclusions References
Tables Figures
◭ ◮
◭ ◮
Back Close
Full Screen / Esc
Printer-friendly Version
Interactive Discussion
Discussion
P
a
per
|
Discussion
P
a
per
|
Discussion
P
a
per
|
Discussion
P
a
per
|
Fang, S., Qi, Y., Han, G., Zhou, G., and Cammarano, D.: Meteorological drought trend in winter and spring from 1961 to 2010 and its possible impacts on wheat in wheat planting area of China, Sci. Agricul. Sin., 47, 1754–1763, 2014.
Gao, H.: China’s snow disaster in 2008, who is the principal player?, Int. J. Climatol., 29, 2191– 2196, 2009.
5
Gong, D. Y., Wang, S. W., and Zhu, J. H.: East Asian winter monsoon and Arctic oscillation, Geophys. Res. Lett., 28, 2073–2076, 2001.
Groisman, P. Y., Karl, T. R., and Knight, R. W.: Observed impact of snow cover on the heat-balance and the rise of continental spring temperatures, Science, 263, 198–200, 1994. Hantel, M., Ehrendorfer, M., and Haslinger, A.: Climate sensitivity of snow cover duration in 10
Austria, Int. J. Climatol., 20, 615–640, 2000.
Hao, L., Wang, J., Man, S., and Yang, C.: Spatio-temporal change of snow disaster and analysis of vulnerability of animal husbandry in China, J. Nat. Disaster, 11, 42–48, 2002.
Jeong, J. H. and Ho, C. H.: Changes in occurrence of cold surges over East Asia in association with Arctic oscillation, Geophys. Res. Lett., 32, L14704, doi:10.1029/2005GL023024, 2005. 15
Ji, Z. and Kang, S.: Projection of snow cover changes over China under RCP scenarios, Clim. Dynam., 41, 589–600, 2013.
Ke, C. Q. and Li, P. J.: Spatial and temporal characteristics of snow cover over the Tibetan plateau, Acta Geogr. Sin., 53, 209–215, 1998.
Ke, C. Q. and Liu, X.: MODIS-observed spatial and temporal variation in snow cover in Xinjiang, 20
China, Clim. Res., 59, 15–26, 2014.
Ke, C. Q., Yu, T., Yu, K., Tang, G. D., and King, L.: Snowfall trends and variability in Qinghai, China, Theor. Appl. Climatol., 98, 251–258, 2009.
Kuhlman, K. L. and Igúzquiza, E. P.: Universal cokriging of hydraulic heads accounting for boundary conditions, J. Hydrol., 384, 14–25, 2010.
25
Lehning, M., Grünewald, T., and Schirmer, M.: Mountain snow distribution governed by an altitudinal gradient and terrain roughness, Geophys. Res. Lett., 38, L19504, doi:10.1029/2011GL048927, 2011.
Li, D., Liu, Y., Yu, H., and Li, Y.: Spatial–temporal variation of the snow cover in Heilongjiang Province in 1951–2006, J. Glaciol. Geocrol., 31, 1011–1018, 2009.
30
HESSD
12, 4471–4506, 2015Variability in snow cover phenology in China from 1952 to
2010
C. Q. Ke et al.
Title Page
Abstract Introduction
Conclusions References
Tables Figures
◭ ◮
◭ ◮
Back Close
Full Screen / Esc
Printer-friendly Version
Interactive Discussion
Discussion
P
a
per
|
Discussion
P
a
per
|
Discussion
P
a
per
|
Discussion
P
a
per
Li, L. Y. and Ke, C. Q.: Analysis of spatiotemporal snow cover variations in Northeast China based on moderate-resolution-imaging spectroradiometer data, J. Appl. Remote Sens., 8, 084695, doi:10.1117/1.JRS.8.084695, 2014.
Li, P. J.: A preliminary study of snow mass variations over past 30 years in China, Acta Geogr. Sin., 48, 433–437, 1990.
5
Li, P. J.: Dynamic characteristic of snow cover in western China, Acta Meteorol. Sin., 48, 505– 515, 1993.
Li, P. J. and Mi, D.: Distribution of snow cover in China, J. Glaciol. Geocrol., 5, 9–18, 1983. Liang, T. G., Huang, X. D., Wu, C. X., Liu, X. Y., Li, W. L., Guo, Z. G., and Ren, J. Z.: An
application of MODIS data to snow cover monitoring in a pastoral area: a case study in 10
Northern Xinjiang, China, Remote Sens. Environ., 112, 1514–1526, 2008.
Liu, Y., Ren, G., and Yu, H.: Climatology of snow in China, Sci. Geogr. Sin., 32, 1176–1185, 2012.
Llasat, M. C., Turco, M., Quintana-Seguí, P., and Llasat-Botija, M.: The snow storm of 8 March 2010 in Catalonia (Spain): a paradigmatic wet-snow event with a high societal impact, Nat. 15
Hazards Earth Syst. Sci., 14, 427–441, doi:10.5194/nhess-14-427-2014, 2014.
Lü, J. M., Ju, J. H., Kim, S. J., Ren, J. Z., and Zhu, Y. X.: Arctic Oscillation and the autumn/winter snow depth over the Tibetan Plateau, J. Geophys. Res., 113, D14117, doi:10.1029/2007JD009567, 2008.
Ma, L. and Qin, D.: Temporal-spatial characteristics of observed key parameters of snow cover 20
in China during 1957–2009, Sci. Cold Arid Reg., 4, 384–393, 2012.
Marty, C.: Regime shift of snow days in Switzerland, Geophys. Res. Lett., 35, L12501, doi:10.1029/2008GL033998, 2008.
Morán-Tejeda, E., López-Moreno, J. I., and Beniston, M.: The changing roles of temperature and precipitation on snowpack variability in Switzerland as a function of altitude, Geophys. 25
Res. Lett., 40, 2131–2136, 2013.
Pederson, G. T., Betancourt, J. L., and Gregory, J. M.: Regional patterns and proximal causes of the recent snowpack decline in the Rocky Mountains, U. S., Geophys. Res. Lett., 40, 1811–1816, 2013.
Peings, Y., Brun, B., Mauvais, V., and Douville, H.: How stationary is the relationship between 30
HESSD
12, 4471–4506, 2015Variability in snow cover phenology in China from 1952 to
2010
C. Q. Ke et al.
Title Page
Abstract Introduction
Conclusions References
Tables Figures
◭ ◮
◭ ◮
Back Close
Full Screen / Esc
Printer-friendly Version
Interactive Discussion
Discussion
P
a
per
|
Discussion
P
a
per
|
Discussion
P
a
per
|
Discussion
P
a
per
|
Peng, S., Piao, S., Ciais, P., Fang, J., and Wang, X.: Change in winter snow depth and its impacts on vegetation in China, Glob. Change Biol., 16, 3004–3013, 2010.
Peng, S., Piao, S., Ciais, P., Friedlingstein, P., Zhou, L., and Wang, T.: Change in snow phenol-ogy and its potential feedback to temperature in the Northern Hemisphere over the last three decades, Environ. Res. Lett., 8, 014008, doi:10.1088/1748-9326/8/1/014008, 2013.
5
Qin, D., Liu, S., and Li, P.: Snow cover distribution, variability, and response to climate change in western China, J. Climate, 19, 1820–1833, 2006.
Ren, G. Y., Guo, J., Xu, M. Z., Chu, Z. Y., Zhang, L., Zou, X. K., Li, Q. X., and Liu, X. N.: Climate changes of China’s mainland over the past half century, Acta Meteorol. Sin., 63, 942–956, 2005.
10
Robinson, D. A. and Dewey, K. F.: Recent secular variations in the extent of Northern Hemi-sphere snow cover, Geophys. Res. Lett., 17, 1557–1560, 1990.
Scherrer, S. C., Appenzeller, C., and Laternser, M.: Trends in Swiss Alpine snow days: the role of local- and large-scale climate variability, Geophys. Res. Lett., 31, L13215, doi:10.1029/2004GL020255, 2004.
15
Serquet, G., Marty, C., Dulex, J. P., and Rebetez, M.: Seasonal trends and temperature depen-dence of the snowfall/precipitation-day ratio in Switzerland, Geophys. Res. Lett., 38, L07703, doi:10.1029/2011GL046976, 2011.
Shi, Y., Gao, X., Wu, J., and Giorgi, F.: Changes in snow cover over China in the 21st century as simulated by a high resolution regional climate model, Environ. Res. Lett., 6, 045401, 20
doi:10.1088/1748-9326/6/4/045401, 2011.
Tang, X., Yan, X., Ni, M., and Lu, Y.: Changes of the snow cover days on Tibet Plateau in last 40 years, Acta. Geogr. Sin., 67, 951–959, 2012.
Thompson, D. W. J. and Wallace, J. M.: The Arctic oscillation signature in the wintertime geopo-tential height and temperature fields, Geophys. Res. Lett., 25, 1297–1300, 1998.
25
Thompson, D. W. J., Wallace, J. M., and Hegerl, G. C.: Annular modes in the extratropical circulation, part II: Trends, J. Climate, 13, 1018–1036, 2000.
Wang, C. and Li, D.: Spatial–temporal variations of the snow cover days and the maximum depth of snow cover in China during recent 50 years, J. Glaciol. Geocrol., 34, 247–256, 2012.
30
HESSD
12, 4471–4506, 2015Variability in snow cover phenology in China from 1952 to
2010
C. Q. Ke et al.
Title Page
Abstract Introduction
Conclusions References
Tables Figures
◭ ◮
◭ ◮
Back Close
Full Screen / Esc
Printer-friendly Version
Interactive Discussion
Discussion
P
a
per
|
Discussion
P
a
per
|
Discussion
P
a
per
|
Discussion
P
a
per
Wang, J., Li, H., and Hao, X.: Responses of snowmelt runoffto climatic change in an inland river basin, Northwestern China, over the past 50 years, Hydrol. Earth Syst. Sci., 14, 1979–1987, doi:10.5194/hess-14-1979-2010, 2010.
Wang, L., Gao, G., Zhang, Q., Sun, J. M., Wang, Z. Y., Zhao, Y., Zhao, S. S., Chen, X. Y., Chen, Y., Wang, Y. M., Chen, L. J., and Gao, H.: Characteristics of the extreme low-temperature, 5
heavy snowstorm and freezing disasters in January 2008 in China, Meteorol. Mon., 34, 95– 100, 2008.
Wang, Q., Zhang, C., Liu, J., and Liu, W.: The changing tendency on the depth and days of snow cover in Northern Xinjiang, Adv. Clim. Change Res., 5, 39–43, 2009b.
Wang, W., Liang, T., Huang, X., Feng, Q., Xie, H., Liu, X., Chen, M., and Wang, X.: Early 10
warning of snow-caused disasters in pastoral areas on the Tibetan Plateau, Nat. Hazards Earth Syst. Sci., 13, 1411–1425, doi:10.5194/nhess-13-1411-2013, 2013.
Wu, B. Y. and Wang, J.: Winter Arctic oscillation, Siberian high and East Asian winter monsoon, Geophys. Res. Lett., 29, 1897, doi:10.1029/2002GL015373, 2002.
Xi, Y., Li, D., and Wang, W.: Study of the temporal-spatial characteristics of snow covers days 15
in Hetao and its vicinity, J. Glaciol. Geocrol., 31, 446–456, 2009.
Xu, L., Li, D., and Hu, Z.: Relationship between the snow cover day and monsoon index in Tibetan Plateau, Plateau Meterol., 29, 1093–1101, 2010.
Yang, H., Yang, D., Hu, Q., and Lv, H.: Spatial variability of the trends in climatic variables across China during 1961–2010, Theor. Appl. Climatol., 120, 773–783, 2015.
20
Yao, T., Thompson, L., Yang, W., Yu, W., Gao, Y., Guo, X., Yang, X., Duan, K., Zhao, H., Xu, B., Pu, J., Lu, A., Xiang, Y., Kattel, D. B., and Joswiak, D.: Different glacier status with atmo-spheric circulations in Tibetan Plateau and surroundings, Nature Clim. Change, 2, 663–667, 2012.
Ye, H. and Ellison, M.: Changes in transitional snowfall season length in northern Eurasia, 25
Geophys. Res. Lett., 30, 1252, doi:10.1029/2003GL016873, 2003.
You, Q., Kang, S., Ren, G., Fraedrich, K., Pepin, N., Yan, Y., and Ma, L.: Observed changes in snow depth and number of snow days in the eastern and central Tibetan Plateau, Clim. Res., 46, 171–183, 2011.
Zhang, T.: Influence of the seasonal snow cover on the ground thermal regime: an overview, 30
HESSD
12, 4471–4506, 2015Variability in snow cover phenology in China from 1952 to
2010
C. Q. Ke et al.
Title Page
Abstract Introduction
Conclusions References
Tables Figures
◭ ◮
◭ ◮
Back Close
Full Screen / Esc
Printer-friendly Version
Interactive Discussion
Discussion
P
a
per
|
Discussion
P
a
per
|
Discussion
P
a
per
|
Discussion
P
a
per
|
Table 1.Percentage (%) of stations with anomalies (P for positive and N for negative) of snow cover day (SCD), snow cover onset date (SCOD), and snow cover end date (SCED), and percentage (%) of stations with anomalies of SCD, SCOD, and SCED larger (smaller) than the mean±one or two SDs (1 SD or 2 SD), with the bold number denoting extremely heavy-snow or light-snow years for the SCD, and extremely delayed or early (for SCOD or SCED) years, for China.
SCD SCOD SCED
Year P 1SD 2SD −2SD −1SD N P 1SD 2SD −2SD −1SD N P 1SD 2SD −2SD −1SD N 1952 33 5 0 12 31 67 67 39 21 2 12 33 57 17 2 11 16 43
1953 30 6 0 3 34 70 40 8 2 2 18 60 39 9 1 9 17 61 1954 59 29 11 0 8 41 36 8 4 1 17 64 57 12 0 0 9 43
1955 80 48 29 1 5 20 35 8 3 1 24 65 78 21 2 1 5 22 1956 48 11 0 0 4 52 70 20 2 0 8 30 62 23 1 2 12 38
1957 85 64 29 0 3 15 25 5 1 0 14 75 85 35 5 1 4 15 1958 45 15 4 0 14 55 46 17 0 0 19 54 51 16 3 3 17 49 1959 27 6 1 4 23 73 55 27 9 1 17 45 57 22 3 1 5 43 1960 37 12 2 0 15 63 47 10 2 2 13 53 60 25 5 4 17 40 1961 34 7 1 1 19 66 24 9 2 1 28 76 29 6 1 9 28 71 1962 40 10 3 0 10 60 43 13 4 2 10 57 60 18 3 0 11 40 1963 24 5 1 1 25 76 33 13 5 1 26 67 52 14 0 8 16 48
1964 77 39 11 0 1 23 30 3 1 4 23 70 66 17 1 0 5 34
HESSD
12, 4471–4506, 2015Variability in snow cover phenology in China from 1952 to
2010
C. Q. Ke et al.
Title Page
Abstract Introduction
Conclusions References
Tables Figures
◭ ◮
◭ ◮
Back Close
Full Screen / Esc
Printer-friendly Version
Interactive Discussion
Discussion
P
a
per
|
Discussion
P
a
per
|
Discussion
P
a
per
|
Discussion
P
a
per
Table 1.Continued.
SCD SCOD SCED
Year P 1SD 2SD −2SD −1SD N P 1SD 2SD −2SD −1SD N P 1SD 2SD −2SD −1SD N 1978 58 21 8 0 2 42 45 13 2 2 12 55 53 10 1 0 8 47 1979 41 9 1 0 7 59 43 10 1 0 18 57 78 25 2 0 4 22 1980 39 11 1 0 5 61 43 9 1 1 16 57 82 28 2 0 3 18 1981 42 12 2 0 12 58 48 21 4 2 17 52 44 13 1 2 14 56 1982 39 11 1 1 15 61 25 9 2 0 29 75 58 24 6 6 16 42 1983 48 19 6 0 15 52 45 14 1 1 11 55 65 25 2 1 10 35 1984 27 10 2 1 28 73 69 33 16 0 5 31 46 8 1 2 13 54 1985 68 25 3 0 3 32 31 8 1 1 23 69 48 9 2 1 8 52 1986 49 14 2 0 13 51 33 5 1 1 19 67 61 17 3 4 12 39 1987 66 22 4 0 4 34 39 6 1 2 15 61 62 26 3 1 8 38 1988 56 16 1 0 2 44 23 6 1 3 29 77 71 25 0 1 7 29 1989 48 19 4 0 11 52 70 28 7 1 6 30 43 5 1 3 17 57 1990 56 19 2 0 6 44 50 9 1 0 8 50 49 11 1 2 10 51 1991 33 4 0 2 10 67 60 24 5 0 3 40 73 26 3 1 4 27 1992 52 14 3 1 7 48 55 17 5 0 4 45 52 14 1 5 18 48 1993 59 18 2 1 4 41 45 9 1 0 16 55 48 17 2 2 21 52 1994 59 18 2 0 4 41 27 6 2 1 25 73 41 11 0 3 17 59 1995 34 10 3 3 19 66 58 23 3 1 15 42 48 8 1 8 20 52
1996 26 7 2 2 22 74 72 30 4 0 4 28 56 10 1 2 14 44
1997 35 3 0 1 18 65 46 16 3 2 12 54 18 4 2 9 50 82
1998 33 7 2 3 17 67 39 12 3 1 19 61 32 11 1 7 25 68
1999 24 4 1 1 35 76 59 23 12 1 7 41 51 13 2 7 16 49 2000 63 16 4 0 5 37 60 18 2 0 9 40 37 6 0 4 22 63 2001 67 28 7 0 5 33 38 15 1 1 22 62 42 17 1 3 15 58
2002 17 2 0 5 31 83 57 21 4 1 5 43 32 6 0 12 30 68 2003 58 28 4 1 8 42 35 5 1 0 20 65 52 9 1 6 18 48
2004 33 3 1 0 17 67 43 12 2 1 25 57 30 7 1 12 35 70
2005 61 20 1 0 4 39 47 15 2 0 12 53 35 4 0 2 19 65
2006 49 11 2 0 8 51 72 32 7 0 5 28 59 15 0 1 10 41 2007 28 5 1 0 23 72 68 24 5 1 5 32 28 3 1 9 28 72 2008 46 21 5 3 19 54 69 27 6 0 8 31 42 9 1 4 23 58
2009 23 5 0 1 32 77 73 23 9 0 4 27 29 4 0 3 25 71
HESSD
12, 4471–4506, 2015Variability in snow cover phenology in China from 1952 to
2010
C. Q. Ke et al.
Title Page
Abstract Introduction
Conclusions References
Tables Figures
◭ ◮
◭ ◮
Back Close
Full Screen / Esc
Printer-friendly Version
Interactive Discussion
Discussion
P
a
per
|
Discussion
P
a
per
|
Discussion
P
a
per
|
Discussion
P
a
per
|
Table 2.The same as Table 1, but only for the SCD and only for the three major stable snow regions: Northeast China, North Xinjiang and the Tibetan Plateau.
Northeast China North Xinjiang Tibetan Plateau
Year P 1SD 2SD −2SD −1SD N P 1SD 2SD −2SD −1SD N P 1SD 2SD −2SD −1SD N 1957 98 20 54 0 0 2 20 0 0 30 0 80 77 12 42 4 0 23 1959 1 0 0 58 14 99 89 0 44 0 0 11 45 3 15 5 0 55 1960 42 1 15 24 0 58 100 26 58 0 0 0 22 0 0 29 2 78 1963 13 0 0 35 5 87 24 0 0 19 5 76 22 0 0 27 0 78 1965 68 1 23 13 1 32 24 0 0 38 0 76 13 0 4 42 4 87
1967 20 0 0 43 13 80 75 0 20 10 0 25 26 0 7 14 0 74 1969 23 0 3 26 14 77 75 0 30 5 0 25 3 0 0 47 5 97
HESSD
12, 4471–4506, 2015Variability in snow cover phenology in China from 1952 to
2010
C. Q. Ke et al.
Title Page
Abstract Introduction
Conclusions References
Tables Figures
◭ ◮
◭ ◮
Back Close
Full Screen / Esc
Printer-friendly Version
Interactive Discussion
Discussion
P
a
per
|
Discussion
P
a
per
|
Discussion
P
a
per
|
Discussion
P
a
per
Table 3. Number of stations with SCD, SCOD, and SCED trends, number of stations with relationships of SCD, SCOD, and SCED, respectively, with TBZD, number of stations with re-lationship between SCD and MAT, and number of stations with rere-lationship between SCD and AO. All of them have two significance levels, the 90 and 95%.
SCD SCOD SCED
95% 90% Ia 95% 90% Ia 95% 90% Ia
Trend P 18 35 136 93 136 124 1 2 43
N 38 54 127 13 23 69 92 138 169
TBZD P 156 193 137 0 2 63 85 115 203
N 0 0 22 64 93 194 0 2 32
MAT P 0 2 30
N 129 171 149
AO P 35 87 77
N 33 82 106
HESSD
12, 4471–4506, 2015Variability in snow cover phenology in China from 1952 to
2010
C. Q. Ke et al.
Title Page
Abstract Introduction
Conclusions References
Tables Figures
◭ ◮
◭ ◮
Back Close
Full Screen / Esc
Printer-friendly Version
Interactive Discussion
Discussion
P
a
per
|
Discussion
P
a
per
|
Discussion
P
a
per
|
Discussion
P
a
per
|
Table 4.Abbreviations.
Snow Cover Day SCD
Snow Cover Onset Date SCOD
Snow Cover End Date SCED
Days with Temperature Below 0◦C TBZD
Mean Air Temperature MAT
HESSD
12, 4471–4506, 2015Variability in snow cover phenology in China from 1952 to
2010
C. Q. Ke et al.
Title Page
Abstract Introduction
Conclusions References
Tables Figures
◭ ◮
◭ ◮
Back Close
Full Screen / Esc
Printer-friendly Version
Interactive Discussion
Discussion
P
a
per
|
Discussion
P
a
per
|
Discussion
P
a
per
|
Discussion
P
a
per
|
HESSD
12, 4471–4506, 2015Variability in snow cover phenology in China from 1952 to
2010
C. Q. Ke et al.
Title Page
Abstract Introduction
Conclusions References
Tables Figures
◭ ◮
◭ ◮
Back Close
Full Screen / Esc
Printer-friendly Version
Interactive Discussion
Discussion
P
a
per
|
Discussion
P
a
per
|
Discussion
P
a
per
|
Discussion
P
a
per
|
HESSD
12, 4471–4506, 2015Variability in snow cover phenology in China from 1952 to
2010
C. Q. Ke et al.
Title Page
Abstract Introduction
Conclusions References
Tables Figures
◭ ◮
◭ ◮
Back Close
Full Screen / Esc
Printer-friendly Version
Interactive Discussion
Discussion
P
a
per
|
Discussion
P
a
per
|
Discussion
P
a
per
|
Discussion
P
a
per
Figure 5.Trends of annual mean SCDs(a), SCOD(b), and SCED(c)from the 352 stations of more than ten annual mean SCDs with Mann–Kendall test, and relationships among the SCD and day with temperature below 0◦C (TBZD)(d), mean air temperature (MAT)(e), and Arctic