ECG Analysis based on Wavelet Transform
and Modulus Maxima
Mourad Talbi1, Akram Aouinet2, Riadh Baazaoui3 and Adnane Cherif4
1 High School of Applied Mathematics and Informatics of Kairouan, University of Kairouan
Kairouan, Tunisia
2
Faculty of Sciences of Tunis, University Tunis El-Manar Tunis, 1060, Tunisia
3
Faculty of Sciences of Tunis , University Tunis El-Manar Tunis, 1060, Tunisia
4
Faculty of Sciences of Tunis , University Tunis El-Manar Tunis, 1060, Tunisia
Abstract
In this paper, we have developed a new technique of P, Q, R, S and T Peaks detection using Wavelet Transform (WT) and Modulus maxima. One of the commonest problems in electrocardiogram (ECG) signal processing, is baseline wander removal suppression. Therefore we have removed the baseline wander in order to make easier the detection of the peaks P and T. Those peaks are detected after the QRS detection. The proposed method is based on the application of the discritized continuous wavelet transform (Mycwt) used for the Bionic wavelet transform, to the ECG signal in order to detect R-peaks in the first stage and in the second stage, the Q and S peaks are detected using the R-peaks localization. Finally the Modulus maxima are used in the undecimated wavelet transform (UDWT) domain in order to detect the others peaks (P, T). This detection is performed by using a varying-length window that is moving along the whole signal. For evaluating the proposed method, we have compared it to others techniques based on wavelets. In this evaluation, we have used many ECG signals taken from MIT-BIH database. The obtained results show that the proposed method outperforms a number of conventional techniques used for our evaluation.
Keywords: Baseline drift, Continuous Wavelet Transform, Electrocardiogram, Modulus maxima, Thresholds, Window analysis.
1. Introduction
The electrocardiogram is the electrical activity signal of the heart. This activity is measured and recorded for more than a hundred years. The ECG analysis has been widely used for many cardiac diseases diagnosing. The ECG is a graphic record of the magnitude and detection of the electrical activity that is
generated by depolarization and repolarization of the ventricles and atria. In an ECG signal, one cardiac cycle consists of the P-QRS-T waves. The majority of the clinically useful information in the ECG is found in the amplitudes and intervals defined by its features (characteristics wave peaks and time durations). The development of quick and accurate techniques for automatic ECG feature extraction is of major importance, principally for the analysis of long recordings (Holters and ambulatory systems) [1]. In effect, the detection of the beats is necessary for heart rate determination and several related arrhythmias such as Bradycardia, Tachycardia and Heart Rate Variation; it is also necessary for further signal processing in order to detect abnormal beats [2]. The ECG feature extraction system provides fundamental features (amplitudes and intervals) to be used in subsequent automatic analysis.
2. Materials
2.1 Wavelet Transform
The theory of the wavelet transform (WT) is based on signal processing and developed from the Fourier transform basis. The wavelet transform is expressed as a series of functions which are related with each other by translation and simple scaling. The original WT function is called mother wavelet [5, 6] and is employed for generating all basis functions. A set of functions is constructed by scaling and shifting the mother wavelet . Those functions are expressed as follow:
, √
(1)
where
a ∈ IR
, b ∈ IR
andb ∈ IR
.
The original signal can be reconstructed by an appropriate integration and this is performed after projecting the given signal on a continuous family of frequency bands. The continuous wavelet transform (CWT) of a signal is given by:
, √ ∗ (2) where the superscript is the complex conjugate and ψ∗, represents a translated and scaled complex conjugated mother wavelet.
The mother wavelet is invertible when it verifies the condition of admissibility which is stated as:
∞
(3)Many mother wavelets are used for computing the wavelet transform and Morlet is one of them. It is expressed as follow [7]:
∙ (4) where and are respectively a bandwidth parameter and a wavelet center frequency.
2.1 Modulus maxima
Wavelet modulus maxima are used for location characterizing singularities in the signal. is the wavelet transform of a function .
Any point such that has a zero
crossing at is called a local extremum; when varies.
Any point such that
|
|
|
|
when belongs to the other side of the neighbourhood of , and|
|
|
|
when belongs to either a right or left neighborhood of is called modulus maximum.Any corrected curve in the scale space along which all points are modulus maxima is called maxima line [8].
2.2 Database
The data available from MIT-BIH Arrhythmia Database [9] is the standard used by many researchers. The MIT-BIH database contains many data sets of electrocardiogram signals, mostly abnormal or unhealthy electrocardiograms, but it also contains normal electrocardiograms that can be used as a reference base [10]. This contains two lead ECG signals of 48 patients. The selected Arrhythmias are Premature Atria Beat (PAB), Premature Ventricular Beat (PVB), Right Bundle Branch Block (RBBB), and Left Bundle Branch Block (LBBB).
3. The proposed detection method
In this section, we have developed and evaluated a new detection method of P, Q, R, S and T Peaks. All the steps of the proposed technique are given as follow:
Step1: We apply the bionic wavelet transform (BWT) to the input ECG signal.
Step2: We smooth the bionic wavelet coefficients: each bionic wavelet coefficient is smoothed by using recTI.
Step3: We apply the inverse of the BWT to the smoothed bionic wavelet coefficients in order to obtain the smoothed ECG signal.
Step4: We apply the modified continuous wavelet transform (MMycwt) to the smoothed ECG signal. In this work we have modified Mycwt according to characteristics of the ECG signal in order to obtain the MMycwt. Note that the Mycwt is the descritized continuous wavelet transform used for the Bionic Wavelet Transform (BWT).
Step6: We use R-peaks for Q and S detection and this is performed by using the method of Mahmoodabadi et al [1]. This technique consists in searching for minimum of the signal about the R-peak within 0.1 second and this for detecting the Q and S peaks.
Step7: We suppress baseline wander removal in order to make easier the detection of P and T peaks.
Step8: We use a varying-length window that is moving along the whole signals (start window = S, end window = Q ).
Step9: Reduce the length of each window by eliminating the S and Q waves in order to make easier the detection of T and P waves.
Step10: The T and P waves are small in amplitudes so we increase the amplitude of the waves T and P by multiplying only the positive samples of them by an appropriate factor. This is done for the purpose to use a multi-scale product in Undecimated Discret Wavelet Transform (UDWT) domain.
Step11: We Apply the Undecimated Discret Wavelet Transform (UDWT) to each modified varying-length window.
Step12: Compute a Multi-scale product.
Step13: We take the modulus maxima of the obtained multi-scale product in order to detect P and T waves.
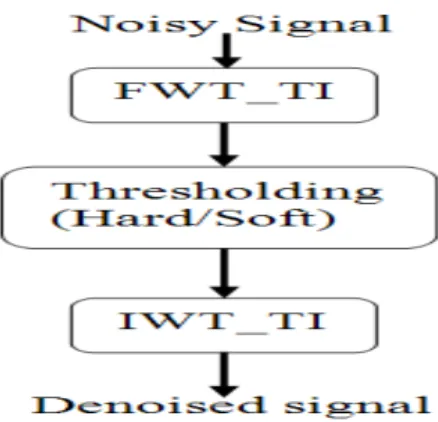
Step1, Step2 and Step3 constitute a new proposed technique of ECG denoising. As previously mentioned, we apply the procedure recTI to each noisy bionic wavelet coefficient in order to smooth it. The noisy bionic wavelet coefficients are obtained from the application of the BWT to the noisy ECG signal. Smoothing using the Translation-Invariant procedure (recTI), consists in applying threshold on the Forward Wavelet Transform Translation Invariant (FWT_TI) coefficients [11]. Fig. 1 summarizes the main steps of the smoothing procedure, recTI.
Fig. 1 Procedure smoothing by recTI.
All the previously mentioned steps of the proposed ECG peaks detection method are summarized in fig. 2.
input ECG signal
Preprocessing Stage
Smoothed ECG signal
Bionic Wavelet Transform (BWT)
Bionic Wavelet coefficients Smoothing
Detection Stage
Fig. 2 A process of the proposed P, Q, R, S, and T wave detection.
3.1 Modified Mycwt (MMycwt)
For an ECG signal, the most important feature is the frequency range in which its main components occur [12]. Despite the existence of some other components like VLPs, we are interested in this paper in P, Q, R, S and T waves such as in the reference [12]. In references [13, 14], the value of (the initial center frequency of the mother
wavelet) is equal to 15165.4Hz. As the scale increases, the center frequency goes smaller and smaller in the following way:
⁄ , , , , … (5)
We do not need such high frequency for ECG signals. Omid et al [12] have optimized the value of by running the program for different values of and then minimizing the gradient of error variance by comparing the results numerically and morphologically with each other. It has been found that if belongs to the range of 360 to 500Hz there would be no much distortion on the analyzed ECG signals [12]. In their work, Omid et al [15] have chosen 400Hz as the value of . Hence, in our work, we have chosen in order to obtain the MMycwt. This choice of yields satisfactory results. In this paper, we have chosen the value 1.1623 as that of such as in the reference [13, 14].
3.2 Hard thresholding
After applying the MMycwt to the input ECG signal, the fourth wavelet coefficient is thresholded using hard thresholding:
Then
The threshold is selected to be:
(6)
where is an appropriate positive parameter less than 1.
3.3 Baseline wander removal
One of the commonest problems in ECG signal processing is baseline wander removal and noise suppression, which determine posterior signal process. The amplitude of a wave is measured with reference to the ECG baseline level.
Fig. 3 Baseline corrected.
2 4 6 8 10 12
800 900 1000 1100 1200
2 4 6 8 10 12
-100 0 100 200
Base line correct Hard thresholding
Varying‐length window ( )
Modulus maxima of a
multi‐scale product
R wave detection
Q‐S Detection
UDWT
P and T waves detection
Increase the amplitude of the waves and by multiplying them by an
appropriate factor
Mult‐scale product Reduce the length of each window by eliminating the
and waves Searching for minimum of the
3.4 Varying-length window
After R-peaks, Q-peaks and S-peaks detection, we apply a varying-length window that is moving along the whole signals:
Window 1:
[S
1, Q
2]
Window 2:
[S
2, Q
3]
……
……
Window N:
[S
N, Q
N+1]
Each of those windows is modified by reducing its length and this is done by eliminating the S and Q waves. Then we have increased the amplitude of the waves T and P by multiplying only the positive samples of them by an appropriate factor.
3.5. Undecimated Wavelet Transform and modulus maxima
Finally, we have applied the Undecimated Discret Wavelet Transform (UDWT) to each modified varying-length window in order to compute the multi-scale product and then compute its modulus maxima as in [15] in order to detect the P and T peaks. The multi-scale product is calculated from the product of undecimated wavelet coefficients of successive scales (scale1, scale2 and scale3). The undecimated wavelet coefficients are obtained from Undecimated Discret Wavelet Transform (UDWT) application to each modified frame.
(a)
(b)
Fig. 4 (a) Original ECG signal (b) Positions of P, Q, R, S, and T peaks.
4. Results
The proposed algorithm has been validated on the MIT-BIH arrhythmia database to evaluate the P, QRS, and T detection. The database consists of 48 recording; we use 46 half-hour recordings for a total 23 hours of ECG data. In first stage the positions of the R peaks have been detected and marked on the original signal. Fig. 5 shows some examples of ECG signal (color in blue) and the detection of R-peaks (in red color).
(a)
(b)
0 200 400 600 800 1000 1200 1400 1600 1800
-0.4 -0.2 0 0.2 0.4 0.6 0.8 1
0 200 400 600 800 1000 1200 1400 1600 1800
-0.4 -0.2 0 0.2 0.4 0.6 0.8 1
5 10 15 20 25
900 950 1000 1050 1100 1150 1200 1250
ECG100
5 10 15 20 25
950 1000 1050 1100 1150 1200 1250 1300
(c)
Fig. 5 Positioned R-peaks in ECG signal (a) ECG100, (b) ECG101, (c) ECG106.
Fig. 6 shows some examples of ECG signal (in blue color) and the Positioned P, Q, R, S, and T peaks (in red color).
(a)
(b)
(c)
Fig. 6. Positioned P, Q, R, S, and T peaks in ECG signal (a)ECG100, (b)ECG106, (c)ECG105.
5 10 15 20 25
900 1000 1100 1200 1300 1400 1500
ECG106
0
500
1000
1500
-0.5
0
0.5
1
0
500
1000
1500
-0.5
0
0.5
1
detection of pics (ECG100)
0 200 400 600 800 1000 1200 1400 1600 1800 2000 -0.5
0 0.5 1
0 200 400 600 800 1000 1200 1400 1600 1800 2000 -0.5
0 0.5 1
detection of pics (ECG106)
0 200 400 600 800 1000 1200 1400
-0.2 0 0.2 0.4 0.6 0.8
0 200 400 600 800 1000 1200 1400
-0.2 0 0.2 0.4 0.6 0.8
The proposed algorithm detection achieves very good detection performance. This algorithm attains sensitivity (Se) of 99.94 % and a positive predictivity (P+) of 99.94%. The sensitivity Se is defined as the probability that a sick patient to be detected:
(7)
The positive predictivity is given by:
(8) where TP is the number of beats correctly
identified, FN the number of false detections, and FP the number of false positive misdetections.
Table 1 reports the obtained results from Sensitivity (Se) and positive predictivity (P+) computation by using the proposed detection technique.
Table 1: Sensitivity (Se) and Positive Predictivity (P+
) Results obtained from the proposed detection technique application.
Signal Records are chosen form MIT-BIH Database.
Table 2 reports the results obtained from Sensitivity (Se), positive, predictivity (P+) and %error computation by using the proposed detection technique and some others techniques used for evaluation. %error is expressed as follow:
% (9) Tape
(N°)
Total N° bea ts
FP beats
FN beats
P+ (%)
Se
(%)
100 2273 0 0 100 100
101 1865 0 0 100 100
102 2187 0 0 100 100
103 2084 0 0 100 100
104 2230 1 0 99.95 100
105 2572 0 0 100 100
106 2027 0 0 100 100
107 2137 0 1 100 99.95
108 1763 13 21 99.26 98.82
109 2563 0 0 100 100
111 2124 0 0 100 100
112 2539 0 0 100 100
113 1795 0 0 100 100
114 1879 0 0 100 100
115 1953 0 0 100 100
116 2412 0 0 100 100
117 1535 0 0 100 100
118 2275 0 0 100 100
119 1987 0 0 100 100
121 1863 3 0 99.83 100
122 2476 0 0 100 100
123 1518 0 0 100 100
124 1619 0 0 100 100
200 2601 0 4 100 99.84
201 1963 0 0 100 100
202 2136 0 0 100 100
203 2982 3 0 99.89 100
205 2656 0 0 100 100
208 2956 2 0 99.93 100
209 3004 0 0 100 100
210 2647 3 0 99.88 100
212 2748 0 0 100 100
213 3251 0 0 100 100
214 2262 0 0 100 100
215 3363 0 2 100 99.94
217 2208 0 0 100 100
219 2154 0 0 100 100
220 2048 0 0 100 100
221 2427 0 0 100 100
222 2484 7 0 99.71 100
223 2605 0 0 100 100
228 2053 24 19 98.84 99.08
230 2256 0 0 100 100
Table. 2: R wave’s detection results on MIT-BIH database.
QRS detector Se % P+ % % error
Arzeno et al.[16]
99.29 99.57 98.07 99.24 99.59 99.18 1.47 0.84 2.75
Huabin and
Jiankiang [17] 99.68 99.59 0.73
Josko [18] 99.86 99.91 0.23
Mahmoodabadi et
al.[1]
99.18 98 2.82
This work 99.94 99.94 0.12
Those results show clearly that the proposed method outperforms some conventional techniques used in our evaluation.
5. Conclusion
In this paper, we have developed a new method for R-peaks detection using the modified continuous wavelet transform (MMycwt) which is obtained from (Mycwt) used for the bionic wavelet transform (BWT). After detecting the R-peaks, Q and S are detected then the Modulus Maxima is applied to multi-scale product in order to detect P and T waves. This detection is performed frame by frame and each frame is localized between S-peak and Q -peak (S Q ). The multi-scale product is calculated from the product of undecimated wavelet coefficients of successive scales (scale1, scale2 and scale3). The undecimated wavelet coefficients are obtained from Undecimated Discret Wavelet Transform (UDWT) application to each modified frame. For evaluating the proposed method, we have used 46 half-hour recording for a total 23 hours of ECG data, extracted from MIT-BIH arrhythmia database. The advantages of this algorithm are; very fast to implement, easy to execute, and achieves very good detection performance. This algorithm attains Se=99.94% and P+=99.94%.
References
[1] S.Z.Mahmoodabadi, A.Ahmadian, and M.D Abdolhasani, ‘‘ECG Feature Extraction Using Daubechies Wavelets”, Proceedings of the Fifth IASTED International Conference VISUALIZATION, IMAGING, AND IMAGE PROCESSING (VIIP ’05), 2005, pp. 343–348, Benidorm, Spain.
[2] Robert J. Huzar, ‘‘Basic Dysrhythmias Interpretation and Management’’, C.V. Mosby Co., 1988.
[3] Mneimneh MA, Corliss GF, Povinelli RJ, ‘‘A cardiac
electro-physiological model based approach for filtering high frequency ECG noise’’, Computers in Cardiology, 34, 2007, pp. 109-112. [4] LI Yan-jun, Yan Hong, WANG Zeng-li.. “A
Comparative Study on Removal Methods of ECG Baseline Wandering”, Space Medicine and Medical Engineering, 2009-05.
[5] I. Daubechies, ‘‘Ten lectures on Wavelets’’, Philadelphia, Society for industrial and applied Mathematics, 1992.
[6] B. Walczak, ‘‘Wavelets in Chemistry’’, The Netherlands, Elsevier Science, Data Handling in Science and Technology, Volume 22, 2000.
[7] Teolis, A., “Computational signal processing with wavelets”, Springer, Birkhäuser Engineering, 1998. [8] Samar Krimi, kais ouni, and Noureddine Ellouze,
“T-Wave Detection Based on an An Adjusted “T-Wavelet Transform Modulus Maxima”, International Journal of Biological and Life Sciences, v1, 2005, pp. 128-132.
[9]http://www.physionet.org/physiobank/database/SVdb/. MIT-BIH.
[10] Felipe E.Olevera, Jr., and Student Member, IEEE, “Electrocardiogram Wave Feature Extraction Using the Matched Filter”, ECE 510: STATISTICAL SIGNAL PROCESSING II, 2006, pp. 1-6.
[11] Wavelet denoising procedure in matlab, http//:www-ljk.imag.fr/SMS/software/ GaussianWaveDen/. [12] O. Sayadi and M. B. Shamsollahi, Multiadaptive
‘‘Bionic Wavelet Transform: Application to ECG Denoising and Baseline Wandering Reduction’’, EURASIP Journal on Advances in Signal Processing, vol. 2007, pp. Article ID 41274, 2007, 11 pages,. [13] X. Yuan, "Auditory Model-based Bionic Wavelet
Transform for Speech Enhancement", Ph.D. thesis, Lab Milwaukee, Marquette University, City, Wisconsin, May 2003.
[14] Johnson, M.T., Yuan, X. and Ren, Y., ‘‘Speech signal enhancement through adaptive wavelet thresholding’’, Science Direct, Speech Communication, Vol. 49, 2007, pp.123-133.
[15] R. Bessrour, Z. Lachiri, N. Ellouze, “UsingMultiscale Product for ECG Characterization’’, Hindawi Publishing Corporation Research Letters in Signal Processing, 2009, Volume 2009.
[16] N. M. Arzeno, Z.-D. Deng, and C.-S. Poon, “Analysis of first derivative based QRS detection algorithms,” IEEE Transactions on Biomedical Engineering, vol. 55, no. 2, 2008, pp. 478–484. [17] Z. Huabin and W. Jiankang, “Real-time QRS
detection method,” in Proceedings of the 10th International Conference on E-Health Networking, Applications and Services, July 2008, pp. 169–170,. [18] A. Josko, “Discrete wavelet transform in automatic
ECG signal analysis,” in IEEE Instrumentation and Measurement Technology Conference, 2007, Warsaw, Poland, 2007.
PhD Thesis at 2010 from Faculty of Sciences of Tunis, Tunisia, in Electronics. He is actually an assistant professor in high school of applied mathematics and physics of Kairouan and he is a Researcher Member of the Signal Processing Laboratory of Faculty of Sciences of Tunis, Tunisia.
Second Author Aouinet Akram received his master Diploma in electronics from Sciences Faculty of Tunis in 2010.
Third Author Riadh Baazaoui received his Bachelor in 2000 in mathematics from faculty of sciences of Tunis and his master Diploma in applied mathematics in 2003 from Sciences Faculty of Tunis. He is actually in PhD thesis of stochastic analysis particularly the applied mathematics of finance and physics.