www.biogeosciences.net/12/1799/2015/ doi:10.5194/bg-12-1799-2015
© Author(s) 2015. CC Attribution 3.0 License.
Drivers of long-term variability in CO
2
net ecosystem exchange in a
temperate peatland
C. Helfter1, C. Campbell2, K. J. Dinsmore1, J. Drewer1, M. Coyle1, M. Anderson1, U. Skiba1, E. Nemitz1, M. F. Billett1,3, and M. A. Sutton1
1Centre for Ecology and Hydrology (Edinburgh), Penicuik, Scotland, UK 2Scottish Environmental Protection Agency, Stirling, Scotland, UK 3University of Stirling, Stirling, Scotland, UK
Correspondence to:C. Helfter ([email protected])
Received: 15 July 2014 – Published in Biogeosciences Discuss.: 22 October 2014 Revised: 26 February 2015 – Accepted: 2 March 2015 – Published: 18 March 2015
Abstract. Land–atmosphere exchange of carbon dioxide
(CO2) in peatlands exhibits marked seasonal and
inter-annual variability, which subsequently affects the carbon (C) sink strength of catchments across multiple temporal scales. Long-term studies are needed to fully capture the natural variability and therefore identify the key hydrometeorolog-ical drivers in the net ecosystem exchange (NEE) of CO2.
Since 2002, NEE has been measured continuously by eddy-covariance at Auchencorth Moss, a temperate lowland land in central Scotland. Hence this is one of the longest peat-land NEE studies to date. For 11 years, the site was a consis-tent, yet variable, atmospheric CO2sink ranging from−5.2
to−135.9 g CO2-C m−2yr−1(mean of−64.1±33.6 g CO2 -C m−2yr−1). Inter-annual variability in NEE was positively
correlated to the length of the growing season. Mean winter air temperature explained 87 % of the inter-annual variabil-ity in the sink strength of the following summer, indicating an effect of winter climate on local phenology. Ecosystem respiration (Reco) was enhanced by drought, which also
de-pressed gross primary productivity (GPP). The CO2uptake
rate during the growing season was comparable to three other sites with long-term NEE records; however, the emission rate during the dormant season was significantly higher. To sum-marise, the NEE of the peatland studied is modulated by two dominant factors:
– phenology of the plant community, which is driven by
winter air temperature and impacts photosynthetic po-tential and net CO2uptake during the growing season
(colder winters are linked to lower summer NEE),
– water table level, which enhanced soil respiration and
decreased GPP during dry spells.
Although summer dry spells were sporadic during the study period, the positive effects of the current climatic trend to-wards milder winters on the site’s CO2 sink strength could
be offset by changes in precipitation patterns especially dur-ing the growdur-ing season.
1 Introduction
Northern peatlands are one of the most important global sinks of atmospheric CO2; with their ability to sequester C
Eddy covariance measurements using fixed flux towers provide the best method for assessing inter-annual changes in land–atmosphere exchange of CO2at the catchment scale
(Dinsmore et al., 2010; Nilsson et al., 2008; Roulet et al., 2007). In most years and in most peatlands, net ecosystem exchange (NEE) is the largest and most variable of the C flux terms (Roulet et al., 2007). In combination with aquatic fluxes (downstream and evasive losses) and CH4emissions,
it is a key component of C and greenhouse gas (GHG) bud-gets for peatland systems (Billett et al., 2010; Dinsmore et al., 2010). Although more sites are now being established glob-ally, there are still relatively few peatland sites (< 10) with published NEE measurements for periods of 3 years or more. Including the Auchencorth Moss site, there are to our knowledge only six peatland sites in the Northern Hemi-sphere for which long-term (≥3 years) data sets of NEE are now available and all show that peatlands operate as a sink for atmospheric CO2, albeit with different annual sink
strengths. The 6-year mean NEE for Mer Bleue peatland (Ontario, Canada) was−40.2 g C m−2yr−1(negative values signify uptake), varying year-to-year from a minor (−2) to a major (−112) CO2 sink (Roulet et al., 2007). Similarly, McVeigh et al. (2014) found that a blanket bog in south-west Ireland had a mean 9-year NEE of−55.7 g C m−2yr−1 and exhibited significant inter-annual variability (−32.1 to −79.2 g C m−2yr−1). Degerö Stormyr in northern Sweden showed consistent yet variable CO2uptake over 12
consecu-tive years (12-year mean−58±21 g C m−2yr−1, range−18 to −105 g C m−2yr−1) (Peichl et al., 2014). Eddy covari-ance measurements at Lompolojänkkä, a nutrient-rich fen in northern Finland, again showed that the site operated as a weak (−3 g C m−2yr−1) to strong (−59 g C m−2yr−1) CO
2
sink over a 3-year period (Aurela et al., 2009). In contrast to the variability exhibited by these sites, a sub-arctic per-mafrost mire in Northern Sweden was relatively stable over the period 2001–2008 (−46 g C m−2yr−1) (Christensen et al., 2012).
Quantifying inter-annual variability in NEE is a prereq-uisite for detecting longer term trends or step changes in flux magnitude in response to climatic or anthropogenic in-fluences and identifying its drivers. In the UK, there have been significant regional changes in precipitation and tem-perature since the beginning on the 20th century, with the most rapid changes occurring over the last 50 years (Jenk-ins et al., 2009). During the period 1961–2006 annual pre-cipitation increased by 2.5–23.2 %, with the largest increases occurring in the winter (particularly in Scotland and north-ern England); summer months were typically characterised by a decrease in precipitation. Mean annual temperature dur-ing the same period increased in parts of the UK by 1.05– 1.64◦C (Jenkins et al., 2009), with winter months (January– February) warming much faster than the other months of the year in some parts (Holden and Rose, 2011). These data show that significant changes are taking place in seasonal climatic
patterns, which are likely to have a major impact on annual net CO2uptake by peatland systems.
Meteorological conditions such as rainfall, temperature and levels of photosynthetic active radiation (PAR) control NEE and its components, total ecosystem respiration (Reco) and gross primary productivity (GPP).Recois composed of
a plant respiration term (autotrophic respiration,RA), which
quantifies metabolic respiration from both above- and below-ground biomass, and a heterotrophic respiration term (RH)
resulting from microbial decomposition of organic matter in the soil. Autotrophic respiration can account for up to 60 % orRecowhilst total belowground respiration can account for
up to 70 % (van der Molen et al., 2011).Recoand GPP have
been shown to be tightly linked in a range of ecosystems on both short-term and annual timescales (Irvine et al., 2008; Law, 2005; Ryan and Law, 2005) and respond similarly, al-though not necessarily with the same magnitude, to extreme events such as drought. For example, short-term dynamics ofReco can be more sensitive to the availability of labile C compounds produced by photosynthesis than to the effects of varying soil moisture on soil microbial activity (Irvine et al., 2008). On a global scale, drought is the main cause of de-creased GPP alongside continent-specific secondary drivers such as cold spells and precipitation (Zscheischler et al., 2014a, b). Although less well understood and modelled than GPP,Reco plays a major role in ecosystem C exchange
dy-namics, and increases inRecohave been shown to turn a sink
of C into a source (Lund et al., 2012). In order to interpret inter-annual variability in NEE, it is therefore crucial to par-tition NEE into GPP andRecoand study their dynamics with
respect to meteorology. We have done this on Auchencorth Moss, an ombrotrophic peatland in south-east Scotland.
The first eddy covariance measurements of CO2exchange
at Auchencorth Moss took place in 1995–1996 (Hargreaves et al., 2003), with continuous measurements starting in 2002. Previous measurements of NEE have been published for spe-cific 2–3 year time periods and suggest that inter-annual variability is high. Dinsmore et al. (2010) and Drewer et al. (2010) reported that over a 3-year period (2006–2008) the peatland acted as a very strong CO2 sink (−88 to −136 g C m−2yr−1), whereas Billett et al. (2004) reported that between 1995–1996 it was acting as a weaker CO2
sink (−36 and −8 g C m−2yr−1). In comparison to NEE, CH4 emissions at Auchencorth Moss are small (average of
0.32 g CH4-C m−2yr−1in 2007 and 2008; Dinsmore et al.,
– Colder than average winter temperatures affect the
ecosystem’s phenology and reduce summer GPP and NEE.
– Ecosystem respiration is related to water table depth and
the peatland releases more CO2to the atmosphere
dur-ing dry spells.
– Annual NEE is positively correlated with the length of
the growing season.
2 Materials and methods
2.1 Site description
Auchencorth Moss (55◦47′32′′N, 3◦14′35′′W; 267 m a.s.l.) is a low-lying ombrotrophic peatland situated 17 km south-west of Edinburgh (Scotland, UK). Parent material com-prises Upper Carboniferous/Lower Devonian sedimentary rocks overlain by fluvio-glacial till; peat depth range from < 0.5 to > 5 m. Long-term research (e.g. Billett et al., 2004; Dinsmore et al., 2010) on C fluxes is focussed on the 3.4 km2
upper part of the catchment (elevation range 249–300 m) where the soils comprise peats (85 %), Gleysols (9 %), Hu-mic Gleysols (3 %) and Cambisols (3 %). The open moor-land site has an extensive uniform fetch over blanket bog to the south, west and north with a dominant wind direc-tion from the south-west; winds from the north-east are the second most important wind direction. The terrain is rela-tively flat with a complex micro-topography consisting of hummocks and hollows. Hummocks are relatively small in size (typically 40 cm in diameter and∼30 cm in height) and covered by either a mix ofDeschampsia flexuosaand Erio-phorum vaginatum, orJuncus effusus. In contrast, hollows
are dominated by mosses (Sphagnum papillosumand Poly-trichum commune) and a layer of grasses (Dinsmore et al., 2009).
The site was drained more than 100 years ago (Leith et al., 2014); the drains have become progressively less effective and re-vegetated over time, leading to slow and progressive rewetting of the site. Over the last 20 years the site has been used for seasonal low intensity sheep grazing; areas of peat extraction occur at the margins of the catchment outside the footprint of the flux tower measurements.
2.2 Instrumentation and data processing
Fluxes of carbon dioxide (CO2) have been measured
contin-uously by eddy covariance (EC) at Auchencorth Moss since May 2002. The principles of operation and flux calculation methods using the eddy-covariance technique have been ex-tensively discussed elsewhere (Aubinet et al., 2000; Baldoc-chi et al., 2001). The EC system at Auchencorth Moss con-sists of a LI-COR 7000 closed-path infrared gas analyser op-erating at 10 Hz for the simultaneous measurement of carbon
dioxide and water vapour. Turbulence measurements were made with an ultrasonic anemometer (initially model Solent R1012A R2 operating at 20.8 Hz; from 2009 Gill Windmas-ter Pro operating at 20 Hz; both Gill Instruments, Lymington, UK), mounted atop a 3 m mast. The effective measurement height is 3.5 m with a vertical separation of 20 cm between the anemometer and the inlet of the sampling line. Air is sam-pled at 20 L min−1through a 40 m long Dekabon line
(inter-nal diameter 4 mm). In addition to eddy-covariance measure-ments, the site is equipped with a Campbell Scientific 23X data logger for the automated acquisition of a comprehensive suite of meteorological parameters which include net radia-tion (Skye instruments SKS1110), PAR (Skye instruments SKP215), air temperature (fine wire type-E thermocouple), air pressure (Vaisala PTB101C), wind speed and direction (Gill Instruments WindSonic), soil water content (Campbell Scientific CS616 TDR probes), soil temperature (Campbell Scientific 107 thermistors at 10, 20, 30, and 40 cm), rainfall (tipping bucket rain gauge) and, since April 2007, water table depth (Druck PDCR 1830).
High-frequency eddy-covariance data is acquired by in-house software written in LabView (National Instruments) and processed offline into half-hourly fluxes.
Half-hourly data points were excluded from further analy-sis if any of the criteria listed below were not met:
– The total number of “raw” (high-frequency) data points
per notional half-hour period was less than 90 % of the maximum possible number of points (36 000), i.e. be-low a minimum averaging period of 27 min.
– The number of spikes in raww(vertical wind velocity component), CO2(CO2 mole fraction) and H2O mole
fraction exceeded 1 % of the total number of points per half-hour period.
– The stationarity test devised by Foken and
Wichura (1996), which compares half-hourly fluxes to the average of six 5 min averaging periods within the half hour, did not fulfil the quality criterion.
– Turbulence was insufficient for reliable EC
measure-ments (u∗< 0.1 m s−1).
– CO2mole fractions < 330 ppm.
– Half-hourly CO2 fluxes (FCO2) fell outside the
(−50 µmol m−2s−1,+120 µmol m−2s−1) interval.
– Half-hourly latent fluxes (LE) fell outside the
(−250 W m−2,+600 W m−2) interval.
After quality control, the number of good data points ranged from 45 % (in 2005) to 78 % (in both 2004 and 2008), with an annual mean of 65±11 %.
2.3 Calculations of ecosystem respiration,Q10and
GPP
Gap filling of net ecosystem exchange (NEE) measured by eddy-covariance and partitioning of the gap-filled half-hourly fluxes into ecosystem respiration (Reco) and gross
pri-mary production (GPP) was achieved using an online tool developed at the Max Planck Institute for Biogeochemistry, Jena, Germany1(Reichstein et al., 2005). In this flux
parti-tioning approach, daytimeRecois obtained by extrapolation
of the night time parameterisation of NEE on air tempera-ture (using an exponential relationship of the form given in Eq. 1).
Reco=a exp(bT ) (1)
whereT is air temperature andaandbare fitting coefficients. GPP was then calculated as the difference betweenRecoand
measured NEE.
The growth rate (Q10) for ecosystem respiration for a
change of 10◦C was determined using the relationship:
Q10= R
2
R1 (T10
2−T1)
. (2)
T1 and T2 are reference temperatures (5 and 15◦C, re-spectively), andR1andR2are the corresponding respiration
rates.R1andR2for each calendar year of the study were
cal-culated from Eq. (1) using 24 h averages of measured night timeTairand NEE (see Supplement for non-linear regression
statistics).
GPP was parameterised with respect to PAR using the fol-lowing rectangular hyperbolic regression function:
GPP=α×GPPsat×PAR
GPPsat+α×PAR (3)
where GPPsat(GPP at light saturation) andα(quantum
effi-ciency) are fitting parameters.
2.4 Statistical tests
Statistical dependence between ecosystem response and hydro-meteorological variables was tested using Spearman’s rank correlation. This allows testing for monotony between pairs of variables without making assumptions as to the na-ture of the function linking them. The independent variables winter air temperature, length of growing season (LGS) and annual water table depth (WTD), were tested for rank cor-relation against the dependent variables summertime NEE, Reco, GPP,αand GPPsat, annual NEE and annual GPPsat.
The Spearman’s correlation coefficient (ρ) is calculated using Eq. (4):
ρ=1− 6 P
di2
n n2−1. (4)
1http://www.bgc-jena.mpg.de/~MDIwork/eddyproc/upload.php
In Eq. (4),di is the difference between ranked variables
andnthe sample size.
Potential dependence between daily growing season (March–September) water table depth and ecosystem re-sponse (Reco, GPP and NEE) was further investigated using one-way analysis of variance (ANOVA). The assumptions made were that (a) the 10 WTD classes (> 0 cm to <−45 cm in increments of 5 cm) constitute different treatments and (b) that the plant community has reached a steady state in terms of growth. The null hypothesis tested using this ANOVA is that WTD has no influence on ecosystem response.
3 Results
3.1 Site meteorology
During the study period (2002–2013) the site received a mean annual precipitation of 1018±166 mm (±values de-note standard deviation). Autumn (September–November) was the wettest season with 96±11 mm of rain per month, and spring (March–May) was the driest with 64±17 mm per month. Rainfall is highly variable year on year but records from a weather station of the UK Met Office (UK Meteoro-logical Office, 2013) located 3.5 km north of the study site indicated a slight upward trend since the early 1970s (aver-age annual precipitation 899±166 mm for the period 1961– 2001).
Mean annual air temperatures were 8.3±4.6◦C for the study period 2002–2013 compared to 7.7±4.5◦C for 1961– 2001. Despite year-on-year variability there are indications of a steady increase of the order of 0.019◦C yr−1 since records began in 1961 at the nearby Met Office station, which is consistent with UK and global trends (Jenkins et al., 2009). All seasons were warmer in 2002–2013 than in 1961–2001, albeit not significantly. Summer (June–August) was the warmest season with an average temperature of 13.6±1.1◦C, and winter (December–February) the coldest with 3.7±1.0◦C (Fig. 1).
Over the period April 2007–December 2013, water table depth (WTD) was within 4 cm of the peat surface for 50 out of 81 months (62 %). During dry periods, however, the water table could fall quickly to depths <−35 cm (Table 2).
3.2 Seasonal and inter-annual variability ofReco, GPP
and NEE
Figure 1.Monthly air temperature, rainfall and photosynthetically active radiation (PAR) for the study period 2002–2013.
Figure 2.10-year monthly averages of ecosystem respiration and, inset, ratio of gross primary production (GPP) to ecosystem respiration
(horizontal dashed lines are 10-year annual mean, and error bars are the standard deviations).
that on average carbon uptake by vegetative growth exceeded losses to the atmosphere through respiration for six months of the year, from April to September (Fig. 2, inset).
A negative correlation was established between mean an-nual values of GPPsat(GPP at light saturation, Eq. 3) and WT
(Spearmanρ= −0.63,p< 0.05, Table 1) indicating that the photosynthetic capacity of the plant community tended to de-crease as WT deepened. Furthermore, GPPsatwas positively
correlated to the average temperature during the preceding winter (ρ=0.73,p< 0.01, Table 1).
Both GPP andRecoexhibited significant inter-annual
vari-ability with peak summer time values ranging from 96 to
245 g CO2-C m−2month−1 for GPP and 76 to 198 g CO2
-C m−2month−1 for R
eco (August 2010 and July 2006, for
minima and maxima, respectively). The site was consistently a sink for CO2, however inter-annual variability was large.
NEE (mean−64.1±33.6 g CO2-C m−2) ranged from−5.2 to−135.9 g CO2-C m−2yr−1with minimum and maximum CO2uptake in 2013 and 2007, respectively (Fig. 4). As
corre-Figure 3.Hysteresis in gross primary production (GPP) as a
func-tion of photosynthetically active radiafunc-tion (PAR) (10-year monthly means).
Table 1.Spearman’s rank correlation coefficients (ρ) and associ-atedpvalues for all statistically significant inter-annual correlations
between ecosystem response and hydro-meteorological parameters observed at Auchencorth Moss during the study period 2003–2013. The suffix SS denotes spring/summer means and LGS is the length of the growing season. GPPsatandαare GPP at light saturation and
quantum efficiency, respectively, obtained by non-linear regression between GPP and PAR using Eq. (3).
Ecosystem response Parameter ρ pvalue
NEESS WinterTair −0.96 < 0.01
NEE (annual) LGS −0.80 < 0.01
GPPSS WinterTair 0.73 < 0.01
RecoSS WinterTair 0.61 0.02
GPPsat WinterTair 0.68 0.02
α WinterTair 0.68 0.02
GPPsat(annual) WT (annual) −0.63 < 0.05
lated to summer temperature, a strong negative correlation (i.e. net uptake increased with increasing winter Tair) was
observed between mean NEESS and the mean air
tempera-ture of the preceding winter (December–March) (R2=0.87, Fig. 6;p< 0.01). Comparable correlations to winterTairwere
observed for GPPSSandRecoSS (R2=0.43,p< 0.01;R2= 0.28,p=0.02, respectively, Fig. 6).
3.3 Effects of dry periods on CO2exchange
Throughout most years and most seasons Auchencorth Moss can be considered a wet site, with mean water table depth (WTD)−3.5±6.8 cm and monthly range+3.8 cm (flooded; positive values denote water table levels above the peat surface) to −36 cm (WTD measurements commenced in
Figure 4.Annual NEE for 2003–2013 (no data for 2011 due to instrument failure during the growing season); the horizontal line is the mean NEE for the study period.
Figure 5.Annual NEE as a function of the length of the growing
season.
April 2007). The site was generally waterlogged during the autumn and winter months. During dry spells, which we ar-bitrarily define as any period lasting 1 week or longer with WTD <−5 cm, the water table can drop quickly at rates up to 3 cm day−1(Table 2).
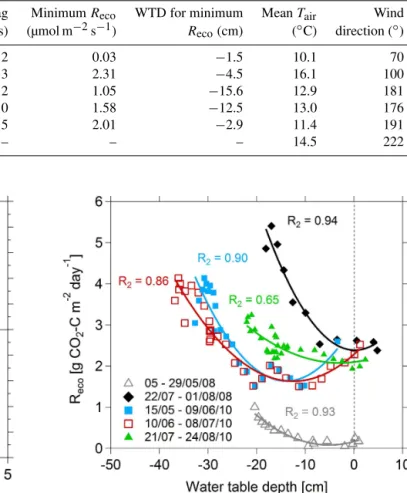
Three notable dry spells occurred during the summer of 2010 and two during the summer of 2008, characterised by cycles of rapid fall and rise of the water table. Mean-while, air temperatures exhibited little variation. Details of the drainage rates (water table drawdown) and minimum wa-ter table depths are given in Table 2. Under normal hydro-logical conditions (water table typically within 3–5 cm of the peat surface), Reco at Auchencorth Moss did not exhibit a significant correlation with WTD. In contrast, during the dry spells of 2008 and 2010, dailyRecowas non-linearly
corre-lated to WTD (Fig. 7). The response ofReco to changes in
Table 2. Water table drainage rates and minimum water table depths (WTD) observed during the summer dry spells of 2008, 2010 and 2013. The time lag is the number of days elapsed between the start of the dry period and the onset of a response from the ecosystem respiration (Reco); the time lag was determined by optimising the polynomial fit betweenRecoand WTD. The minimum value ofRecofor each dry spell and the water table depth corresponding to each minimum value ofRecowere calculated using a second degree polynomial regression function betweenRecoand WTD. No parabolic relationship was observed in 2013 betweenRecoand WTD; for this reason, time lag, minimumRecoand WTD for minimumRecocould not be calculated.
Period Drainage rate Minimum Time lag MinimumReco WTD for minimum MeanTair Wind
(cm day−1) WTD (cm) (days) (µmol m−2s−1) Reco(cm) (◦C) direction (◦)
05–29/05/2008 1.2 −20.4 2 0.03 −1.5 10.1 70
22/07–01/08/2008 3.0 −19.1 3 2.31 −4.5 16.1 100
15–26/05/2010 1.6 −30.7 2 1.05 −15.6 12.9 181
09–24/06/2010 2.0 −36.1 0 1.58 −12.5 13.0 176
21/07–08/08/2010 2.0 −22.1 5 2.01 −2.9 11.4 191
26/05–06/09/2013 1.4 −48.5 – – – 14.5 222
Figure 6.Spring/summer fluxes of NEE, GPP andReco(mean from April to September) as a function of the preceding winter’s mean air temperature (mean from December to March).
During the first two dry spells of 2010 the relationship be-tweenRecoand WTD was of clear parabolic form, withReco
reaching a minimum a few days after the onset of the dry period. Except for the second dry period of 2010, the residu-als of the regressions betweenRecoand WTD were not
cor-related with air nor soil temperature. The two dry spells of 2008 exhibited similar parabolic relationships betweenReco and WTD but differed in magnitude.
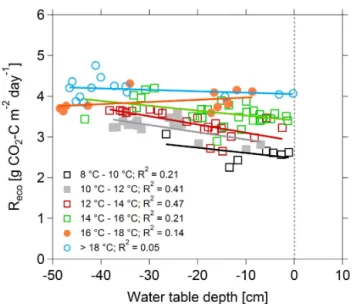
Such parabolic relationships betweenRecoand WTD were not observed during the summer of 2013, which was the sec-ond driest in the 2002–2013 study period (the driest was 2003 with 346 mm rain between April and September compared to 361 mm in 2013); 2013 also had the longest winter of the study period (start of the growing season at day 103 in 2013 compared to day 77±21 for the entire study period) as well
Figure 7.Daily ecosystem respiration as a function of water table depth during five dry spells (two in summer 2008 and three in 2010).
as the lowest soil temperatures. Soil temperature at−5 cm increased by 3◦C in the 10 days prior to the start of the ther-mal growing season;Tsoil increased steadily until mid-July
and reached 15◦C, the highest value of the 11-year study period, on 26 July. The dry period began on 25 May, culmi-nating on 22 July (WTD= −48 cm), and WTD was≤ −5 cm until early September. In 2013, the relationship betweenReco
and WTD was linear across the 6 temperature classes consid-ered (Fig. 8). Above 16◦C, the positive correlation between Recoand WTD was less pronounced and was even found to be negative for the 16–18◦C temperature class. Above 18◦C, the positive linear correlation was no longer statistically sig-nificant.
For all years for which WTD data was available, the sen-sitivity of Reco to air temperature (Q10) decreased with a
Figure 8.Ecosystem respiration as a function of water table depth
and air temperature (daily means for May–September 2013).
the temperature-dependent functions fitted to monthly Reco and averaged to annual values) were found to increase with WTD. One-way analysis of variance (ANOVA) on GPP, NEE andRecowith respect to 10 WTD classes (Table 3)
demon-strated that the position of the WT does have a statistically significant impact on Reco for all years between 2007 and
2013, except 2012. For GPP, the correlation with WTD was significant in 2008 and 2010, and for NEE in 2013 only.
4 Discussion
The following sections discuss the effects of winter meteo-rology and water table depth on ecosystem response during the growing season and place the Auchencorth Moss peat-land into a broader context by comparing it to other sites in the Northern Hemisphere with published NEE records ≥3 years.
4.1 Effect of winter meteorology on ecosystem response
Mean winter Tair explained 87 % of inter-annual
variabil-ity in NEE during the following summer (NEESS), 43 % of
GPPSSand 28 % ofRecoSS (Fig. 6), which is consistent with
observations over a 12-year period at a boreal fen in north-ern Sweden (Peichl et al., 2014). A number of studies have reported correlations between winter meteorological condi-tions and the development of plant populacondi-tions later in the year. Weltzin (2000) reported increased total net primary pro-ductivity (TNPP) in shrubs, a decrease in graminoids and no effect on bryophytes exposed to a gradient of infrared loading (i.e. continuous heating by infrared lamps). Indi-vidual species of bryophytes at a temperate UK site have been shown to respond to winter warming and/or summer drought in opposite ways, but this was not reflected at the
Table 3.Results (pvalue) of 1-way analysis of variance (ANOVA) on daily GPP,Recoand NEE with respect to 10 water table depth (WTD) classes (> 0 to <−45 cm in increments of 5 cm). Missing values denote failure of the equal variance test.
Year NEE Reco GPP
2007 – 0.02 –
2008 0.14 < 0.01 0.02
2009 0.72 0.04 0.80
2010 0.93 < 0.01 < 0.01
2012 – 0.06 0.48
2013 0.03 < 0.01 0.05
community level, whose mean cover did not exhibit signif-icant differences between treatments (Bates et al., 2005). Kreyling (2008) demonstrated enhancement of aboveground net primary productivity (ANPP) in grasses as a result of freeze-thaw cycles the preceding winter, whilst belowground net primary productivity (BNPP) was adversely affected. Eddy-covariance measurements provide spatially integrated fluxes representative of the entire plant community within the footprint of the flux tower. The contributions of individ-ual species, whose productivity can vary from year to year (Bates et al., 2005; Kreyling et al., 2010, 2008; Weltzin et al., 2000) cannot be assessed by EC. However, based on the knowledge that Sphagnum mosses are capable of photosyn-thesising as soon as the snow cover disappears and daily air temperature reaches > 0◦C (Loisel et al., 2012), we speculate that the sensitivity of GPP, GPPsatandαto winter air tem-perature is predominantly caused by graminoids and other non-moss species.
4.2 Effect of water table level on GPP andReco
un-changed in graminoids. As graminoids and bryophytes were the dominant species in the EC footprint, the sensitivity of GPP to WTD observed at our study site was likely to be mainly due to mosses.
The parabolic trend seen in the relationship betweenReco and WTD during dry spells (Fig. 7) may help understand the mechanistic drivers of Reco at Auchencorth Moss. The
parabolic trends were especially strong during the two first dry spells of 2010 (15 May–9 June 2010 and 10 June– 10 July 2010) during which the prevailing wind direction was from the south. The WTD measurements might not be representative of the entire flux footprint, which could per-haps explain the markedly different trends observed in 2008 when wind was blowing from the east. We postulate that the initial decline in respiration was caused by a reduction in plant metabolic activity as water availability decreased (Lund, 2012). Drought has been shown to decrease C as-similation, slow the translocation of photosynthates between above- and belowground biomass, and reduce root-mediated respiration within days (Ruehr et al., 2009). Meanwhile, the lowering of the WT also favours aerobic processes, increases microbial activity and decomposition of organic matter (Hen-driks et al., 2007; Moyano et al., 2013), and facilitates CO2
diffusion within the peat profile (Moldrup et al., 1999; Tang et al., 2005) causing a net increase in CO2 efflux from the
soil. Minimum Reco could then correspond to equilibrium
between declining autotrophic and increasing heterotrophic respiration. The decrease of the sensitivity of Reco with
re-spect toTair (Q10) at our site is consistent with findings at
other hydric sites where soil respiration (in particular het-erotrophic respiration) has been shown to be enhanced by drought (Wang et al., 2014). The subsequent net increase inReco with deepening WTD could then be explained by a gradual increase in the ratio of heterotrophic to autotrophic respiration.
Based on these observations, we attribute the differences in respiration patterns during the dry spells to water table dy-namics, which differs from drier sites where temperature (not WT) was found to be the dominant control ofReco(Lafleur
et al., 2005; Updegraff et al., 2001). This is further supported by the result of one-way ANOVA, which demonstrates a sta-tistically significant correlation between Recoand WTD for
all growing seasons (except for 2012 which had a wetter than average growing season with WT near or above the peat sur-face for the entire growing season). The linear (rather than parabolic) response ofReco to WTD in 2013 could perhaps be linked to the long winter of 2013 (the thermal growing season began 69 days later than in 2008, and 10 days later than in 2010) and the fact that the dry spell, which lasted most of the summer, began less than a month after the start of the growing season. Under these conditions, the moss pop-ulation could have switched from relatively low metabolic activity to desiccation while active growth had just begun in the graminoid community. Hence, the RH/ RA ratio could
have been smaller than in previous years. In contrast to other
years, GPP during summer 2013 was positively correlated to WTD (p< 0.001), which suggests growth in species less susceptible to drought-stress than mosses.
Disentangling the effects of lower than average winter air temperature and summer dry spells on annual NEE is not straightforward, but the former seems to be the dominant driver based on our results (Table 1). The combined effects of a long, relatively cold winter and warm, dry summer which could have slowed plant growth, disturbed the normal pheno-logical cycle and enhanced carbon losses from the peatland through enhanced heterotrophic respiration, were illustrated in 2013 when the sink strength of Auchencorth Moss was significantly weakened (−5.2 g C-CO2m−2yr−1) compared to the long-term mean of −64.1±33.6 g C-CO2m−2yr−1 (2003–2012).
4.3 NEE in Northern Hemisphere peatland C budgets
Compared to other peatlands in the Northern Hemisphere, annual values of NEE at Auchencorth Moss are at the high end of both the mean (−64.1±33.6 g CO2-C m−2yr−1) and inter-annual range (−5.2 to−135.9 g CO2-C m−2yr−1). However, when the length of the growing season (LGS; the start of the growing season was defined as the first day of the year when mean diurnal air temperature exceeded 5◦C for 5 consecutive days. Conversely, the end of the grow-ing season was defined as the first day of the year when mean diurnal air temperature fell below 5◦C for 5 con-secutive days) was accounted for, the mean daily growing season NEE (NEEGS) at Auchencorth Moss (−0.57 g CO2
-C m−2day−1) was remarkably similar to that found at both Mer Bleue (cool temperate bog;−0.58 g CO2-C m−2day−1;
Roulet et al., 2007) and Degerö Stormyr (boreal mire; −0.48 g CO2-C m−2day−1; Peichl et al., 2014). By con-trast, mean daily NEEGSat Glencar (maritime blanket bog;
Koehler et al., 2011, McVeigh et al., 2014) was slightly lower (−0.39 g CO2-C m−2day−1), whilst the two sub-arctic Scan-dinavian peatlands Lompolojänkä (nutrient-rich sedge fen; Aurela et al., 2009) and Stordalen (sub-arctic palsa mire; Christensen et al., 2012) stand out with mean daily growing season NEE rates 2 to 2.5 times higher than the values found for Auchencorth Moss, Degerö Stormyr and Mer Bleue, and over 3 times higher than the value found at Glencar (Table 4). Auchencorth Moss had a mean daily NEE during the dor-mant season (NEEDS) of 0.61 g CO2-C m−2day−1, the
high-est amongst the aforementioned catchments (10, 5, 3 and 2 times higher than Glencar, Degerö Stormyr, Stordalen and Mer Bleue, respectively). Mean daily NEEDS at
Lompolo-jänkä was only slightly lower than at Auchencorth Moss (0.52 g CO2-C m−2day−1).
Despite the lower daily mean NEE, the long growing sea-son at Auchencorth Moss made its total NEEGScomparable
Table 4.Annual minimum, maximum and mean values of NEE at several long-term peatland monitoring sites in the Northern Hemisphere. LGS and LDS are the length of growing and dormant season respectively, and subscripts GS and DS denote growing and dormant season. The length of the growing season for the study site Auchencorth Moss was bounded by the first and last day for which mean daily air temperatures exceeded 5◦C for 5 consecutive days. For the other sites, LGS was estimated from data available in the respective articles.
Site Auchencorth Moss Stordalen1 Mer Glencar3 Lompolojänkkä4 Degerö
(this study) Bleue2 Stormyr5
Latitude 55◦47′ 68◦20′ 45◦23′ 51◦55′ 68◦0′ 64◦11′
Duration (years) 11 8 6 9 3 12
Minimum NEE −5.2 −20 −2 −32.1 −3.3 −18
(g CO2-C m−2)
Maximum NEE −135.9 −95 −112 −79.7 −58.9 −105
(g CO2-C m−2)
Mean NEE −64.1±33.6 −66±29.1 −40.2±40.5 −55.7±30.0 −31.9±27.8 −58.0±21.0
(g CO2-C m−2)
Mean NEEGS −142±55.0 −133±28.0 −97.1±38.7 −60±15.0 −160±13.0 −84.8±23.6
(g CO2-C m−2)
Length of growing 247 117c 168a 153b 119 120
season (LGS) (days)
NEEGS/LGS −0.57 −1.14 −0.58 −0.39 −1.34 −0.48
(g CO2-C m−2day−1)
NEEDS/LDS 0.61 0.27 0.29 0.06 0.52 0.11
(g CO2-C m−2day−1)
References:1Christensen et al. (2012);2Roulet et al. (2007);3McVeigh et al. (2014);4Aurela et al. (2009);5Peichl et al. (2014).aEstimated from Lafleur et al. (2003): growing season from May to September (1998–2002);bmean growing season lengths 2002–2007 (Sottocornola and Kiely, 2010);cuse of NEE and LGS for the years
2006–2008 only, as winter measurements of NEE during the other years of the study were deemed unreliable by the authors (Christensen et al., 2012).
Auchencorth Moss, Lompolojänkä and Stordalen therefore had comparable NEE but for very different reasons: Auchen-corth Moss had long growing seasons but also relatively high carbon losses the rest of the year, which could be due to milder winters with minimal snow cover. Lompolojänkä and Stordalen had vigorous carbon uptake rates, their LGS were comparable to one another, but were half that of Auchencorth Moss, whilst Lompolojänkä had high carbon losses during the dormant season which strongly reduced the site’s sink strength.
Carbon uptake rates at Degerö Stormyr and Mer Bleue were very similar to Auchencorth Moss but their carbon loss rates, which were comparable to Stordalen’s, were half or less than that of Auchencorth Moss. This could be explained by cooler climate and prolonged periods of snow cover com-pared to Auchencorth Moss.
Considering the differences in latitude, climate, hydrology and vegetation, these sites (with the exception of Stordalen and Lompolojänkä) are remarkably similar in terms of their daily mean NEEGS.
NEE represents only one flux pathway within the full net ecosystem C budget (NECB). When terrestrial CH4
emissions (2007–2008; Dinsmore et al., 2010), downstream aquatic flux losses and water surface evasion (2007–2011; Dinsmore et al., 2013) are accounted for, the total long-term sink strength of Auchencorth Moss is reduced to approximately −28 g C m−2yr−1 (whilst recognising
un-certainty as the fluxes are not measured over the same time period). Using literature values of CH4 (Roulet et
al., 2007) and aquatic C losses for Mer Bleue (Billett and Moore, 2008) results in an approximate total C sink strength of−17 g C m−2yr−1; for Degerö Stormyr the total C sink strength is−24 g C m−2yr−1(Nilsson et al., 2008), −30 g C m−2yr−1 for Glencar (Koehler et al., 2011) and −34 g C m−2yr−1 for Stordalen (Christensen et al., 2012; Lundin et al., 2013; Olefeldt et al., 2013); data for Lompolo-jänkä could not be found. Hence when all flux pathways are accounted for the C balances of the different peatlands ap-pear to converge.
5 Summary
Eleven years of continuous monitoring of net ecosystem ex-change of carbon dioxide at a temperate Scottish peatland revealed highly variable inter-annual dynamics despite little or no change in land management. Variation in climate and especially winter air temperature is thought to be the dom-inant control at the study site. The latter explained 87 % of inter-annual changes in NEE and a modest rise of 1◦C above average winter air temperature for the 2002–2013 study pe-riod was accompanied by a 20 % increase in CO2 uptake.
Colder winters appear to have an adverse effect on the peat-land CO2 sink strength possibly due to disturbances to the
spells have been linked to enhanced ecosystem respiration and depressed GPP and it is thought that (a) heterotrophic respiration can become the dominant term as water availabil-ity decreases, and (b) mosses are more sensitive to WTD than other species at the site. Cold winters and dry summers both have negative effects on the CO2 sink strength of the bog;
these two factors converged in 2013 and led to a significant reduction in net CO2 uptake (−90 % compared to the 11-year mean). Auchencorth Moss, although always a sink of CO2during the study period, is highly sensitive to even
mod-est changes in hydro-meteorological conditions at relatively short timescales. The large inter-annual variability of NEE observed to date makes future trends difficult to predict and quantify. Changes in seasonal hydro-meteorological condi-tions, especially changes in precipitation patterns and inten-sity, could however be pivotal for the CO2 cycling of this
peatland. Drier summers could lead to a reduction in net CO2
uptake but this could be offset by milder temperatures, par-ticularly in winter, and longer growing seasons. Mean annual temperatures at the study site have risen by 0.019◦C yr−1
since 1961, which could, in theory, benefit C uptake by the peatland in the long-term since NEE was found to be closely linked to the length of the growing season.
The Supplement related to this article is available online at doi:10.5194/bg-12-1799-2015-supplement.
Acknowledgements. The authors acknowledge a succession of
European projects (FP5 CarboMont, FP6 NitroEurope, FP7 GHG Europe and ÉCLAIRE) and CEH carbon catchments for support of the measurements and data analysis. Measurements were supported by CEH colleagues Ian Leith, Ivan Simmons and Sarah Leeson.
Edited by: E. Pendall
References
Aubinet, M., Grelle, A., Ibrom, A., Rannik, U., Moncrieff, J., Fo-ken, T., Kowalski, A. S., Martin, P. H., Berbigier, P., Bernhofer, C., Clement, R., Elbers, J., Granier, A., Grunwald, T., Morgen-stern, K., Pilegaard, K., Rebmann, C., Snijders, W., Valentini, R., and Vesala, T.: Estimates of the annual net carbon and water ex-change of forests: The Euroflux methodology, Adv. Ecol. Res., 30, 113–175, 2000.
Aurela, M., Laurila, T., and Tuovinen, J. P.: Seasonal CO2balances of a subarctic mire, J. Geophys. Res.-Atmos., 106, 1623–1637, doi:10.1029/2000jd900481, 2001.
Aurela, M., Lohila, A., Tuovinen, J.-P., Hatakka, J., Riutta, T., and Laurila, T.: Carbon dioxide exchange on a northern boreal fen, Boreal Environ. Res., 14, 699–710, 2009.
Baldocchi, D., Falge, E., Gu, L. H., Olson, R., Hollinger, D., Running, S., Anthoni, P., Bernhofer, C., Davis, K., Evans, R.,
Fuentes, J., Goldstein, A., Katul, G., Law, B., Lee, X. H., Malhi, Y., Meyers, T., Munger, W., Oechel, W., Paw, K. T., Pilegaard, K., Schmid, H. P., Valentini, R., Verma, S., Vesala, T., Wilson, K., and Wofsy, S.: Fluxnet: A new tool to study the temporal and spatial variability of ecosystem-scale carbon dioxide, water va-por, and energy flux densities, B. Am. Meteorol. Soc., 82, 2415– 2434, 2001.
Bates, J. W., Thompson, K., and Grime, J. P.: Effects of simu-lated long-term climatic change on the bryophytes of a lime-stone grassland community, Glob. Change Biol., 11, 757–769, doi:10.1111/j.1365-2486.2005.00953.x, 2005.
Billett, M. F. and Moore, T. R.: Supersaturation and evasion of CO2 and CH4in surface waters at Mer Bleue peatland, Canada, Hy-drol. Process., 22, 2044–2054, doi:10.1002/hyp.6805, 2008. Billett, M. F., Palmer, S. M., Hope, D., Deacon, C.,
Storeton-West, R., Hargreaves, K. J., Flechard, C., and Fowler, D.: Linking land-atmosphere-stream carbon fluxes in a low-land peatlow-land system, Global Biogeochem. Cy., 18, GB1024, doi:10.1029/2003gb002058, 2004.
Billett, M. F., Charman, D. J., Clark, J. M., Evans, C. D., Evans, M. G., Ostle, N. J., Worrall, F., Burden, A., Dinsmore, K. J., Jones, T., McNamara, N. P., Parry, L., Rowson, J. G., and Rose, R.: Carbon balance of UK peatlands: Current state of knowl-edge and future research challenges, Clim. Res., 45, 13–29, doi:10.3354/cr00903, 2010.
Christensen, T. R., Jackowicz-Korczynski, M., Aurela, M., Crill, P., Heliasz, M., Mastepanov, M., and Friborg, T.: Monitor-ing the multi-year carbon balance of a subarctic palsa mire with micrometeorological techniques, Ambio, 41, 207–217, doi:10.1007/s13280-012-0302-5, 2012.
Clark, J. M., Billett, M. F., Coyle, M., Croft, S., Daniels, S., Evans, C. D., Evans, M., Freeman, C., Gallego-Sala, A. V., Heinemeyer, A., House, J. I., Monteith, D. T., Nayak, D., Orr, H. G., Pren-tice, I. C., Rose, R., Rowson, J., Smith, J. U., Smith, P., Tun, Y. M., Vanguelova, E., Wetterhall, F., and Worrall, F.: Model inter-comparison between statistical and dynamic model assessments of the long-term stability of blanket peat in Great Britain (1940– 2099), Clim. Res., 45, 227–281, doi:10.3354/cr00974, 2010. Dinsmore, K. J., Skiba, U. M., Billett, M. F., and Rees, R. M.:
Ef-fect of water table on greenhouse gas emissions from peatland mesocosms, Plant Soil, 318, 229–242, doi:10.1007/s11104-008-9832-9, 2009.
Dinsmore, K. J., Billett, M. F., Skiba, U. M., Rees, R. M., Drewer, J., and Helfter, C.: Role of the aquatic pathway in the carbon and greenhouse gas budgets of a peatland catchment, Glob. Change Biol., 16, 2750–2762, doi:10.1111/j.1365-2486.2009.02119.x, 2010.
Dinsmore, K. J., Billett, M. F., and Dyson, K. E.: Temperature and precipitation drive temporal variability in aquatic carbon and GHG concentrations and fluxes in a peatland catchment, Glob. Change Biol., 19, 2133–2148, doi:10.1111/gcb.12209, 2013. Drewer, J., Lohila, A., Aurela, M., Laurila, T., Minkkinen, K.,
Foken, T. and Wichura, B.: Tools for quality assessment of surface-based flux measurements, Agr. Forest Meteorol., 78, 83–105, doi:10.1016/0168-1923(95)02248-1, 1996.
Frolking, S., Roulet, N. T., Moore, T. R., Richard, P. J. H., Lavoie, M., and Muller, S. D.: Modeling northern peatland de-composition and peat accumulation, Ecosystems, 4, 479–498, doi:10.1007/s10021-001-0105-1, 2001.
Gunnarsson, U.: Global patterns of sphagnum productivity, J. Bryol., 27, 269–279, doi:10.1179/174328205x70029, 2005. Hargreaves, K. J., Milne, R., and Cannell, M. G. R.: Carbon
bal-ance of afforested peatland in Scotland, Forestry, 76, 299–317, doi:10.1093/forestry/76.3.299, 2003.
Hendriks, D. M. D., van Huissteden, J., Dolman, A. J., and van der Molen, M. K.: The full greenhouse gas balance of an abandoned peat meadow, Biogeosciences, 4, 411–424, doi:10.5194/bg-4-411-2007, 2007.
Holden, J. and Rose, R.: Temperature and surface lapse rate change: A study of the UK’s longest upland instrumental record, Int. J. Climatol., 31, 907–919, doi:10.1002/joc.2136, 2011.
IPCC: Technical summary, Cambridge, UK, 19–92, 2007. Irvine, J., Law, B. E., Martin, J. G., and Vickers, D.: Interannual
variation in soil CO2 efflux and the response of root respira-tion to climate and canopy gas exchange in mature ponderosa pine, Glob. Change Biol., 14, 2848–2859, doi:10.1111/j.1365-2486.2008.01682.x, 2008.
Jenkins, G., Perry, M., and Prior, J.: The climate of the United King-dom and recent trends, Hadley Centre, Met Office, Exeter, 2009. Koehler, A.-K., Sottocornola, M., and Kiely, G.: How strong is the current carbon sequestration of an Atlantic blanket bog?, Glob. Change Biol., 17, 309–319, doi:10.1111/j.1365-2486.2010.02180.x, 2011.
Kreyling, J., Beierkuhnlein, C., Pritsch, K., Schloter, M., and Jentsch, A.: Recurrent soil freeze-thaw cycles enhance grassland productivity, New Phytol., 177, 938–945, doi:10.1111/j.1469-8137.2007.02309.x, 2008.
Kreyling, J., Beierkuhnlein, C., and Jentsch, A.: Effects of soil freeze-thaw cycles differ between experimen-tal plant communities, Basic Appl. Ecol., 11, 65–75, doi:10.1016/j.baae.2009.07.008, 2010.
Lafleur, P. M., Roulet, N. T., Bubier, J. L., Frolking, S., and Moore, T. R.: Interannual variability in the peatland-atmosphere carbon dioxide exchange at an ombrotrophic bog, Global Biogeochem. Cy., 17, 1036, doi:10.1029/2002gb001983, 2003.
Lafleur, P. M., Moore, T. R., Roulet, N. T., and Frolking, S.: Ecosystem respiration in a cool temperate bog depends on peat temperature but not water table, Ecosystems, 8, 619–629, doi:10.1007/s10021-003-0131-2, 2005.
Law, B.: Carbon dynamics in response to climate and disturbance: Recent progress from multi-scale measurements and modeling in Ameriflux, in: Plant responses to air pollution and global change, edited by: Omasa, K., Nouchi, I., and DeKok, L. J., 205–213, 2005.
Leith F. I., Garnett M. H., Dinsmore, K. J., Billett, M. F., and Heal, K. V.: Source and age of dissolved and gaseous carbon in a peatland-riparian-stream continuum: a dual iso-tope (14C andδ13C) analysis, Biogeochemistry, 119, 415–433,
doi:10.1007/s10533-014-9977-y, 2014.
Loisel, J., Gallego-Sala, A. V., and Yu, Z.: Global-scale pattern of peatlandSphagnumgrowth driven by photosynthetically active
radiation and growing season length, Biogeosciences, 9, 2737– 2746, doi:10.5194/bg-9-2737-2012, 2012.
Lund, M., Christensen, T. R., Lindroth, A., and Schubert, P.: Effects of drought conditions on the carbon dioxide dynam-ics in a temperate peatland, Environ. Res. Lett., 7, 045704, doi:10.1088/1748-9326/7/4/045704, 2012.
Lundin, E. J., Giesler, R., Persson, A., Thompson, M. S., and Karls-son, J.: Integrating carbon emissions from lakes and streams in a subarctic catchment, J. Geophys. Res.-Biogeo., 118, 1200–1207, 10.1002/jgrg.20092, 2013.
McVeigh, P., Sottocornola, M., Foley, N., Leahy, P., and Kiely, G.: Meteorological and functional response partitioning to ex-plain interannual variability of CO2 exchange at an Irish Atlantic blanket bog, Agr. Forest Meteorol., 194, 8–19, doi:10.1016/j.agrformet.2014.01.017, 2014.
Moldrup, P., Olesen, T., Yamaguchi, T., Schjonning, P., and Rolston, D. E.: Modeling diffusion and reaction in soils: IX. The Buckingham-Burdine-Campbell equation for gas dif-fusivity in undisturbed soil, Soil Science, 164, 542–551, doi:10.1097/00010694-199908000-00002, 1999.
Moyano, F. E., Manzoni, S., and Chenu, C.: Responses of soil heterotrophic respiration to moisture availability: An explo-ration of processes and models, Soil Biol. Biochem., 59, 72–85, doi:10.1016/j.soilbio.2013.01.002, 2013.
Nilsson, M., Sagerfors, J., Buffam, I., Laudon, H., Eriksson, T., Grelle, A., Klemedtsson, L., Weslien, P., and Lindroth, A.: Con-temporary carbon accumulation in a boreal oligotrophic minero-genic mire – a significant sink after accounting for all C-fluxes, Glob. Change Biol., 14, 2317–2332, doi:10.1111/j.1365-2486.2008.01654.x, 2008.
Olefeldt, D., Roulet, N., Giesler, R., and Persson, A.: Total waterborne carbon export and DOC composition from ten nested subarctic peatland catchments – importance of peat-land cover, groundwater influence, and inter-annual variabil-ity of precipitation patterns, Hydrol. Process., 27, 2280–2294, doi:10.1002/hyp.9358, 2013.
Peichl, M., Oquist, M., Lofvenius, M. O., Ilstedt, U., Sagerfors, J., Grelle, A., Lindroth, A., and Nilsson, M. B.: A 12-year record reveals pre-growing season temperature and water table level threshold effects on the net carbon dioxide exchange in a boreal fen, Environ. Res. Lett., 9, 055006, doi:10.1088/1748-9326/9/5/055006, 2014.
Reichstein, M., Falge, E., Baldocchi, D., Papale, D., Aubinet, M., Berbigier, P., Bernhofer, C., Buchmann, N., Gilmanov, T., Granier, A., Grunwald, T., Havrankova, K., Ilvesniemi, H., Janous, D., Knohl, A., Laurila, T., Lohila, A., Loustau, D., Mat-teucci, G., Meyers, T., Miglietta, F., Ourcival, J. M., Pumpanen, J., Rambal, S., Rotenberg, E., Sanz, M., Tenhunen, J., Seufert, G., Vaccari, F., Vesala, T., Yakir, D., and Valentini, R.: On the sep-aration of net ecosystem exchange into assimilation and ecosys-tem respiration: Review and improved algorithm, Glob. Change Biol., 11, 1424–1439, doi:10.1111/j.1365-2486.2005.001002.x, 2005.
Roulet, N. T., Lafleur, P. M., Richard, P. J. H., Moore, T. R., Humphreys, E. R., and Bubier, J.: Contemporary carbon bal-ance and late Holocene carbon accumulation in a northern peatland, Glob. Change Biol., 13, 397–411, doi:10.1111/j.1365-2486.2006.01292.x, 2007.
Ruehr, N. K., Offermann, C. A., Gessler, A., Winkler, J. B., Fer-rio, J. P., Buchmann, N., and Barnard, R. L.: Drought ef-fects on allocation of recent carbon: From beech leaves to soil CO2 efflux, New Phytol., 184, 950–961, doi:10.1111/j.1469-8137.2009.03044.x, 2009.
Ryan, M. G. and Law, B. E.: Interpreting, measuring, and modeling soil respiration, Biogeochemistry, 73, 3–27, doi:10.1007/s10533-004-5167-7, 2005.
Sottocornola, M. and Kiely, G.: Hydro-meteorological controls on the CO2exchange variation in an Irish blanket bog, Agr. Forest Meteorol., 150, 287–297, doi:10.1016/j.agrformet.2009.11.013, 2010.
Tang, J. W., Misson, L., Gershenson, A., Cheng, W. X., and Goldstein, A. H.: Continuous measurements of soil respiration with and without roots in a ponderosa pine plantation in the Sierra Nevada mountains, Agr. Forest Meteorol., 132, 212–227, doi:10.1016/j.agrformet.2005.07.011, 2005.
UK Meteorological Office: Met office integrated data archive sys-tem (MIDAS) land and marine surface stations data (1853– current), in: NCAS British Atmospheric Data Centre, avail-able at: http://badc.nerc.ac.uk/view/badc.nerc.ac.uk__ATOM_ _dataent_ukmo-midas, (last access: January 2014), 2013. Updegraff, K., Bridgham, S. D., Pastor, J., Weishampel, P., and
Harth, C.: Response of CO2and CH4emissions from peatlands to warming and water table manipulation, Ecol. Appl., 11, 311– 326, doi:10.2307/3060891, 2001.
van der Molen, M. K., Dolman, A. J., Ciais, P., Eglin, T., Gob-ron, N., Law, B. E., Meir, P., Peters, W., Phillips, O. L., Reich-stein, M., Chen, T., Dekker, S. C., Doubkova, M., Friedl, M. A., Jung, M., van den Hurk, B. J. J. M., de Jeu, R. A. M., Kruijt, B., Ohta, T., Rebel, K. T., Plummer, S., Seneviratne, S. I., Sitch, S., Teuling, A. J., van der Werf, G. R., and Wang, G.: Drought and ecosystem carbon cycling, Agr. Forest Meteorol., 151, 765–773, doi:10.1016/j.agrformet.2011.01.018, 2011.
Wang, Y., Hao, Y., Cui, X. Y., Zhao, H., Xu, C., Zhou, X., and Xu, Z.: Responses of soil respiration and its components to drought stress, J. Soil. Sediment., 14, 99–109, doi:10.1007/s11368-013-0799-7, 2014.
Weltzin, J. F., Pastor, J., Harth, C., Bridgham, S. D., Updegraff, K., and Chapin, C. T.: Response of bog and fen plant communities to warming and water-table manipulations, Ecology, 81, 3464– 3478, doi:10.1890/0012-9658(2000)081[3464:robafp]2.0.co;2, 2000.
Worrall, F., Burt, T., Adamson, J., Reed, M., Warburton, J., Arm-strong, A., and Evans, M.: Predicting the future carbon budget of an upland peat catchment, Climatic Change, 85, 139–158, doi:10.1007/s10584-007-9300-1, 2007.
Zscheischler, J., Mahecha, M. D., von Buttlar, J., Harmeling, S., Jung, M., Rammig, A., Randerson, J. T., Schoelkopf, B., Seneviratne, S. I., Tomelleri, E., Zaehle, S., and Reichstein, M.: A few extreme events dominate global interannual variability in gross primary production, Environ. Res. Lett., 9, 035001, doi:10.1088/1748-9326/9/3/035001, 2014a.