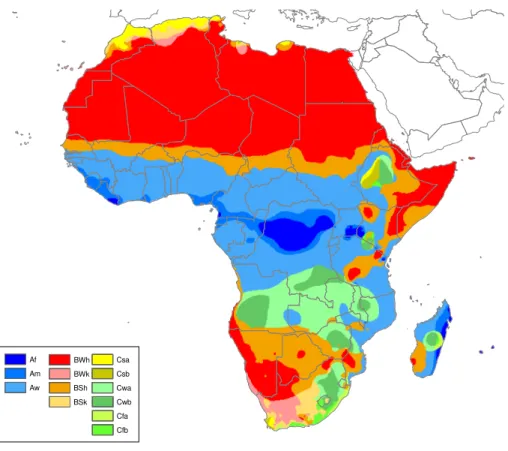
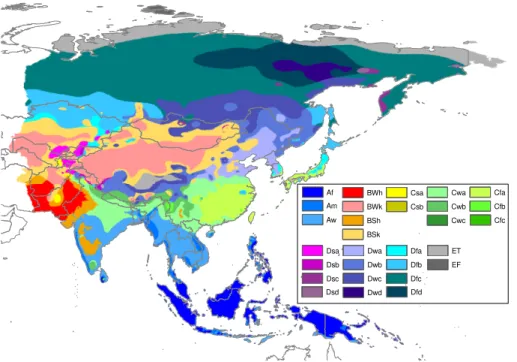
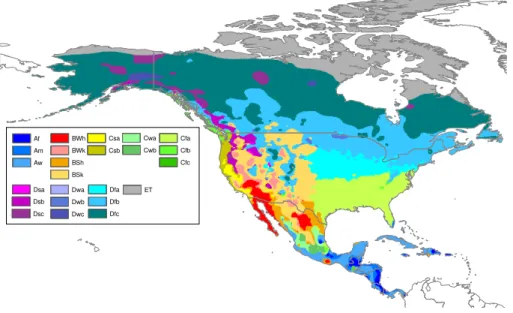
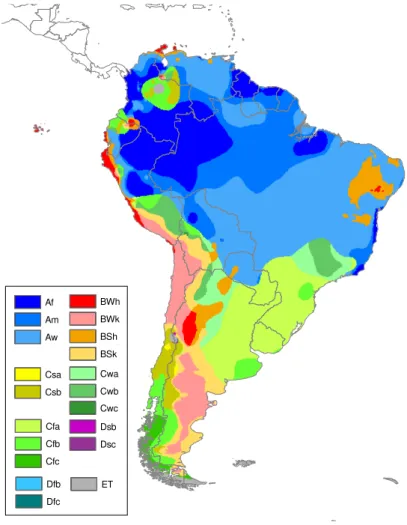
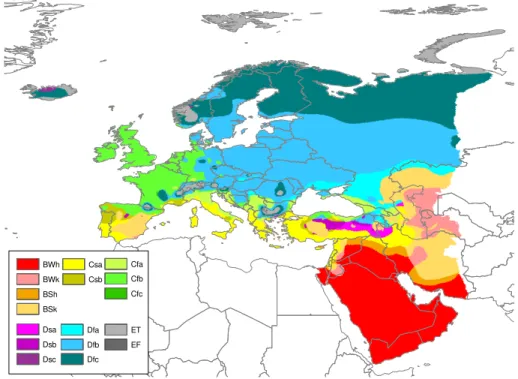
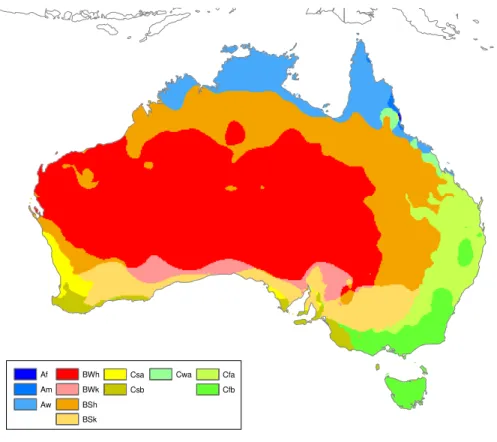
Updated world map of the Köppen-Geiger climate classification
Texto
Imagem

Documentos relacionados
Data on suction, water content, and temperature of the layers (waste and soil), climate (precipitation, relative humidity, air temperature, atmospheric pressure, wind velocity
The climate sensitivity and global mean annual surface air temperature warming of each of the models with simulations in the PlioMIP Experiment 2 ensemble.. Climate sensitivity is
Explicações possíveis para esta diminuição relacionam-se com a falta de quórum suficiente dentro do quadro do poder governativo quanto às questões agro- pecuárias;
soil map and climate data) to predict the water quantity and quality of the ungauged basin using the MapWindow version of SWAT (MWSWAT),.. • Using the Data Uncertainty Engine (DUE)
The probability of attending school four our group of interest in this region increased by 6.5 percentage points after the expansion of the Bolsa Família program in 2007 and
The analysis of the global mean changes in surface air temperature and precipitation already revealed that the range of uncertainty in the future climate change is large, with
Cfc (Temperate, Without Dry Season, Cold Summer) climate type only occurs in small areas (0.07 % of the continent) of Tasmania (Tas) under this historical baseline climate, under
Here, we focus on the presentation of the “large scale features” of Pliocene climate, that is, global annual mean surface air temperature response (di ff erence from the
